
Carcass classification of cultured salmon at BC aquaculture sites by fish health zone - 2016
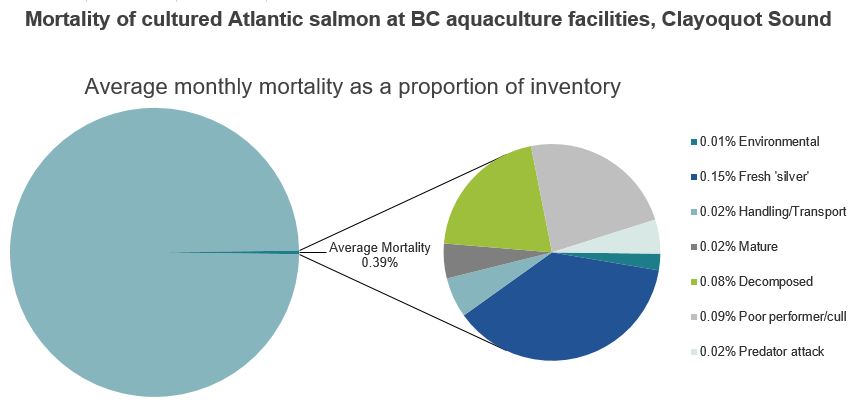
Licence holders are required to remove dead fish from net pens on a regular basis and categorize the fish according to the cause of death. These figures provide a break-down of mortality rates by carcass category. The pie chart represents the average monthly mortality in the zone during the specified time period.
January 1 to March 31
Long text version
Mortality of cultured Atlantic salmon at BC aquaculture facilities, Clayoquot Sound
Average monthly mortality as a proportion of inventory
| Monthly average remaining inventory | Average mortality | Environmental | Fresh 'silver' | Handling and transport | Mature | Old (decomposed) | Poor performer and cull | Predator attack |
| 99.61% | 0.39% | 0.01% | 0.15% | 0.02% | 0.02% | 0.08% | 0.09% | 0.02% |
Long text version
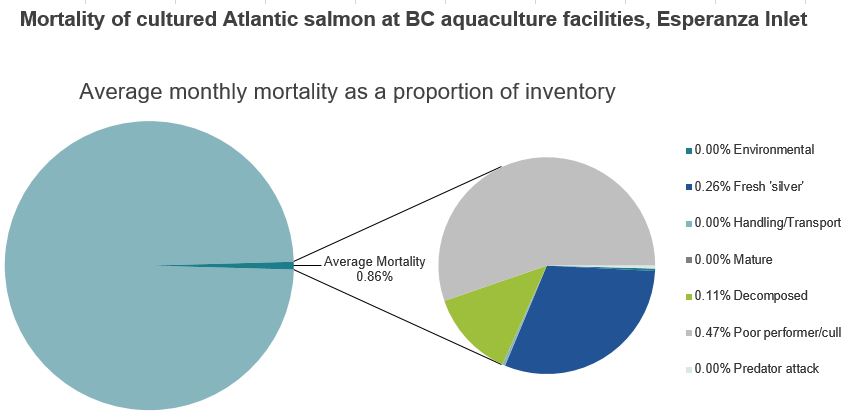
Mortality of cultured Atlantic salmon at BC aquaculture facilities, Esperanza Inlet
Average monthly mortality as a proportion of inventory
| Monthly average remaining inventory | Average mortality | Environmental | Fresh 'silver' | Handling and transport | Mature | Old (decomposed) | Poor performer and cull | Predator attack |
| 99.14% | 0.86% | 0.00% | 0.26% | 0.00% | 0.00% | 0.11% | 0.47% | 0.00% |
Long text version
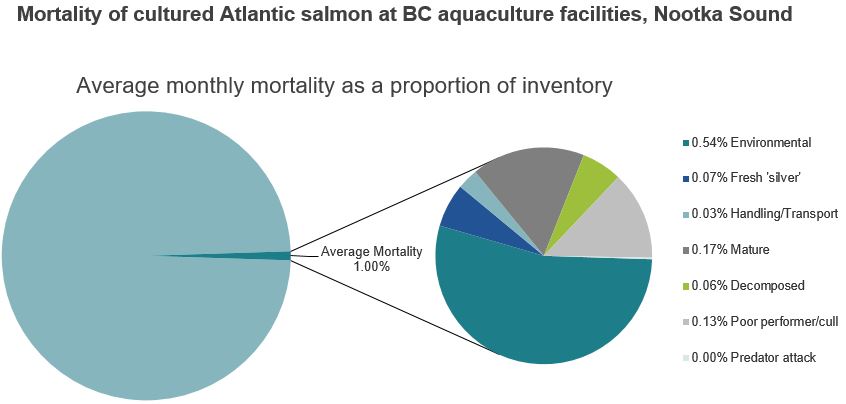
Mortality of cultured Atlantic salmon at BC aquaculture facilities, Nootka Sound
Average monthly mortality as a proportion of inventory
| Monthly average remaining inventory | Average mortality | Environmental | Fresh 'silver' | Handling and transport | Mature | Old (decomposed) | Poor performer and cull | Predator attack |
| 99.00% | 1.00% | 0.54% | 0.07% | 0.03% | 0.17% | 0.06% | 0.13% | 0.00% |
Long text version
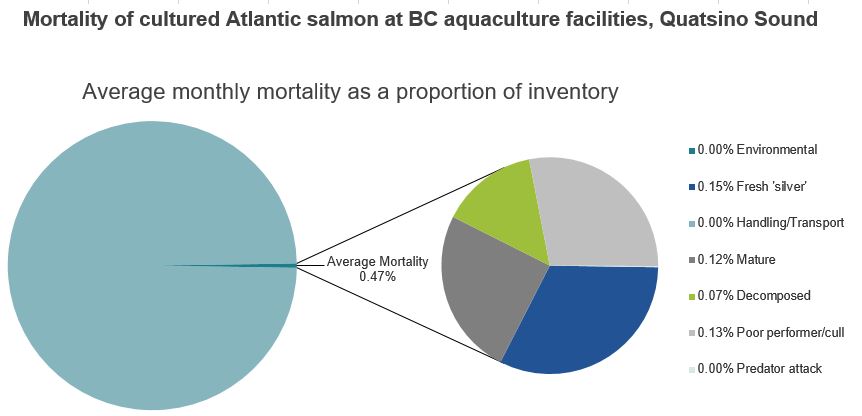
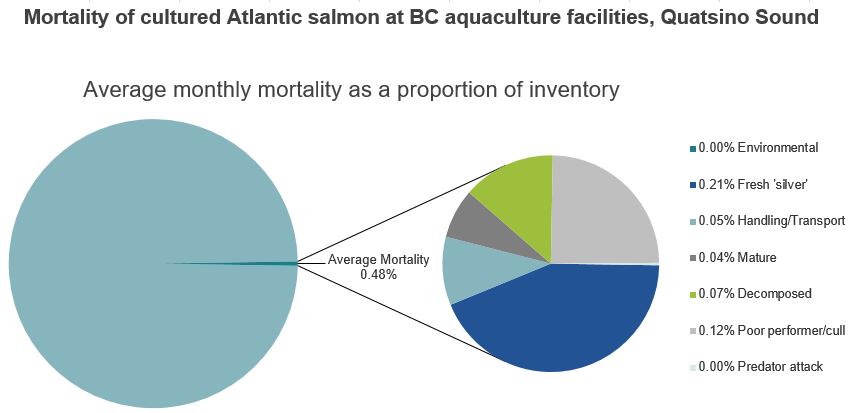
Mortality of cultured Atlantic salmon at BC aquaculture facilities, Quatsino Sound
Average monthly mortality as a proportion of inventory
| Monthly average remaining inventory | Average mortality | Environmental | Fresh 'silver' | Handling and transport | Mature | Old (decomposed) | Poor performer and cull | Predator attack |
| 99.53% | 0.47% | 0.00% | 0.15% | 0.00% | 0.12% | 0.07% | 0.13% | 0.00% |
Long text version
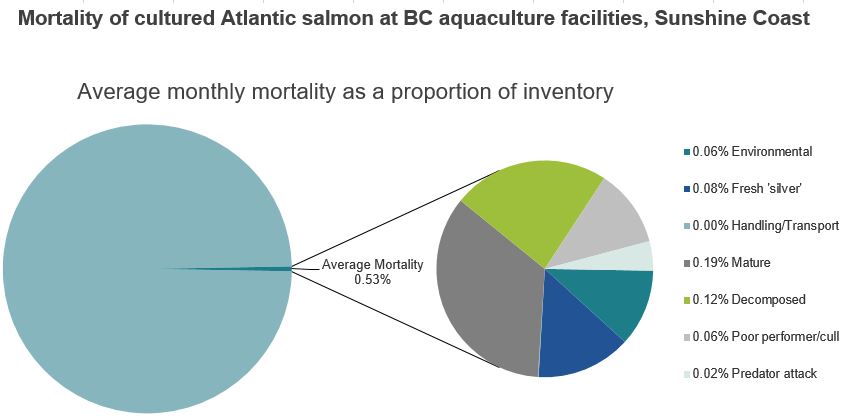
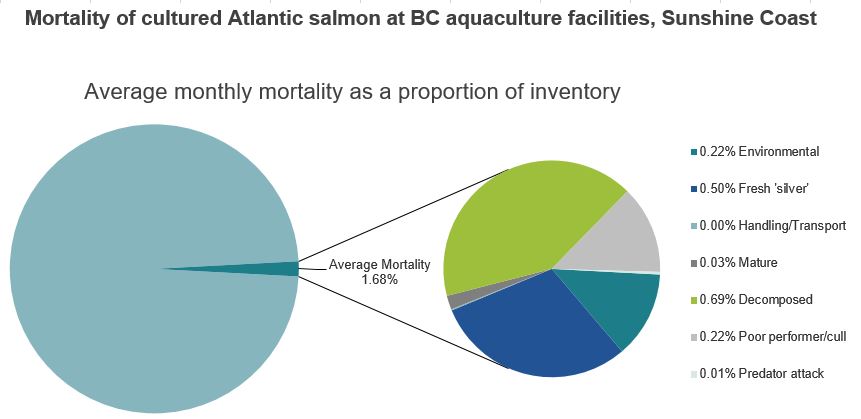
Mortality of cultured Atlantic salmon at BC aquaculture facilities, Sunshine Coast
Average monthly mortality as a proportion of inventory
| Monthly average remaining inventory | Average mortality | Environmental | Fresh 'silver' | Handling and transport | Mature | Old (decomposed) | Poor performer and cull | Predator attack |
| 99.47% | 0.53% | 0.06% | 0.08% | 0.00% | 0.19% | 0.12% | 0.06% | 0.02% |
Long text version
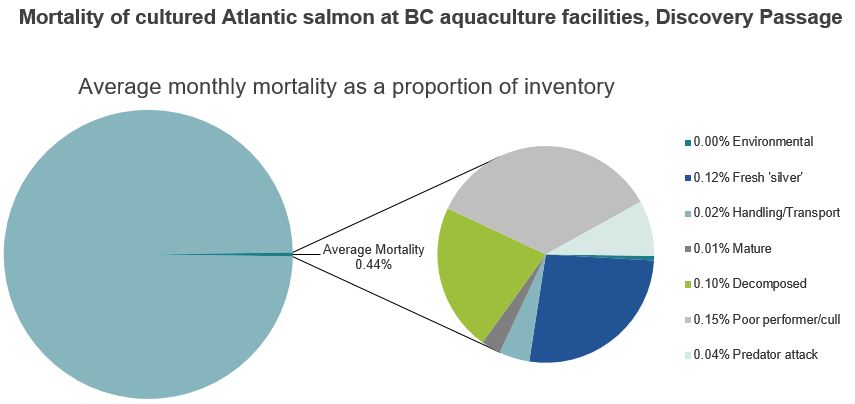
Mortality of cultured Atlantic salmon at BC aquaculture facilities, Discovery Passage
Average monthly mortality as a proportion of inventory
| Monthly average remaining inventory | Average mortality | Environmental | Fresh 'silver' | Handling and transport | Mature | Old (decomposed) | Poor performer and cull | Predator attack |
| 99.56% | 0.44% | 0.00% | 0.12% | 0.02% | 0.01% | 0.10% | 0.15% | 0.04% |
Long text version
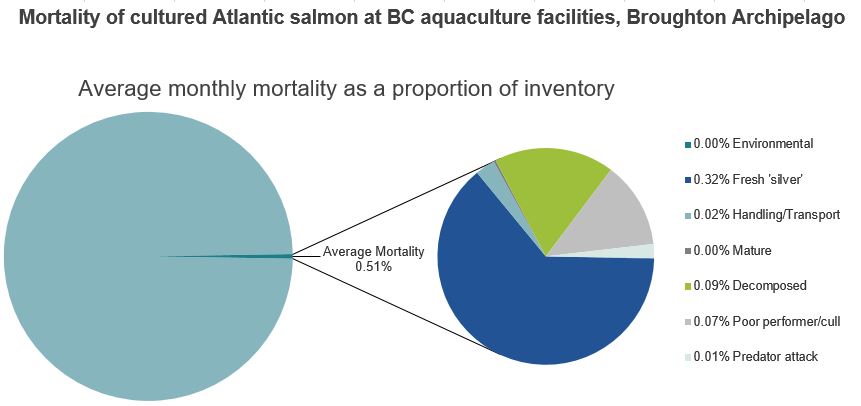
Mortality of cultured Atlantic salmon at BC aquaculture facilities, Broughton Archipelago
Average monthly mortality as a proportion of inventory
| Monthly average remaining inventory | Average mortality | Environmental | Fresh 'silver' | Handling and transport | Mature | Old (decomposed) | Poor performer and cull | Predator attack |
| 99.49% | 0.51% | 0.00% | 0.32% | 0.02% | 0.00% | 0.09% | 0.07% | 0.01% |

Long text version
Mortality of cultured Atlantic salmon at BC aquaculture facilities, Port Hardy
Average monthly mortality as a proportion of inventory
| Monthly average remaining inventory | Average mortality | Environmental | Fresh 'silver' | Handling and transport | Mature | Old (decomposed) | Poor performer and cull | Predator attack |
| 99.29% | 0.71% | 0.00% | 0.37% | 0.03% | 0.00% | 0.22% | 0.01% | 0.07% |
Long text version
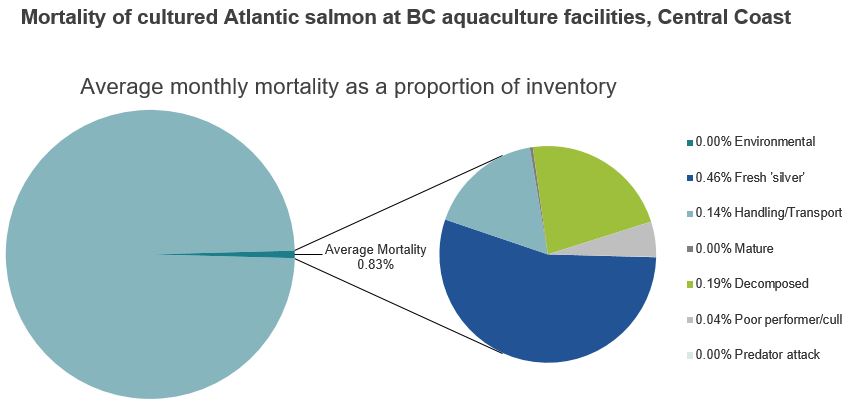
Mortality of cultured Atlantic salmon at BC aquaculture facilities, Central Coast
Average monthly mortality as a proportion of inventory
| Monthly average remaining inventory | Average mortality | Environmental | Fresh 'silver' | Handling and transport | Mature | Old (decomposed) | Poor performer and cull | Predator attack |
| 99.17% | 0.83% | 0.00% | 0.46% | 0.14% | 0.00% | 0.19% | 0.04% | 0.00% |
Long text version
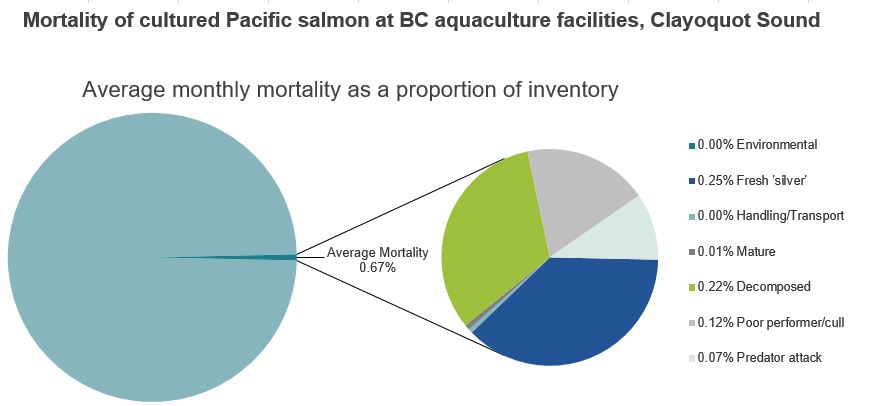
Mortality of cultured Pacific salmon at BC aquaculture facilities, Clayoquot Sound
Average monthly mortality as a proportion of inventory
| Monthly average remaining inventory | Average mortality | Environmental | Fresh 'silver' | Handling and transport | Mature | Old (decomposed) | Poor performer and cull | Predator attack |
| 99.33% | 0.67% | 0.00% | 0.25% | 0.00% | 0.01% | 0.22% | 0.12% | 0.07% |
April 1 to June 30
Long text version
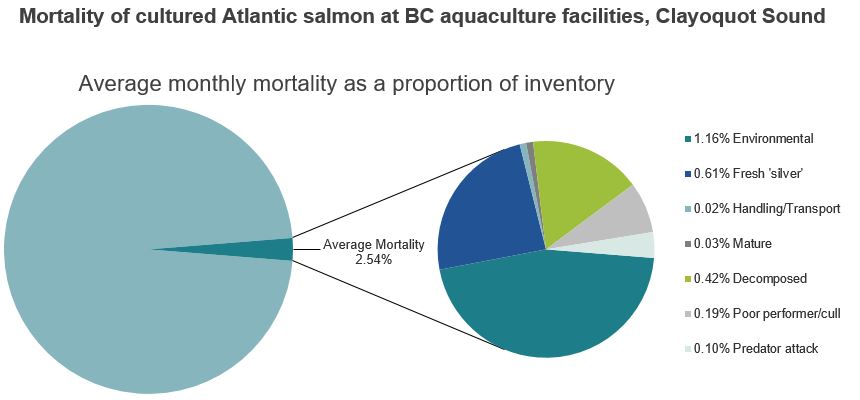
Mortality of cultured Atlantic salmon at BC aquaculture facilities, Clayoquot Sound
Average monthly mortality as a proportion of inventory
| Monthly average remaining inventory | Average mortality | Environmental | Fresh 'silver' | Handling and transport | Mature | Old (decomposed) | Poor performer and cull | Predator attack |
| 97.46% | 2.54% | 1.16% | 0.61% | 0.02% | 0.03% | 0.42% | 0.19% | 0.10% |
Long text version
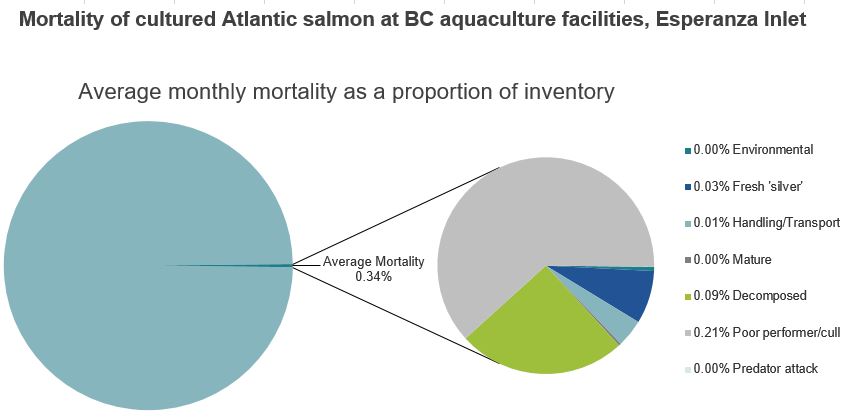
Mortality of cultured Atlantic salmon at BC aquaculture facilities, Esperanza Inlet
Average monthly mortality as a proportion of inventory
| Monthly average remaining inventory | Average mortality | Environmental | Fresh 'silver' | Handling and transport | Mature | Old (decomposed) | Poor performer and cull | Predator attack |
| 99.66% | 0.34% | 0.00% | 0.03% | 0.01% | 0.00% | 0.09% | 0.21% | 0.00% |
Long text version
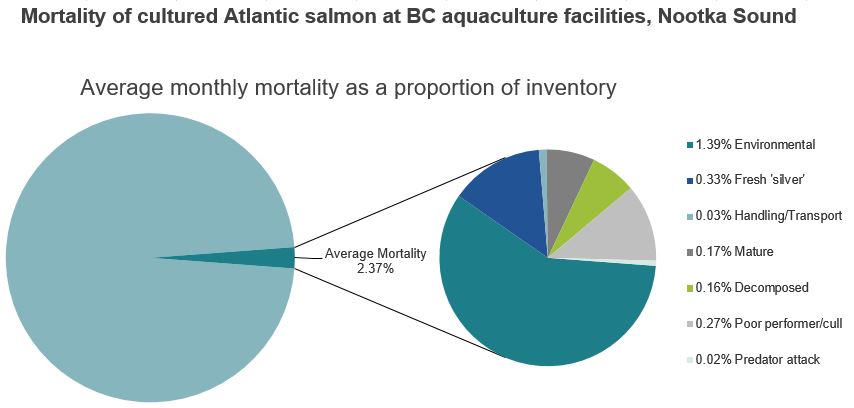
Mortality of cultured Atlantic salmon at BC aquaculture facilities, Nootka Sound
Average monthly mortality as a proportion of inventory
| Monthly average remaining inventory | Average mortality | Environmental | Fresh 'silver' | Handling and transport | Mature | Old (decomposed) | Poor performer and cull | Predator attack |
| 97.63% | 2.37% | 1.39% | 0.33% | 0.03% | 0.17% | 0.16% | 0.27% | 0.02% |
Long text version
Mortality of cultured Atlantic salmon at BC aquaculture facilities, Quatsino Sound
Average monthly mortality as a proportion of inventory
| Monthly average remaining inventory | Average mortality | Environmental | Fresh 'silver' | Handling and transport | Mature | Old (decomposed) | Poor performer and cull | Predator attack |
| 99.52% | 0.48% | 0.00% | 0.21% | 0.05% | 0.04% | 0.07% | 0.12% | 0.00% |
Long text version
Mortality of cultured Atlantic salmon at BC aquaculture facilities, Sunshine Coast
Average monthly mortality as a proportion of inventory
| Monthly average remaining inventory | Average mortality | Environmental | Fresh 'silver' | Handling and transport | Mature | Old (decomposed) | Poor performer and cull | Predator attack |
| 98.32% | 1.68% | 0.22% | 0.50% | 0.00% | 0.03% | 0.69% | 0.22% | 0.01% |

Long text version
Mortality of cultured Atlantic salmon at BC aquaculture facilities, Discovery Passage
Average monthly mortality as a proportion of inventory
| Monthly average remaining inventory | Average mortality | Environmental | Fresh 'silver' | Handling and transport | Mature | Old (decomposed) | Poor performer and cull | Predator attack |
| 99.58% | 0.42% | 0.02% | 0.14% | 0.02% | 0.00% | 0.11% | 0.12% | 0.01% |
Long text version
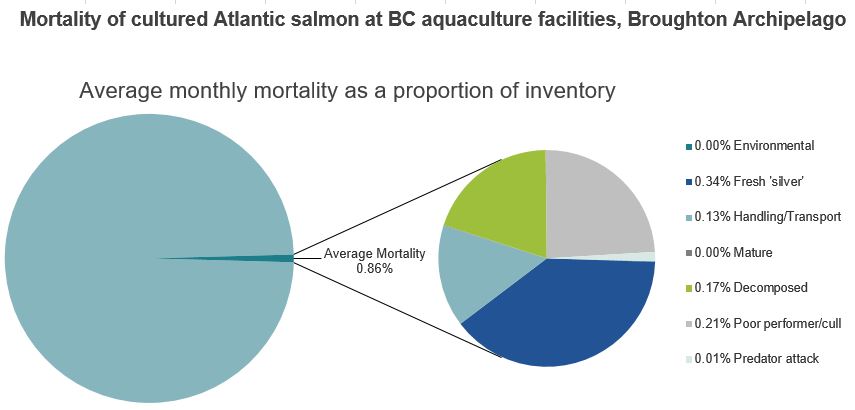
Mortality of cultured Atlantic salmon at BC aquaculture facilities, Broughton Archipelago
Average monthly mortality as a proportion of inventory
| Monthly average remaining inventory | Average mortality | Environmental | Fresh 'silver' | Handling and transport | Mature | Old (decomposed) | Poor performer and cull | Predator attack |
| 99.14% | 0.86% | 0.00% | 0.34% | 0.13% | 0.00% | 0.17% | 0.21% | 0.01% |
Long text version
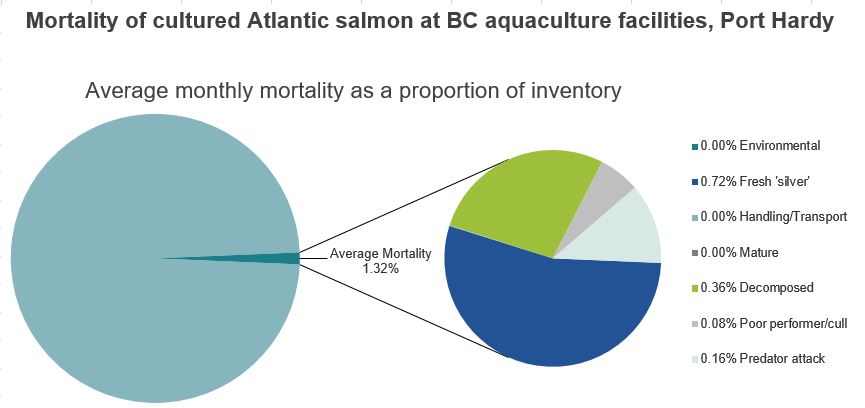
Mortality of cultured Atlantic salmon at BC aquaculture facilities, Port Hardy
Average monthly mortality as a proportion of inventory
| Monthly average remaining inventory | Average mortality | Environmental | Fresh 'silver' | Handling and transport | Mature | Old (decomposed) | Poor performer and cull | Predator attack |
| 98.68% | 1.32% | 0.00% | 0.72% | 0.00% | 0.00% | 0.36% | 0.08% | 0.16% |
Long text version
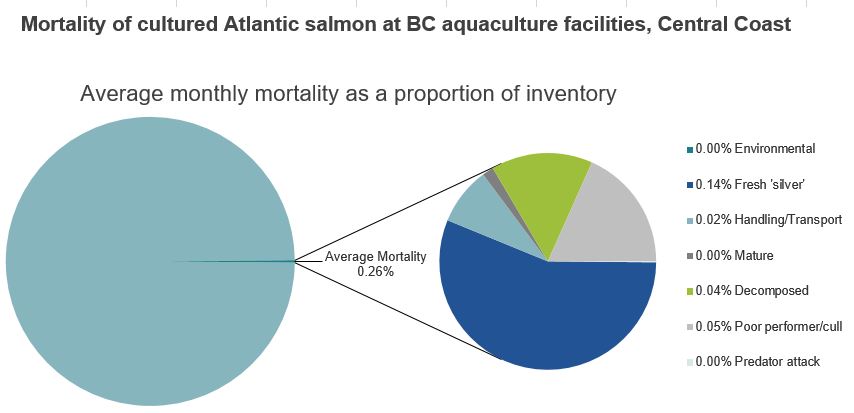
Mortality of cultured Atlantic salmon at BC aquaculture facilities, Central Coast
Average monthly mortality as a proportion of inventory
| Monthly average remaining inventory | Average mortality | Environmental | Fresh 'silver' | Handling and transport | Mature | Old (decomposed) | Poor performer and cull | Predator attack |
| 99.74% | 0.26% | 0.00% | 0.14% | 0.02% | 0.00% | 0.04% | 0.05% | 0.00% |
Long text version
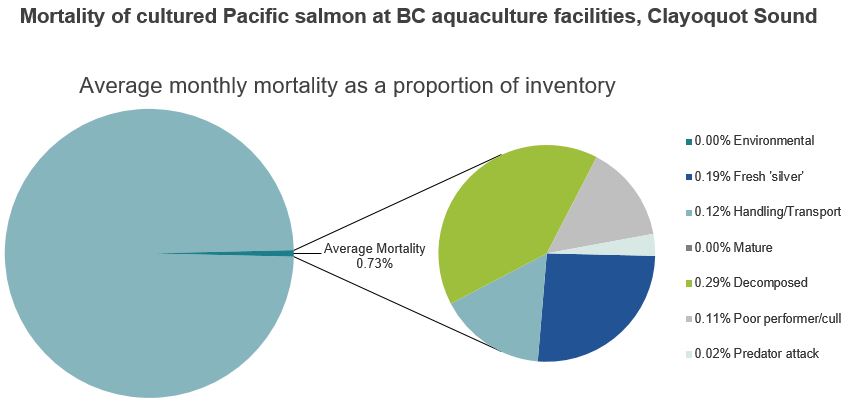
Mortality of cultured Pacific salmon at BC aquaculture facilities, Clayoquot Sound
Average monthly mortality as a proportion of inventory
| Monthly average remaining inventory | Average mortality | Environmental | Fresh 'silver' | Handling and transport | Mature | Old (decomposed) | Poor performer and cull | Predator attack |
| 99.27% | 0.73% | 0.00% | 0.19% | 0.12% | 0.00% | 0.29% | 0.11% | 0.02% |
July 1 to September 30
Long text version
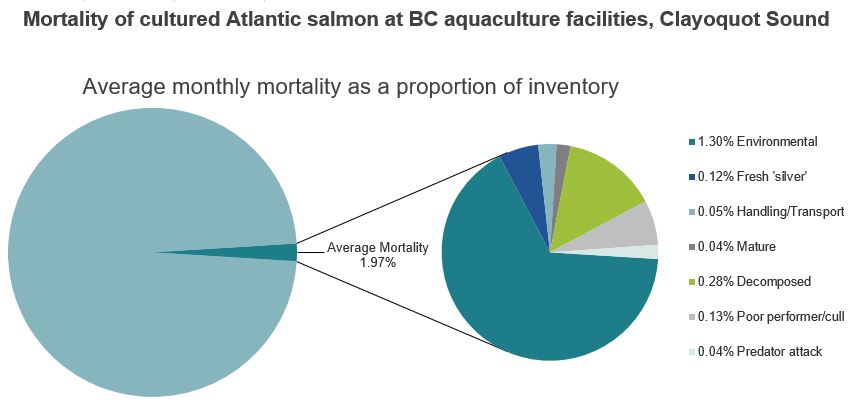
Mortality of cultured Atlantic salmon at BC aquaculture facilities, Clayoquot Sound
Average monthly mortality as a proportion of inventory
| Monthly average remaining inventory | Average mortality | Environmental | Fresh 'silver' | Handling and transport | Mature | Old (decomposed) | Poor performer and cull | Predator attack |
| 98.03% | 1.97% | 1.30% | 0.12% | 0.05% | 0.04% | 0.28% | 0.13% | 0.04% |
Long text version
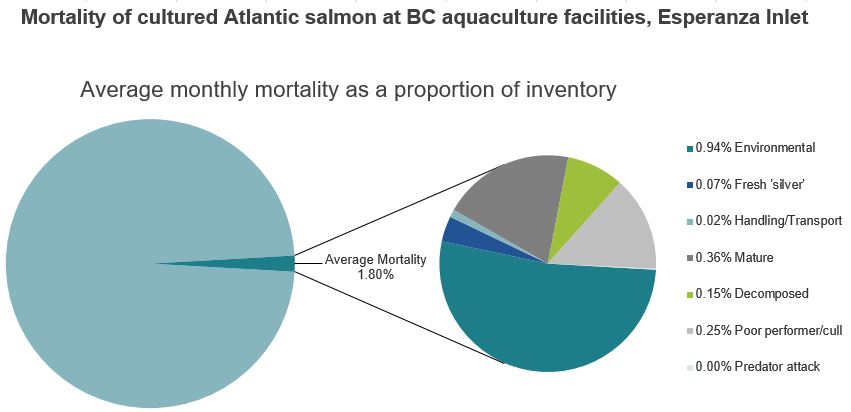
Mortality of cultured Atlantic salmon at BC aquaculture facilities, Esperanza Inlet
Average monthly mortality as a proportion of inventory
| Monthly average remaining inventory | Average mortality | Environmental | Fresh 'silver' | Handling and transport | Mature | Old (decomposed) | Poor performer and cull | Predator attack |
| 98.20% | 1.80% | 0.94% | 0.07% | 0.02% | 0.36% | 0.15% | 0.25% | 0.00% |
Long text version
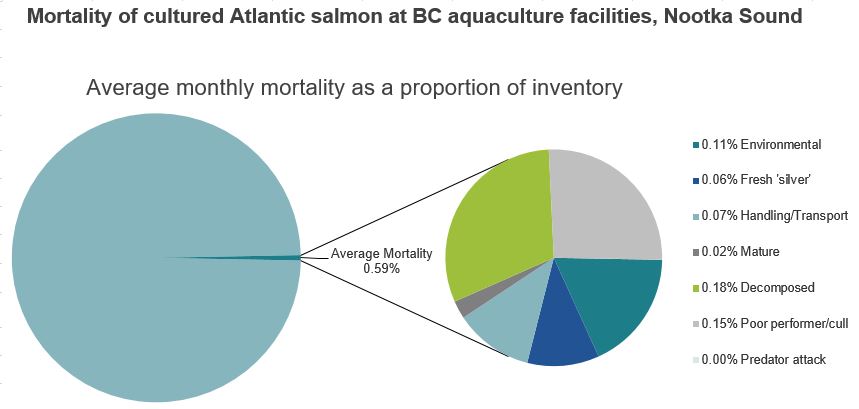
Mortality of cultured Atlantic salmon at BC aquaculture facilities, Nootka Sound
Average monthly mortality as a proportion of inventory
| Monthly average remaining inventory | Average mortality | Environmental | Fresh 'silver' | Handling and transport | Mature | Old (decomposed) | Poor performer and cull | Predator attack |
| 99.41% | 0.59% | 0.11% | 0.06% | 0.07% | 0.02% | 0.18% | 0.15% | 0.00% |
Long text version
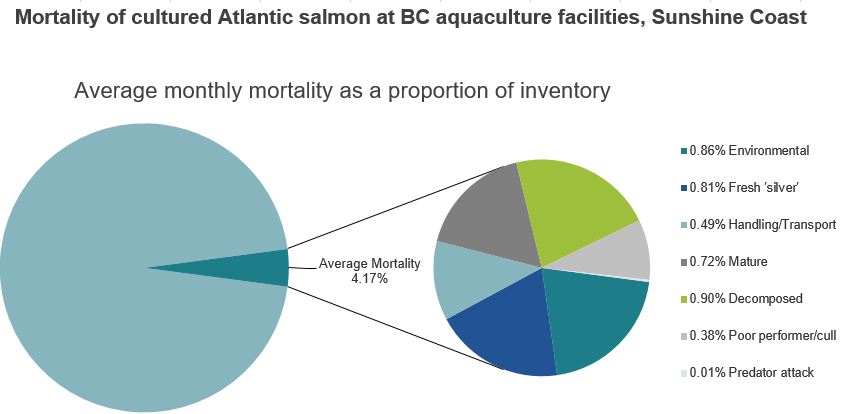
Mortality of cultured Atlantic salmon at BC aquaculture facilities, Sunshine Coast
Average monthly mortality as a proportion of inventory
| Monthly average remaining inventory | Average mortality | Environmental | Fresh 'silver' | Handling and transport | Mature | Old (decomposed) | Poor performer and cull | Predator attack |
| 95.83% | 4.17% | 0.86% | 0.81% | 0.49% | 0.72% | 0.90% | 0.38% | 0.01% |
Long text version
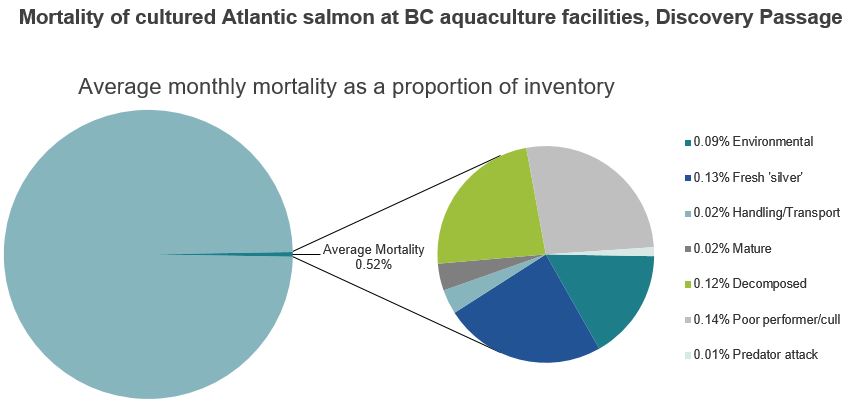
Mortality of cultured Atlantic salmon at BC aquaculture facilities, Discovery Passage
Average monthly mortality as a proportion of inventory
| Monthly average remaining inventory | Average mortality | Environmental | Fresh 'silver' | Handling and transport | Mature | Old (decomposed) | Poor performer and cull | Predator attack |
| 99.48% | 0.52% | 0.09% | 0.13% | 0.02% | 0.02% | 0.12% | 0.14% | 0.01% |
Long text version
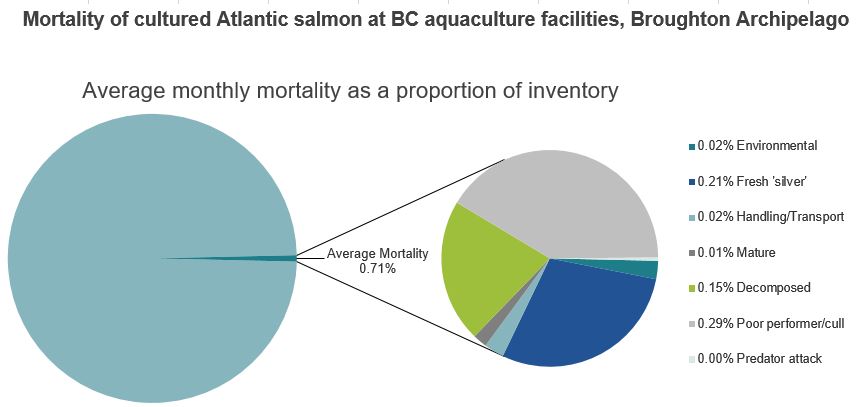
Mortality of cultured Atlantic salmon at BC aquaculture facilities, Broughton Archipelago
Average monthly mortality as a proportion of inventory
| Monthly average remaining inventory | Average mortality | Environmental | Fresh 'silver' | Handling and transport | Mature | Old (decomposed) | Poor performer and cull | Predator attack |
| 99.29% | 0.71% | 0.02% | 0.21% | 0.02% | 0.01% | 0.15% | 0.29% | 0.00% |
Long text version
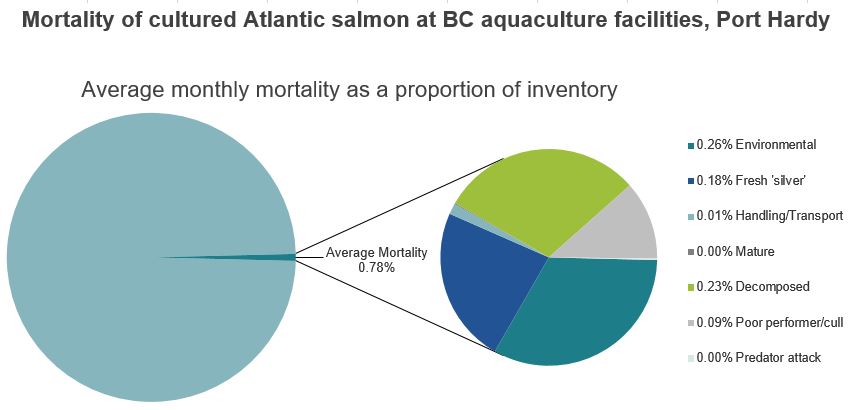
Mortality of cultured Atlantic salmon at BC aquaculture facilities, Port Hardy
Average monthly mortality as a proportion of inventory
| Monthly average remaining inventory | Average mortality | Environmental | Fresh 'silver' | Handling and transport | Mature | Old (decomposed) | Poor performer and cull | Predator attack |
| 99.22% | 0.78% | 0.26% | 0.18% | 0.01% | 0.00% | 0.23% | 0.09% | 0.00% |
Long text version
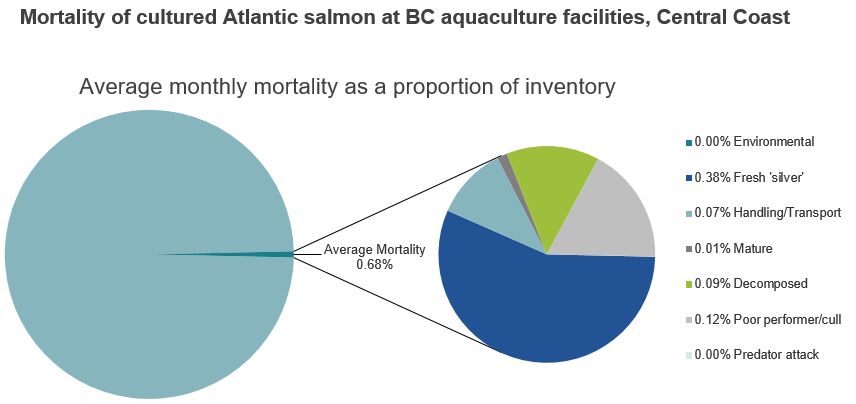
Mortality of cultured Atlantic salmon at BC aquaculture facilities, Central Coast
Average monthly mortality as a proportion of inventory
| Monthly average remaining inventory | Average mortality | Environmental | Fresh 'silver' | Handling and transport | Mature | Old (decomposed) | Poor performer and cull | Predator attack |
| 99.32% | 0.68% | 0.00% | 0.38% | 0.07% | 0.01% | 0.09% | 0.12% | 0.00% |

Long text version
Mortality of cultured Pacific salmon at BC aquaculture facilities, Clayoquot Sound
Average monthly mortality as a proportion of inventory
| Monthly average remaining inventory | Average mortality | Environmental | Fresh 'silver' | Handling and transport | Mature | Old (decomposed) | Poor performer and cull | Predator attack |
| 98.71% | 1.29% | 0.00% | 0.54% | 0.00% | 0.00% | 0.63% | 0.11% | 0.00% |
October 1 to December 31
Long text version
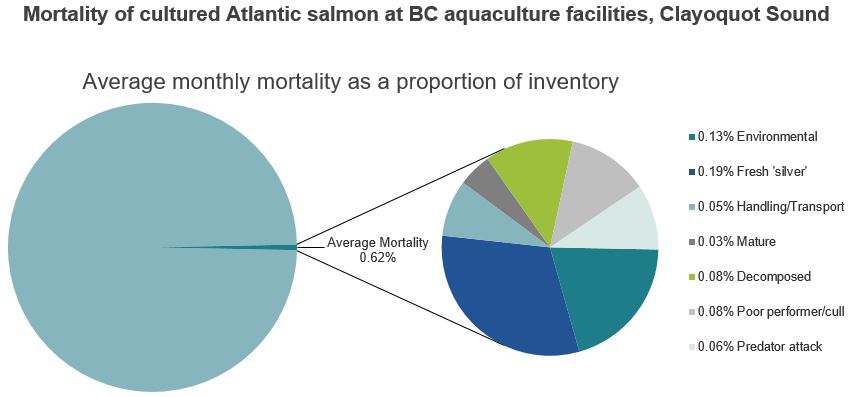
Mortality of cultured Atlantic salmon at BC aquaculture facilities, Clayoquot Sound
Average monthly mortality as a proportion of inventory
| Monthly average remaining inventory | Average mortality | Environmental | Fresh 'silver' | Handling and transport | Mature | Old (decomposed) | Poor performer and cull | Predator attack |
| 99.38% | 0.62% | 0.13% | 0.19% | 0.05% | 0.03% | 0.08% | 0.08% | 0.06% |
Long text version
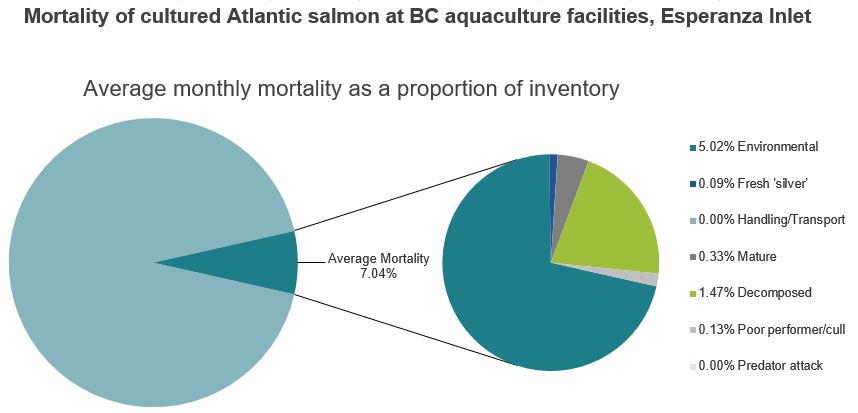
Mortality of cultured Atlantic salmon at BC aquaculture facilities, Esperanza Inlet
Average monthly mortality as a proportion of inventory
| Monthly average remaining inventory | Average mortality | Environmental | Fresh 'silver' | Handling and transport | Mature | Old (decomposed) | Poor performer and cull | Predator attack |
| 92.96% | 7.04% | 5.02% | 0.09% | 0.00% | 0.33% | 1.47% | 0.13% | 0.00% |
Long text version
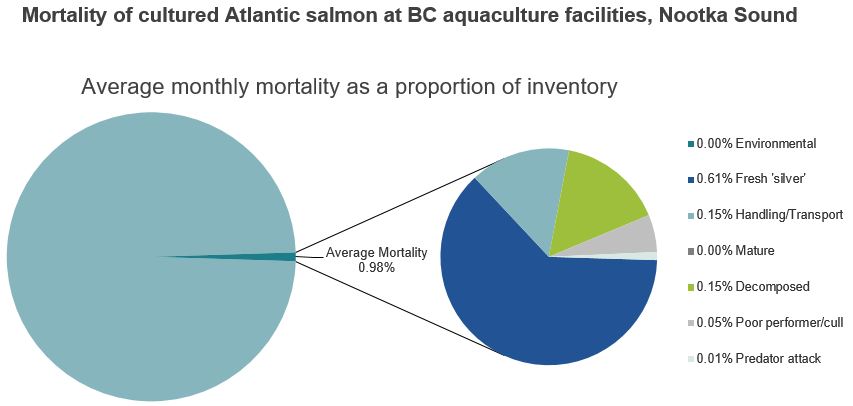
Mortality of cultured Atlantic salmon at BC aquaculture facilities, Nootka Sound
Average monthly mortality as a proportion of inventory
| Monthly average remaining inventory | Average mortality | Environmental | Fresh 'silver' | Handling and transport | Mature | Old (decomposed) | Poor performer and cull | Predator attack |
| 99.02% | 0.98% | 0.00% | 0.61% | 0.15% | 0.00% | 0.15% | 0.05% | 0.01% |
Long text version
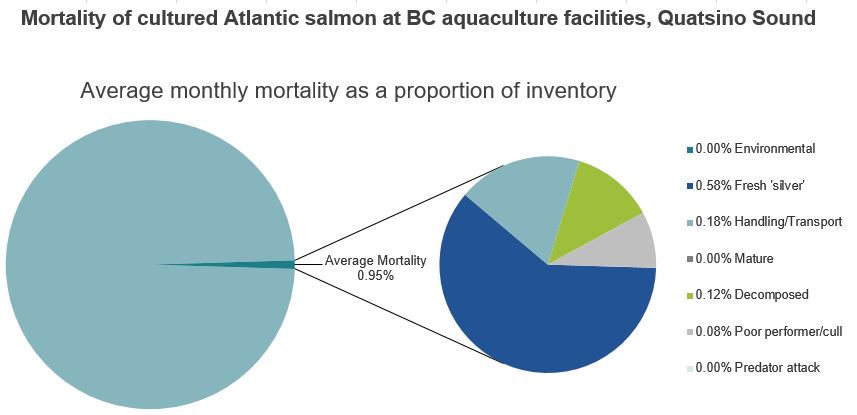
Mortality of cultured Atlantic salmon at BC aquaculture facilities, Quatsino Sound
Average monthly mortality as a proportion of inventory
| Monthly average remaining inventory | Average mortality | Environmental | Fresh 'silver' | Handling and transport | Mature | Old (decomposed) | Poor performer and cull | Predator attack |
| 99.05% | 0.95% | 0.00% | 0.58% | 0.18% | 0.00% | 0.12% | 0.08% | 0.00% |
Long text version
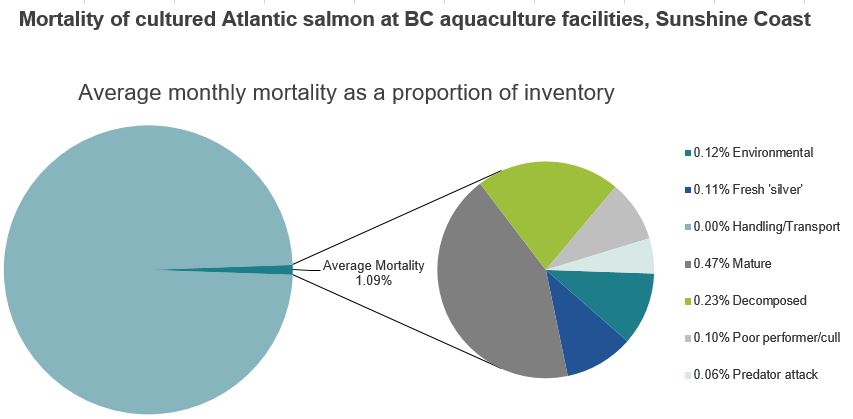
Mortality of cultured Atlantic salmon at BC aquaculture facilities, Sunshine Coast
Average monthly mortality as a proportion of inventory
| Monthly average remaining inventory | Average mortality | Environmental | Fresh 'silver' | Handling and transport | Mature | Old (decomposed) | Poor performer and cull | Predator attack |
| 98.91% | 1.09% | 0.12% | 0.11% | 0.00% | 0.47% | 0.23% | 0.10% | 0.06% |
Long text version
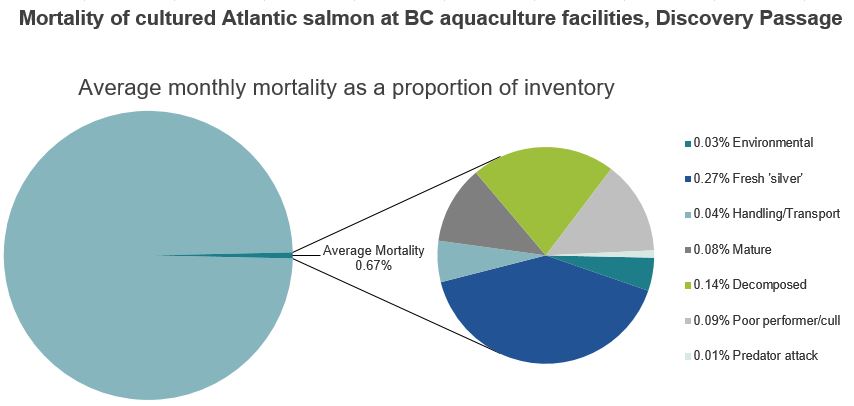
Mortality of cultured Atlantic salmon at BC aquaculture facilities, Discovery Passage
Average monthly mortality as a proportion of inventory
| Monthly average remaining inventory | Average mortality | Environmental | Fresh 'silver' | Handling and transport | Mature | Old (decomposed) | Poor performer and cull | Predator attack |
| 99.33% | 0.67% | 0.03% | 0.27% | 0.04% | 0.08% | 0.14% | 0.09% | 0.01% |
Long text version
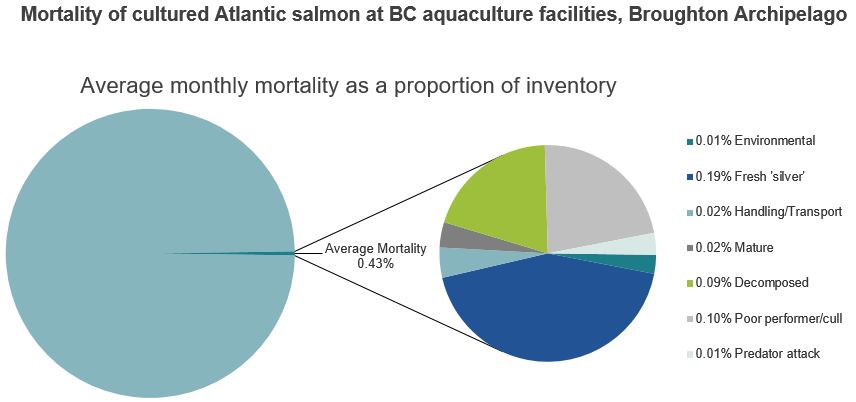
Mortality of cultured Atlantic salmon at BC aquaculture facilities, Broughton Archipelago
Average monthly mortality as a proportion of inventory
| Monthly average remaining inventory | Average mortality | Environmental | Fresh 'silver' | Handling and transport | Mature | Old (decomposed) | Poor performer and cull | Predator attack |
| 99.57% | 0.43% | 0.01% | 0.19% | 0.02% | 0.02% | 0.09% | 0.10% | 0.01% |
Long text version
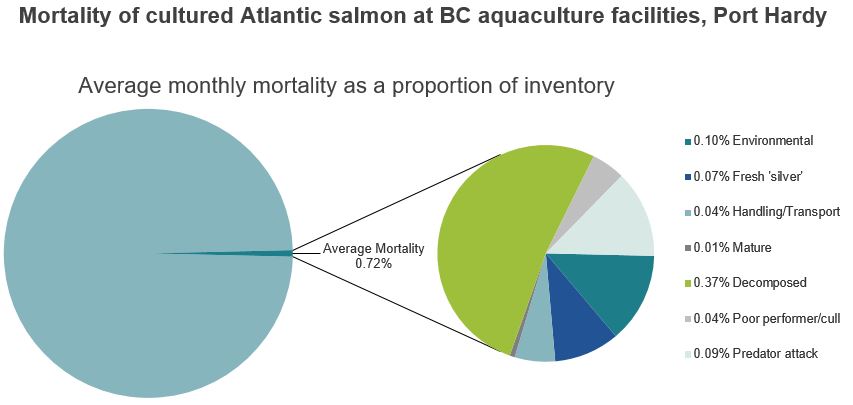
Mortality of cultured Atlantic salmon at BC aquaculture facilities, Port Hardy
Average monthly mortality as a proportion of inventory
| Monthly average remaining inventory | Average mortality | Environmental | Fresh 'silver' | Handling and transport | Mature | Old (decomposed) | Poor performer and cull | Predator attack |
| 99.28% | 0.72% | 0.10% | 0.07% | 0.04% | 0.01% | 0.37% | 0.04% | 0.09% |
Long text version
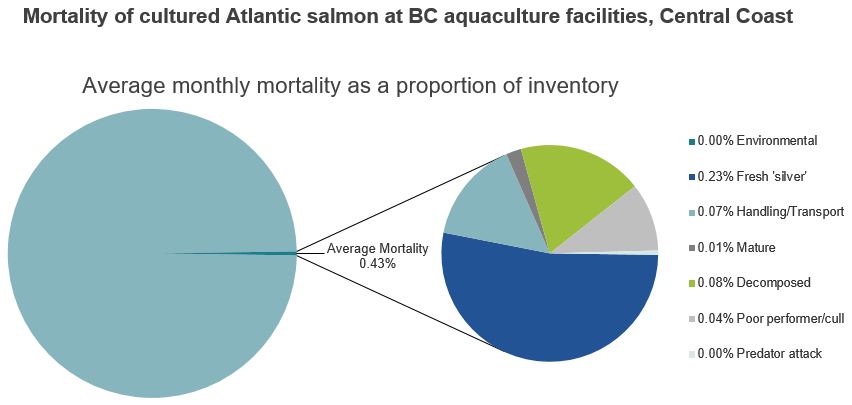
Mortality of cultured Atlantic salmon at BC aquaculture facilities, Central Coast
Average monthly mortality as a proportion of inventory
| Monthly average remaining inventory | Average mortality | Environmental | Fresh 'silver' | Handling and transport | Mature | Old (decomposed) | Poor performer and cull | Predator attack |
| 99.57% | 0.43% | 0.00% | 0.23% | 0.07% | 0.01% | 0.08% | 0.04% | 0.00% |
Long text version
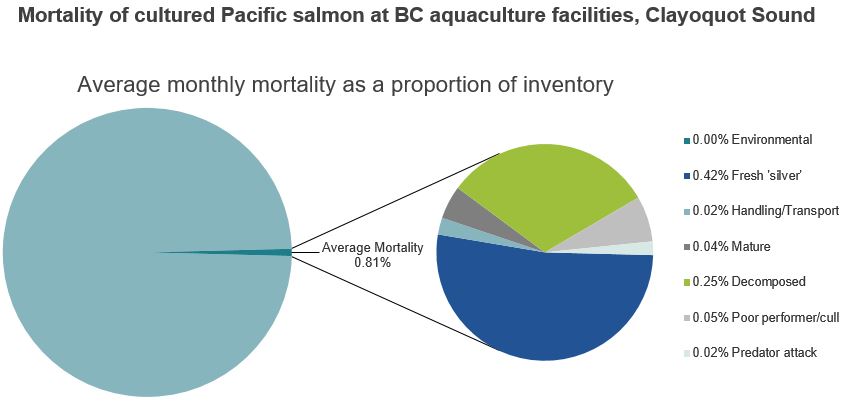
Mortality of cultured Pacific salmon at BC aquaculture facilities, Clayoquot Sound
Average monthly mortality as a proportion of inventory
| Monthly average remaining inventory | Average mortality | Environmental | Fresh 'silver' | Handling and transport | Mature | Old (decomposed) | Poor performer and cull | Predator attack |
| 99.19% | 0.81% | 0.00% | 0.42% | 0.02% | 0.04% | 0.25% | 0.05% | 0.02% |
- Date modified: