
Fukushima radioactivity monitoring in the North Pacific Ocean
We have measured oceanic radioactive contamination in Canadian Pacific waters since the discharge of radiation from the damaged the Fukushima Dai-ichi nuclear power plant in 2011.
The concentrations of 137Cs in the Northeast Pacific Ocean following the discharge of radioactive material from Fukushima reached a high of 8.5 Bq/m3 in 2016. This is well below Canadian guidelines for drinking water quality for which the maximum acceptable concentration (MAC) is 10,000 Bq/m3. Therefore, these levels do not represent a radiological threat to human health or the environment.
While these results suggest that Fukushima-generated radiation levels do not represent a threat to Canada, continued and long term studies like this allow scientists to better assess potential impacts of future radioactivity discharges to the oceans on humans and the environment.
Research
On March 11, 2011, a massive 9.0 magnitude earthquake triggered a tsunami off the coast of Japan. It severely damaged the Fukushima Dai-ichi nuclear power plant, resulting in the discharge of a radioactive plume into the atmosphere and ocean. The resulting large oceanic plume was dissipated rapidly by currents, tidal forces and eddies in the energetic coastal waters off Japan, but a significant remnant was transported eastward by the Oyashio and Kuroshio current systems.
Shortly after the accident, we established an ocean monitoring program to detect the arrival of Fukushima radioactivity in the eastern North Pacific and Arctic Oceans. We began measuring the cesium (Cs) isotopes 134Cs and 137Cs in June 2011 on Line P which is a historic series of oceanographic stations extending 1500 km westward from British Columbia into the interior of the Alaska Gyre in the North Pacific. Samples were also collected annually on vessels in the Bering Sea and Arctic Ocean in order to develop a detailed time series of the flow and ultimate fate of the Fukushima contamination.
Data collected in this study represents the initial stages of a Fukushima radioactivity monitoring program on Line P and in arctic and sub-arctic waters that continued to 2022 and which documented the Fukushima discharge of radioactivity into the global ocean in unprecedented detail.

Long text version
Figure 1. Fukushima 134Cs and 137Cs discharge
Fukushima 134Cs and 137Cs discharges from the 2011 accident were transported eastward across the Pacific Ocean by the Subarctic and North Pacific currents and then northward across Line P (a DFO sampling line) on the eastern edge of the Alaska Gyre. Time series measurements of the Fukushima contamination have been carried out by us on multiples cruises since 2011.
Timeline of results
- In June 2012 (about 1.3 years after the accident) a small amount of 134Cs was detected at the western end of Line P. Measurements of this short-lived isotope indicated that the source was from Fukushima. This let scientists determine what portion of the longer-lived isotope, 137Cs, was derived from Fukushima and what portion was pre-existing from atmospheric fallout.
- By June 2013 134Cs had been detected in surface waters along the entire extent of Line P to the Canadian continental shelf.
- By 2014 134Cs was measurable northward into the Bering Sea (see articles published in Proceedings of the National Academy of Sciences (PNAS) in 2015 and Environmental Science and Technology in 2017).
- In 2016, levels of Fukushima 137Cs measured about 7 Bq/m3 on Line P. Given that the 137Cs atmospheric nuclear weapons tests fallout from the 1950s and early 1960s averaged 1.5 Bq/m3 in surface water on Line P, this can be viewed as increasing the weapon test fallout background by a factor of about 5. In comparison to historical atmospheric fallout in North Pacific surface water, this total 137Cs value (Fukushima plus weapon test fallout 137Cs) of 8.5 Bq/m3 measured at Station 16 indicates that 137Cs levels in specific water masses such as the Alaska Current had temporarily returned to fallout levels that prevailed in the early 1970s.
- Between 2018 and 2022, measurements of Fukushima 137Cs carried out in the Bering and Beaufort Seas in the southern Arctic Ocean revealed low levels of Fukushima 137Cs that increased the fallout background by about 1 Bq/m3. This represents the transport of Fukushima contamination from the westward flowing Alaska Stream through the Aleutian Islands and the Bering Sea (see Figure 1) on time scales of the order of 6-10 years from the time of the reactor accident. This matches predictions by model simulations.
Detailed findings
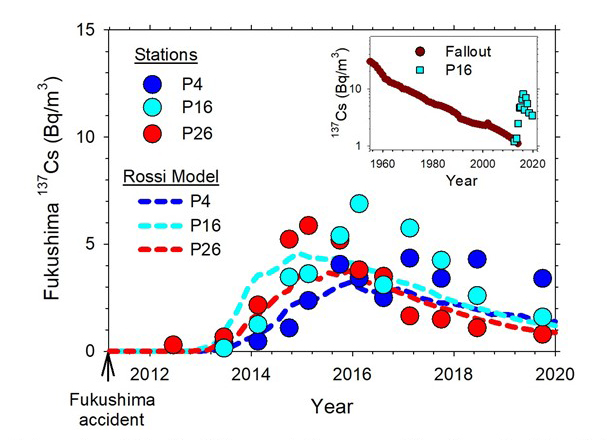
A comparison of the Line P time series for mean, surface mixed layer (0–150 m) Fukushima 137Cs concentrations at Stations P4, P16 and P26 with the results of a model simulation is presented in this graph.
Long text version
Figure 2. Measured and predicted Fukushima 137Cs concentrations in surface water
Figure 2. Comparison of Fukushima 137Cs concentrations measured in surface water at Stations P4, P16 and P26 with Rossi model time series predictions (dashed lines). In February 2016, levels of 137Cs were still increasing at Station P4 over the shelf, but had begun to decline at Station 26 in the interior of the subpolar gyre and have continued to decline on Line P through 2019 in good agreement with model predictions. Inset: 137Cs results are compared to the historical record for 137Cs fallout levels in the North Pacific.
The model time series for Fukushima 137Cs slightly lags behind the measured values at the westernmost location (Station P26).
Measured values of Fukushima 137Cs at Station P16 between August 2015 and February 2016 are higher than the model values, but subsequent measurements at Station 16 in 2016 and 2017 supported model predictions of a post-2015 decreasing trend in the Fukushima 137Cs concentration.
The model is in good agreement with the measured Fukushima 137Cs time series at the shelf edge location (Station P4) where confounding factors such as the early atmospheric delivery of Fukushima 137Cs and enhanced stratification associated with warm sea surface temperature (SST) anomalies may have had minimal impact.
Generally, the model-data comparison indicates that Line P surface mixed layer Fukushima 137Cs concentrations were greatest in 2015 and 2016 and began to decline in 2017 to 2018 as predicted by circulation models.
Related links
- Date modified: