
Results of the Pacific tidal recreational fishing survey, 2021
On this page
- Pacific tidal recreational fishing 2000 to 2021, fast facts
- Pacific tidal fishing spatial and temporal patterns, 2021
- Pacific tidal fishing regional patterns in 2021
- Pacific tidal fishing 2021, Pacific salmon
- Pacific tidal recreational fishing 2010 to 2021, trends
- Pacific tidal recreational fishing 2021, COVID-19
- Pacific tidal fishing expenditure trends
- Pacific tidal fishing expenditures, 2021
- Pacific tidal fishing package deals, 2021
- Notes and methodology
Pacific tidal recreational fishing 2000 to 2021, fast facts

Long text version
Pacific tidal recreational fishing 2000 to 2020, fast facts
Key metrics for the pacific tidal recreational fishing industry. Metrics exclude Juvenile and Family Fishing Weekend licence holders. All values reflect the average from 2000 to 2021. Dollar amounts are in 2021 dollars.
- Expenditures ($712M)
- Angling (1.84M)
- Active fishers (225K)
- Licence sales (312K)
- Number of salmon stamps (218K)
- GDP contribution ($361M)
- Household income ($236M)
- Jobs (4,400)
There is considerable economic spin-off value generated by the tidal water recreational sector with expenditures averaging $712M over the past 20 years. Of these expenditures, $361M was value added by the recreational fishing industry to provincial GDP.
Salmon was the primary target on 70% of fishing trips in BC tidal waters, with chinook being the most targeted species in 2021.
Recreational Fishers: While BC residents dominate sport fishing in British Columbia, there is a growing interest in tidal water fishing from visitors to the province.
Recreational fishers spent 8.2 days per year fishing, on average. By residency, the average number of fishing days and active fishers are:
- BC residents
- 1.57M days
- 159K active fishers
- Other Canadian
- 128K days
- 33K active fishers
- International
- 140K days
- 33K active fishers
Pacific tidal fishing spatial and temporal patterns, 2021

Long text version
Pacific tidal fishing spatial and temporal patterns, 2021
Participation and spending trends had been fairly consistent since 2000 until COVID-19 in 2020. The following are trends over the last 20 year period. Dollar amounts are in 2020 dollars.
Fishing activity peaks in the summer months with 76% of fishing occurring from June to September
In 2021, 87% of fishing days and 77% of expenditures took place in the Strait of Georgia, Barkley Sound, Johnstone Strait, and the West Coast of Vancouver Island.
Fishing days and expenditures by month are presented from April to March, the fishing year.
2019-20 fishing days
- April 98K
- May 152K
- June 280K
- July 477K
- August 570K
- September 236K
- October 86K
- November 25K
- December 19K
- January 15K
- February 28K
- March 45K
2020-21 fishing days
- April 64K
- May 103K
- June 167K
- July 298K
- August 356K
- September 178K
- October 59K
- November 25K
- December 22K
- January 22K
- February 24K
- March 36K
2021-22 fishing days
- April 62K
- May 94K
- June 172K
- July 308K
- August 392K
- September 177K
- October 57K
- November 16K
- December 13K
- January 17K
- February 23K
- March 30K
2020-21 expenditures (2021 $)
- April $14M
- May $22M
- June $51M
- July $121M
- August $144M
- September $64M
- October $18M
- November $6M
- December $5M
- January $6M
- February $10M
- March $11M
2021-22 expenditures (2021 $)
- April $15M
- May $24M
- June $64M
- July $144M
- August $223M
- September $72M
- October $16M
- November $4M
- December $4M
- January $4M
- February $10M
- March $10M
Pacific tidal fishing regional patterns in 2021

Long text version
Pacific tidal fishing regional patterns in 2021
Key metrics for each of the seven pacific tidal recreational fishing regions.
Values reflect the 2021-22 fishing year and dollar amounts are in 2021 dollars.
North Coast
- 50,000 fishing days
- 13,000 active fishers
- $36 M expenditures
- $734 expenditures per day
- Expenditure percentage by species
- Halibut (26%)
- Coho (25%)
- Chinook (16%)
- Crab (10%)
- Other(24%)
Haida Gwaii
- 62,000 fishing days
- 10,000 active fishers
- $67 M expenditures
- $1,076 expenditures per day
- Expenditure percentage by species
- Chinook (33%)
- Coho (28%)
- Halibut (16%)
- Lingcod (9%)
- Other(14%)
Central Coast
- 71,000 fishing days
- 10,000 active fishers
- $35 M expenditures
- $489 expenditures per Day
- Expenditure percentage by species
- Chinook (26%)
- Coho (25%)
- Halibut (16%)
- Crab (10%)
- Other(24%)
Johnstone Strait
- 166,000 fishing days
- 30,000 active fishers
- $75 M expenditures
- $454 expenditures per day
- Expenditure percentage by species
- Chinook (34%)
- Coho (20%)
- Lingcod (10%)
- Pink or Chum (9%)
- Other (27%)
Strait of Georgia
- 680,000 fishing days
- 103,000 active fishers
- $222 M expenditures
- $327 expenditures per day
- Expenditure percentage by species
- Chinook (33%)
- Crab (17%)
- Coho (15%)
- Shrimp or Prawn (8%)
- Other(27%)
West Coast Vancouver Island
- 106,000 fishing days
- 21,000 active fishers
- $64 M expenditures
- $591 expenditures per day
- Expenditure percentage by species
- Chinook (36%)
- Coho (21%)
- Lingcod (13%)
- Halibut (13%)
- Other (17%)
Barkley Sound
- 226,000 fishing days
- 41,000 active fishers
- $91 M expenditures
- $403 expenditures per day
- Expenditure percentage by species
- Chinook (37%)
- Coho (18%)
- Halibut (9%)
- Crab (9%)
- Other (26%)
Chinook were the primary target species in all regions other than the North Coast.
Fishing expenditures and days by region
Fishing expenditures
- North Coast: $36,440,036; 6% of coast wide fishing expenditures
- Haida Gwaii: $67,029,343; 11% of coast wide fishing expenditures
- Central Coast: $34,577,130; 6% of coast wide fishing expenditures
- Johnstone Strait: $75,390,135; 13% of coast wide fishing expenditures
- Strait of Georgia: $222,421,641; 38% of coast wide fishing expenditures
- West Coast Vancouver Island: $62,553,668; 11% of coast wide fishing expenditures
- Barkley Sound: $91,316,785; 15% of coast wide fishing expenditures
Fishing days
- North Coast: 49,620; 4% of coast wide fishing days
- Haida Gwaii: 62,291; 5% of coast wide fishing days
- Central Coast: 70,779; 5% of coast wide fishing days
- Johnstone Strait: 166,176; 12% of coast wide fishing days
- Strait of Georgia: 680,179; 50% of coast wide fishing days
- West Coast Vancouver Island: 105,889; 8% of coast wide fishing days
- Barkley Sound: 226,423; 17% of coast wide fishing days
50% of fishing days and 38% of fishing expenditures took place in the strait of Georgia in 2021.
Pacific tidal fishing 2021, Pacific salmon

Long text version
Pacific tidal fishing 2021, Pacific salmon
Salmon are the most targeted recreational species group in BC tidal waters, with chinook being the primary target in 2021.
- Salmon stamps were purchased by 70% of tidal water recreational licence holders
- Fishing trips targeting salmon accounted for 64% of recreational trips
- Chinook made up 62% of all recreational salmon efforts
Days and expenditures by species
Fishing expenditures by species (2021 $):
- Chinook $192M
- Coho $115M
- Pink or Chum$27M
- Sockeye $10M
- Crab $61M
- Shrimp or prawn $33M
- Other $4M
- Halibut $54M
- Lingcod $46M
- Rockfish $31M
- Tuna $1M
- Other $8M
Fishing days by species group:
- Salmon 685K
- Shellfish 354K
- Non-salmon finfish 292K
Recreational fishers rarely target only a single species:
106K recreational fishers targeted chinook in 2021, of these:
- 54% fished for chinook, other salmon, and other non-salmon species
- 16% fished for chinook and other salmon species only
- 15% fished for chinook and other non-salmon species only
- 15% fished only for chinook
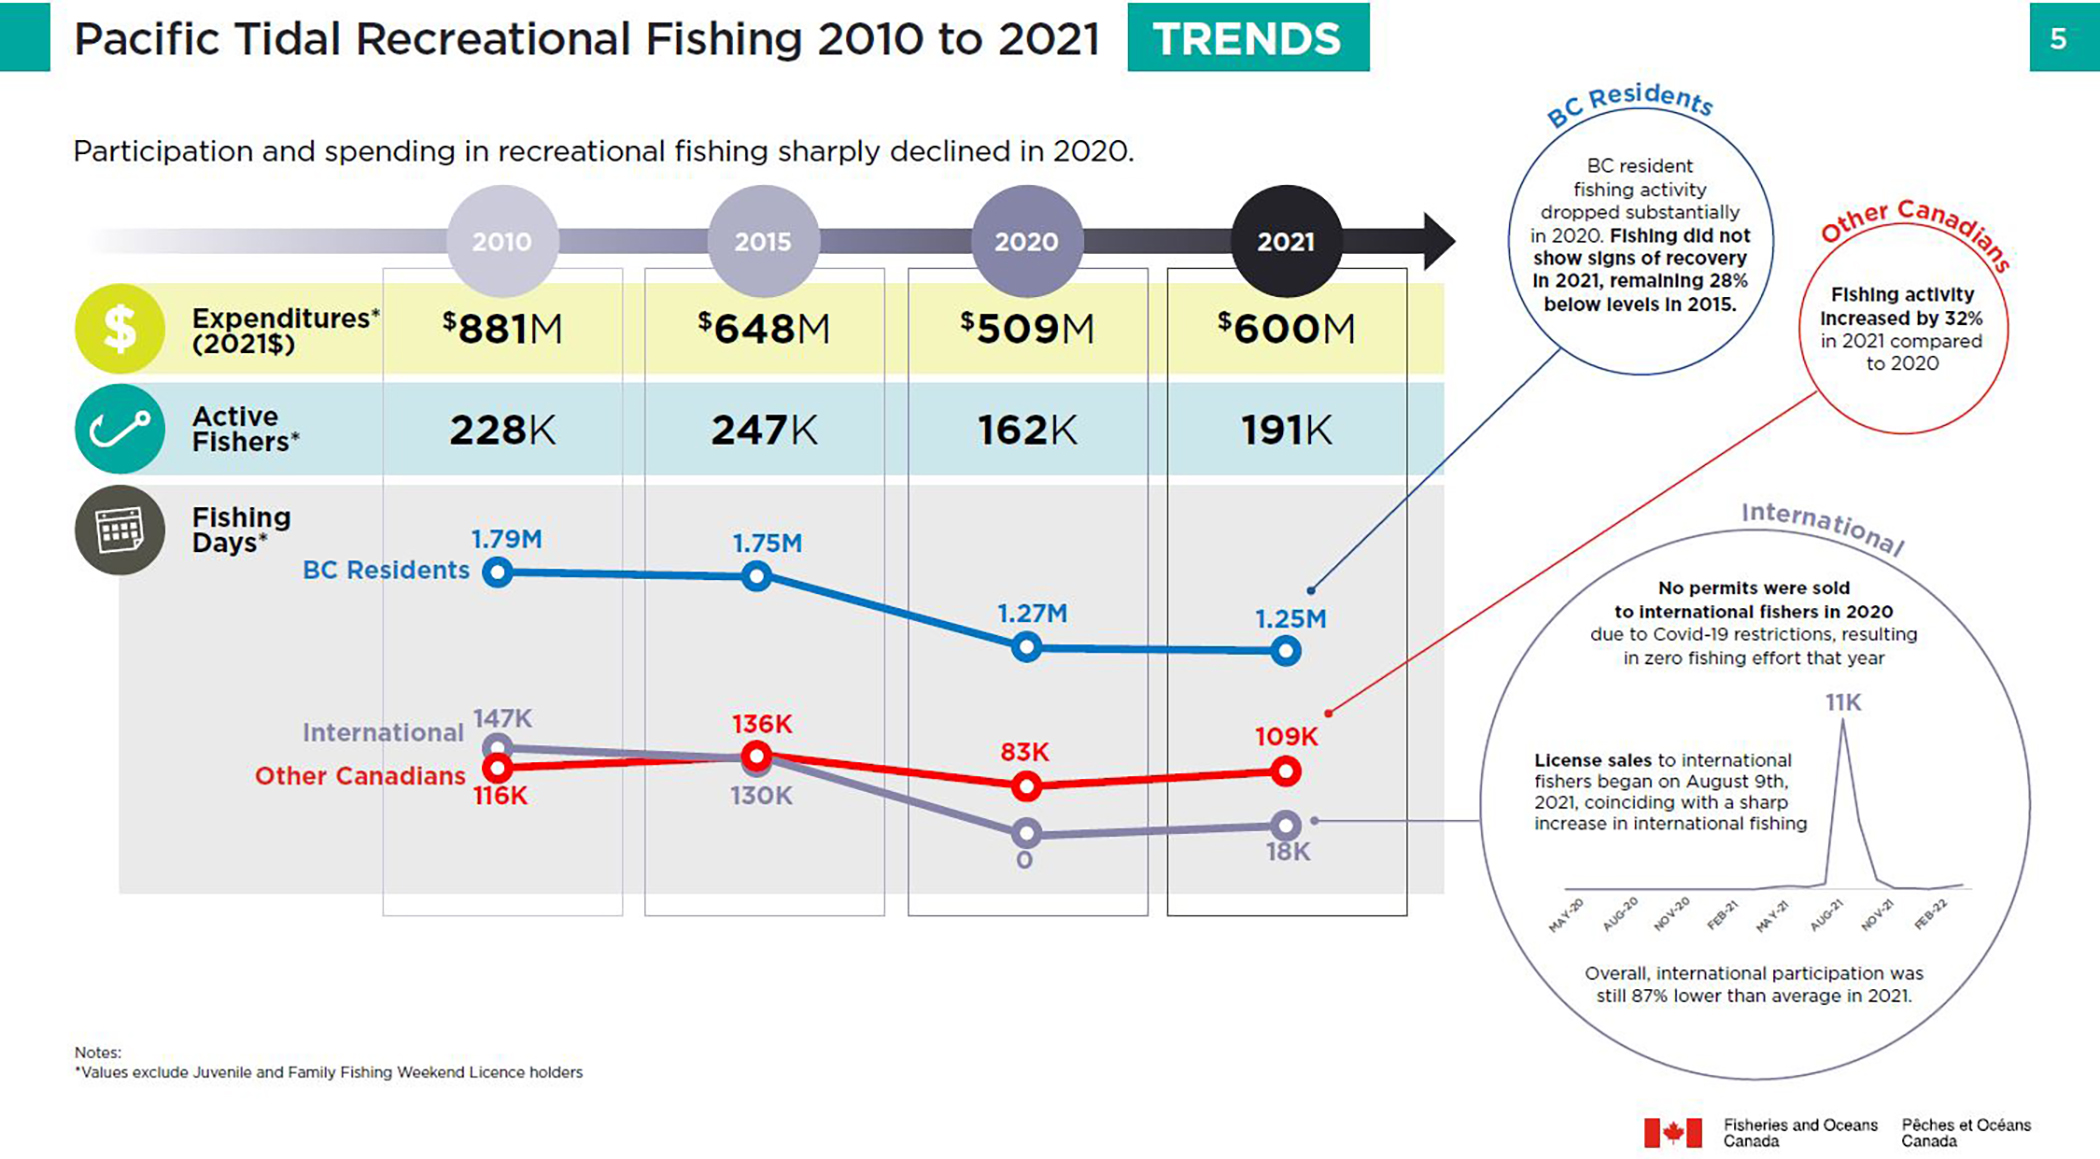
Pacific tidal recreational fishing 2010 to 2021, trends
Long text version
Pacific tidal recreational fishing 2010 to 2021, trends
Participation and spending sharply declined in 2020. The following are trends since 2010. Dollar amounts are in 2021 dollars.
Expenditures
- 2010 ($881M)
- 2015 ($648M)
- 2020 ($509M)
- 2021 ($600M)
Active fishers
- 2010 (228K)
- 2015 (247K)
- 2020 (162K)
- 2021 (191K)
Fishing days by residency
BC residents
- 2010 (1.79M)
- 2015 (1.75M)
- 2020 (1.27M)
- 2021 (1.25M)
- BC resident fishing activity dropped substantially in 2020. Fishing did not show signs of recovery in 2021, remaining 28% below levels in 2015
Other Canadians
- 2010 (116K)
- 2015 (136K)
- 2020 (83K)
- 2021 (109K)
- Fishing activity increased by 32% in 2021 compared to 2020.
International
- 2010 (147K)
- 2015 (130K)
- 2020 (0)
- 2021 (18K)
- No permits were sold to international fishers in 2020 due to COVID-19 restrictions, resulting in zero fishing effort that year. License sales to international fishers began on August 9th, 2021, coinciding with a sharp increase in international fishing. Overall, international participation was still 87% lower than average in 2021
Pacific tidal recreational fishing 2021, COVID-19

Long text version
Pacific tidal recreational fishing 2021, COVID-19
- In 2020, travel restrictions related to COVID-19 resulted in decreased participation from fishers of all origins.
- Participation among visitors increased substantially in 2021, following the lifting of travel restrictions related to COVID-19. However, overall participation remained low compared to pre-2020 levels.
- Spending on guide services, lodge and charter packages increased from $40M in 2020 to $115M in 2021. However, spending was 13% below pre-2020 levels. Note that dollar values reported are in 2021$. Per day expenditures have continued to increase throughout the pandemic.
The following is a residency breakdown of changes in fishing activity and expenditures in 2021 compared to the period prior to and immediately following the onset of COVID-19 related restrictions.
Percent change in fishing expenditures and activity in 2021 compared to pre-COVID (prior to April 2020). Note that expenditures compares 2021 levels to 2015 levels while other metrics compare 2021 levels to 2019 levels:
BC residents:
- Per day fishing expenditures: 41% increase
- Active fishers: 2% decrease
- Fishing days by trip type:
- Shore based: 27% decrease
- Private boat without a guide: 24% decrease
- Private boat with a guide: 24% increase
- Charter boat: 42% decrease
Visitors (includes other Canadian and international fishers):
- Per day fishing expenditures: 47% increase
- Active fishers: 53% decrease
- Fishing days by trip type:
- Shore based: 31% decrease
- Private boat without a guide: 76% decrease
- Private boat with a guide: 67% decrease
- Charter boat: 60% decrease
Percent change in fishing expenditures and activity in 2021 compared to the period following the initial COVID-19 disruption (April 2020 to March 2021). Note that all metrics compare 2021 levels to levels reported for the 2020 fishing season.
BC residents
- Per day fishing expenditures: 10% increase
- Active fishers: 8% increase
- Fishing days by trip type:
- Shore based: 11% decrease
- Private boat without a guide: 3% decrease
- Private boat with a guide: 2% decrease
- Charter boat: 13% increase
Visitors (includes other Canadian and international fishers):
- Per day fishing expenditures: 24% increase
- Active fishers: 86% increase
- Fishing days by trip type:
- Shore based: 60% increase
- Private boat without a guide: 33% increase
- Private boat with a guide: 20% increase
- Charter boat: 127% increase
Per day fishing expenditures break down by expenditure type and residency:
Residents:
- Direct expenditures: $151 per day
- Fishing packages: $31 per day
- Major purchases: $169 per day
Visitors (includes Other Canadian and International Fishers):
- Direct expenditures: $390 per day
- Fishing packages: $253 per day
- Major purchases: $115 per day
On average, BC residents spend less than visitors per fishing day on direct expenses and packages but more on major purchases.
Pacific tidal fishing expenditure trends

Long text version
Pacific tidal fishing expenditure trends
Total fishing expenditures increased by 18% from 2020 to 2021
- Per day direct fishing expenditures have shown an increasing trend since 2015
- Total package expenditures increased by 238% from 2020 to 2021
- 51% of package expenditures were purchased by visitors to BC in 2021
Per day fishing expenditures trends, 2010 to 2021
Direct expenditures
- 2010 $158 per day
- 2015 $148 per day
- 2020 $179 per day
- 2021 $211 per day
Fishing packages
- 2010 $65 per day
- 2015 $59 per day
- 2020 $22 per day
- 2021 $73 per day
Major purchases
- 2010 $206 per day
- 2015 $114 per day
- 2020 $175 per day
- 2021 $151 per day
Per day direct spending increased for all direct expenditure items from 2020 to 2021.
Below is a break-down of percent change in direct expenditures from 2020 to 2021 for each expenditure item:
- Fishing rentals (boats, gear, etc.): 87% increase
- Guide services: 54 % increase
- Accommodations and camping (hotels, cottages, camp site fees, etc.): 48% increase
- Vehicle expenses (gas, repairs, tolls, rental fees, etc.): 35% increase
- Other transportation (ferry, airfare, etc.): 34% increase
- Food (groceries, restaurants, etc.): 12% increase
- Personal boat expenses (gas, insurance, launch fees, etc.): 9% increase
- Fishing supplies (lures, lines, tackle, bait, etc.): 7% increase
- Other fishing related fees (licensing, park access, etc.): 22% increase
Pacific tidal fishing expenditures, 2021

Long text version
Pacific tidal fishing expenditures, 2021
Expenditures by trip type
Shore-based:
- $100 direct expenditures per fishing day
- $14 package expenditures per fishing day
- $36 major purchases per fishing day
- $117M annual expenditures
Private boat no guide:
- $186 direct expenditures per fishing day
- $19 package expenditures per fishing day
- $174 major purchases per fishing day
- $363M annual expenditures
Private boat with guide:
- $336 direct expenditures per fishing day
- $267 package expenditures per fishing day
- $209 major purchases per fishing day
- $84M annual expenditures
Hired boat with guide / charter:
- $458 direct expenditures per fishing day
- $447 package expenditures per fishing day
- $85 Major Purchases per fishing day
- $27M annual expenditures
Charter trips had the highest direct daily expenditures but the lowest annual fishing expenditures.
Expenditures by trip type and species
Shore-based:
- Salmon $12M (43%)
- Shellfish $9M (32%)
- Groundfish $6M (21%)
- Other species $1M (5%)
Private boat no guide:
- Salmon $209M (58%)
- Shellfish $76M (21%)
- Groundfish $74M (20%)
- Other species $2M (1%)
Private boat with guide:
- Salmon $53M (63%)
- Shellfish $22M (27%)
- Groundfish $7M (9%)
- Other species $1M (1%)
Private boat with guide / charter:
- Salmon $70M (60%)
- Shellfish $38M (32%)
- Groundfish $6M (5%)
- Other species $4M (3%)
Salmon are the primary target across all trip types.
Groundfish and other finfish are targeted more frequently on guided trips.
Shellfish are targeted more on self-guided trips.
Pacific tidal fishing package deals, 2021
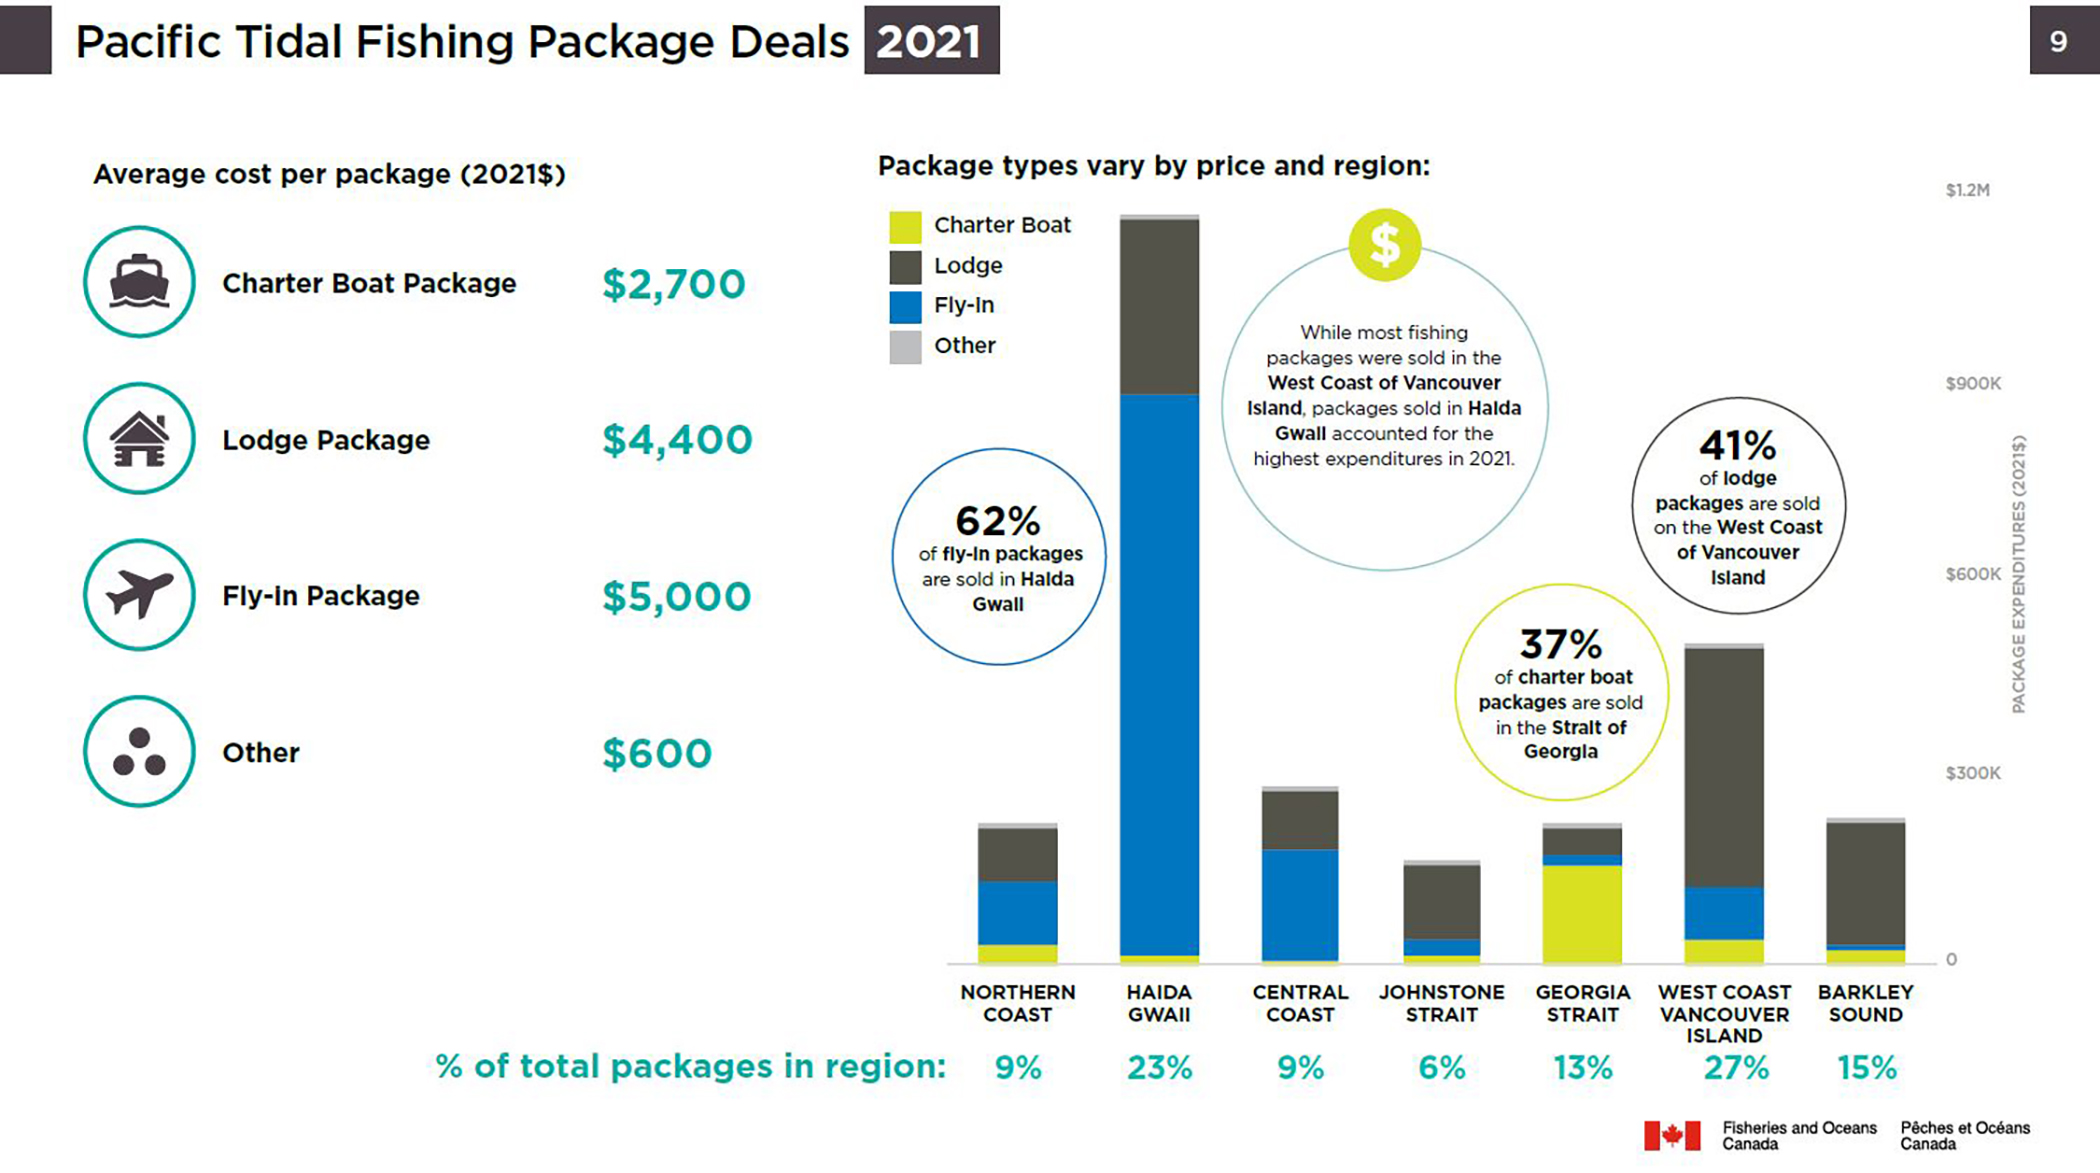
Long text version
Pacific tidal fishing package deals, 2021
Average cost per package (2021 $)
- Charter boat package: $2,700
- Lodge package: $4,400
- Fly-in package: $5,000
- Other: $600
Package expenditures by package type and region
Northern Coast:
- Charter boat package: $30K
- Lodge package: $83K
- Fly-in package: $102K
- Other: $3K
- 9% of total packages in region
Haida Gwaii:
- Charter boat package: $17K
- Lodge package: $272K
- Fly-in package: $872K
- Other: $0
- 23% of total packages in region
Central Coast:
- Charter boat package: $11K
- Lodge package: $91K
- Fly-in package: $165K
- Other: $0
- 9% of total packages in region
Johnstone Strait:
- Charter boat package: $17K
- Lodge package: $117K
- Fly-in package: $23K
- Other: $ 1K
- 6% of total packages in region
Strait of Georgia:
- Charter boat package: $153K
- Lodge package: $44K
- Fly-in package: $15K
- Other: $ 6K
- 13% of total packages in region
West Coast of Vancouver Island:
- Charter boat package: $38K
- Lodge package: $375K
- Fly-in package: $82K
- Other: $ 2K
- 27% of total packages in region
Barkley Sound:
- Charter boat package: $24K
- Lodge package: $190K
- Fly-in package: $8K
- Other: $ 1K
- 15% of total packages in region
Package types vary by price and region:
- 62% of fly in packages are sold in Haida Gwaii
- 37% of charter boat packages are sold in the Strait of Georgia
- 41% of lodge packages are sold on the West Coast of Vancouver Island
- While most fishing packages were sold on the West Coast of Vancouver Island, Packages sold in Haida Gwaii accounted for the highest expenditures in 2021.
Notes and methodology
Concepts, terms and definitions
- Active fisher:
- an individual who fished in the corresponding fishing season.
- Fishing day:
- a day or part of a day on which an individual fished for recreation.
- Direct expenditures:
- expenditures on goods and services (food, camping, accommodation, transportation, supplies, etc.) incurred during fishing trips or excursions.
- Major purchases:
- the purchase of durable goods and investments in support of recreational fishing activities. These include boats, motors, special vehicles, camping gear and other durable goods, as well as land and building purchases. Respondents reported the total purchase price as well as the percentage which the respondent felt was directly attributable to recreational fishing. In this report, only purchases attributable to recreational fishing are presented.
- Package expenditures:
- monies paid to a lodge or outfitter for a complete range of services such as lodging, food, transportation, use of fishing equipment, etc. Four types of packages were defined for the purposes of this survey:
- Charter boat package: a package which includes fishing in a boat and may include other goods or services such as a guide, food, or fishing supplies, but excludes accommodation and airfare.
- Lodge package: a package which includes accommodation and may include other goods or services such as a guided charter, food, or fishing supplies, but excludes airfare.
- Fly-in package: a package which includes airfare and may include other goods or services such as accommodations, a guided charter, food, or fishing supplies.
- Other: a package which does not include fishing in a boat, accommodations, or airfare, but may include other goods or services such as a guide, food, or fishing supplies.
- Percent change:
- calculated as 𝑟 = ((𝑝𝑛 − 𝑝0)/𝑝0) ∗ 100 where 𝑟 is average annual percent change, 𝑝𝑛 and 𝑝0 are the final and initial observations in the period, respectively.
- Recreational fishing:
- refers to non-commercial fishing; recreational angling and sport fishing are covered in the definition used by the survey. Note that food, social and ceremonial fishing is not covered by the survey and is therefore, not included in any of the estimates presented in this report.
- Residency:
- The place in which the license holder permanently resided within the survey year.
- BC resident:
- An individual who lived within British Columbia during the survey year.
- Other canadian:
- An individual who lived within Canada, but outside British Columbia during the survey year.
- International fisher:
- An individual who lived outside of Canada during the survey year.
- Visitor:
- An individual who’s primary residence is outside of BC (includes Other Canadian and International fishers).
- Trip Type:
- Respondents distributed their days fished across four types of fishing days. This considers all fishing days and is separate from package types which are specific to package expenditures.
Data description
The primary data source used for this report was the Internet Socioeconomic Analysis (iSEA) Survey of Tidal Water Recreational Fishing in British Columbia, 2021. This survey was administered by DFO Pacific and collected socioeconomic information on tidal water recreational fishing activity in British Columbia (BC) throughout the 2021 fishing season (from April 2021-March 2022). The survey questions were organized into two sections – fishing effort (days), and fishing expenditures. A random sample of 20,000 individuals, who purchased a tidal water fishing licence in the 2021 season, were selected to complete the survey. In total, 5,707 individuals completed the survey in full, resulting in an effective sample rate of 2.1%.
This survey was similarly administered in the 2019 and 2020 fishing seasons. The data from these previous iterations were also used in generating some of the statistics presented in this report. While the focus was consistent throughout the three iterations, the 2019 survey did not include questions related to expenditures. The sampling approach in 2019 and 2020 was consistent to that of 2021. The 2019 and 2020 surveys achieved effective sample rates of 1.5% and 2.7%, respectively.
In addition to the iSEA surveys, the figures presented in this report were supplemented using data from the Survey of Recreational Fishing in Canada. This survey was historically run by DFO every 5-years up until 2015, and collected socioeconomic information on all fishing activity (tidal and freshwater) across Canada. In contrast to iSEA, this survey was run based on the calendar year rather than the fishing season. Information from the 2000, 2005, 2010, and 2015 iterations were used for generating reported recreational fishing statistics for BC prior to 2019. More information on this survey is available from DFO’s national website.
Note that survey results presented in this report have been weighted in order to scale results to the licence population level. Additionally, many survey results presented in this report are transformed data. Fields such as fishing days and expenditures were calculated by distributing reported values across species, spatial and trip categories.
Additional notes on methodology
Unless otherwise specified, all dollar metrics presented in this report are in 2021$.
Throughout this report, Fishing Expenditures refers to the sum of Direct Expenditures, Major Purchases, and Package Expenditures reported in the corresponding survey year.
On page 1 of this report GDP, Household Income, and Jobs statistics were calculated using multipliers from British Columbia’s Fisheries and Aquaculture Sector Report, developed by BC Stats. This report is available from the government of British Columbia’s website.
On Page 6 of this report, “Pre-COVID” reflects the percent change from 2019-2021 for Active Fishers and Fishing Days, from 2015-2021 for Per Day Expenditures. This is because no data on expenditures were available for 2019.
- Date modified: