
2024 survey of British Columbia coastal residents’ perspectives on ocean contributions to well-being - Public opinion research summary
On this page
- Project objectives
- Research specifications
- Survey instrument design
- Engagement in marine and ocean activities
- B.C. coastal residents’ values of ocean resources
- B.C. coastal residents ocean dependence
- B.C. coastal residents ocean dependence by districts
- How the ocean supports B.C. coastal residents and their communities
- Knowledge on MPAs and on coastal/marine issues in general
- Support for MPAs in B.C.
- B.C. coastal residents views on how MPAs support ocean values
- Perceived MPA support for ocean values
- Linkages to network monitoring
Project objectives
- To identify the diverse values coastal residents of British Columbia have for the ocean.
- To examine B.C. coastal residents’ perceptions on Marine Protected Areas (MPAs) and on potential effects of the implementation of MPAs.
- To explore whether a public opinion survey is a feasible and effective option to collect social and cultural data to inform marine conservation processes.
Research specifications
- Data collection was conducted between March 26 and April 28, 2024.
- Target audience: B.C. coastal residents (15 coastal districts)
- Respondents were contacted by email and cell phone using a mix of professional panel and random digit dialing to increase the sample in remote areas.
- 1,701 surveys were completed. The associated margin of error for the sample is up ±2.5%.
- Oversamples were collected in rural coastal districts to improve data richness in less-populated regions, and weighting was applied using census estimates.
- Survey instrument was designed in house, with UVic providing input on how human well-being framework is applied in the questions and overall survey design.
- Survey implemented by contractor (EKOS)
- Data analysis and report prepared by Fisheries and Oceans Canada (DFO)
*A full report on the methodology is available on Library and Archives Canada. Survey of British Columbia coastal residents and their values of ocean resources methodological report
Survey instrument design
Long text version
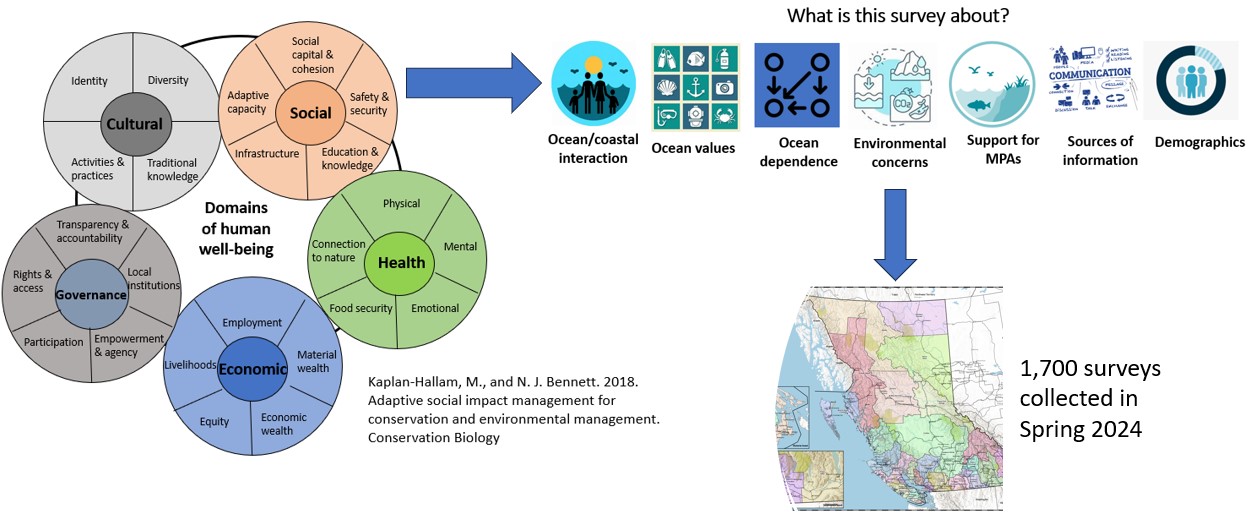
Survey instrument design
The instrument design was developed based on the human wellbeing framework proposed by Kaplan-Hallan and Bennett in 2018 which incorporates the cultural, social, health, governance, and economic domains of human wellbeing.
The survey included questions about B.C. coastal residents ocean and costal interactions, about ocean values, ocean dependency, environmental concerns, support for MPAs, what sources of information people use, and demographic characteristics.
The survey was conducted in Spring 2024. The sample included 1,700 surveys with representation from all the coastal districts of B.C.
Engagement in marine and ocean activities
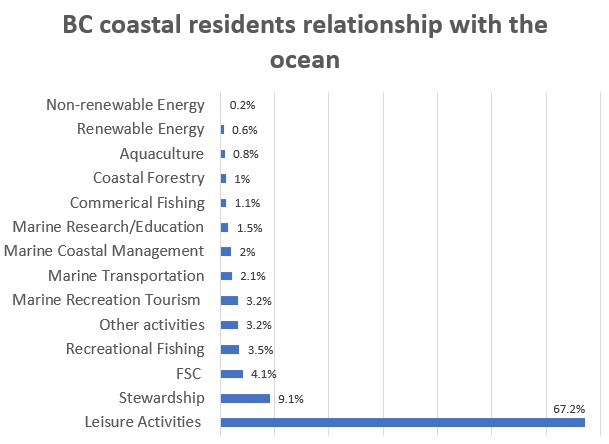
B.C. coastal residents interact in different ways with the ocean and coastal areas.
- B.C. coastal residents responding to this survey have lived in the coastal zone an average of 34 years.
- Over 67% of B.C. coastal residents regularly participate in coastal-marine related leisure activities
- About 16% of the B.C. coastal residents work in ocean-related jobs with the recreational fishing sector and marine recreation and tourism being the highest represented categories
- Commercial fishing, recreational fishing, aquaculture, and ocean transportation among other sectors were also identified by participants, but in smaller numbers.
Long text version
B.C. coastal residents relationship with the ocean
| Sector/Activity | Percentage |
|---|---|
| Non-renewable energy | 0.2% |
| Renewable energy | 0.6% |
| Aquaculture | 0.8% |
| Coastal forestry | 1% |
| Commercial fishing | 1.1% |
| Marine research/education | 1.5% |
| Marine coastal management | 2% |
| Marine transportation | 2.1% |
| Marine recreation tourism | 3.2% |
| Other activities | 3.2% |
| Recreational fishing | 3.5% |
| FSC | 4.1% |
| Stewardship | 9.1% |
| Leisure activities | 67.2% |
B.C. coastal residents’ values of ocean resources
Social, cultural, and environmental values are identified as important more often than economic or instrumental ones.

Long text version
Importance of ocean values for B.C. coastal residents
The main values selected by participants are presented in the table below.
| Ocean values | Percentage |
|---|---|
| Scenery/sensory enjoyment | 84% |
| Healthy marine ecosystems | 78% |
| Outdoor recreation | 62% |
| Natural and human history | 55% |
| A place to learn/teach | 52% |
| Food/products to sustain life | 42% |
| Socialization opportunities | 39% |
| Ocean-based transportation | 34% |
| Sacred areas | 22% |
| Income/Employment | 16% |
| Passing down knowledge/traditions | 10% |
B.C. coastal residents ocean dependence
- High dependence on the ocean for mental and physical health, recreation and social purposes, and for buying seafood locally.
- B.C. coastal residents less frequently reported ocean dependence for cultural purposes, employment/livelihood, and direct food harvesting.
- Males and females have broadly similar levels of dependence on the ocean.
- Males rely on the ocean for their employment and livelihoods more often than females.
- Females report higher reliance (59%) on the ocean for mental and physical health than males (45%).

Long text version
B.C. coastal residents high ocean dependence
Survey respondents indicated the level of dependance on the ocean for the following: employment, seafood harvesting, buying seafood, recreation, social purposes, cultural purposes, and health.
| Ocean dependence | Percentage |
|---|---|
| Employment/livelihood/family business | 9% |
| Directly harvesting Seafood | 7% |
| Seafood bought locally/other retail | 41% |
| Recreation | 44% |
| Social purposes | 41% |
| cultural purposes | 10% |
| Health | 52% |
B.C. coastal residents ocean dependence by districts
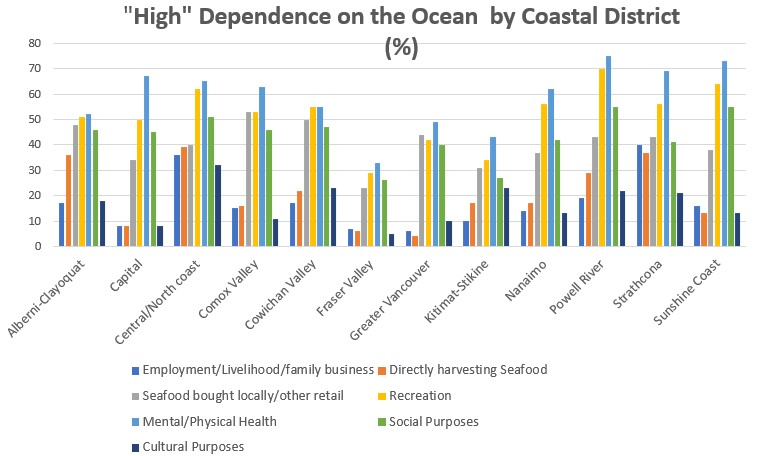
- The Central and North Coast (Haida Gwaii is grouped with Central and North Coast); Alberni-Clayoquot, and; Strathcona are the regions with higher dependence on the ocean for direct harvesting of seafood and for supporting Employment/livelihoods activities
- Dependence on the ocean for the same activities in Capital, Fraser Valley (Squamish-Lillooet is grouped with Fraser Valley), and Greater Vancouver is the lowest among all the districts.
- Fraser Valley residents report the lowest dependence on ocean for most of the listed activities.
Long text version
"High" dependence on the ocean by coastal district (%)
Survey participants in each coastal districts provided responses about their level of dependance on the ocean.
| Coastal district | Employment/ livelihoods/ family business |
Directly harvesting seafood | Seafood bought locally/ other retail |
Recreation | Mental/ physical health |
Social purposes | Cultural purposes |
|---|---|---|---|---|---|---|---|
| Alberni- Clayoquot | 17% | 36% | 48% | 51% | 52% | 46% | 18% |
| Capital | 8% | 8% | 34% | 50% | 67% | 45% | 8% |
| Central/North Coast/Mount Waddington | 36% | 39% | 40% | 62% | 65% | 51% | 32% |
| Comox Valley | 15% | 16% | 53% | 53% | 63% | 46% | 11% |
| Cowichan Valley | 17% | 22% | 50% | 55% | 55% | 47% | 23% |
| Fraser Valley/Squamish Lillooet | 7% | 6% | 23% | 29% | 33% | 26% | 5% |
| Greater Vancouver | 6% | 4% | 44% | 42% | 49% | 40% | 10% |
| Kitimat- Stikine | 10% | 17% | 31% | 34% | 43% | 27% | 23% |
| Nanaimo | 14% | 17% | 37% | 56% | 62% | 42% | 13% |
| Powell River (qathet) | 19% | 29% | 43% | 70% | 75% | 55% | 22% |
| Strathcona | 40% | 37% | 43% | 56% | 69% | 41% | 21% |
| Sunshine Coast | 16% | 13% | 38% | 64% | 73% | 55% | 13% |
How the ocean supports B.C. coastal residents and their communities
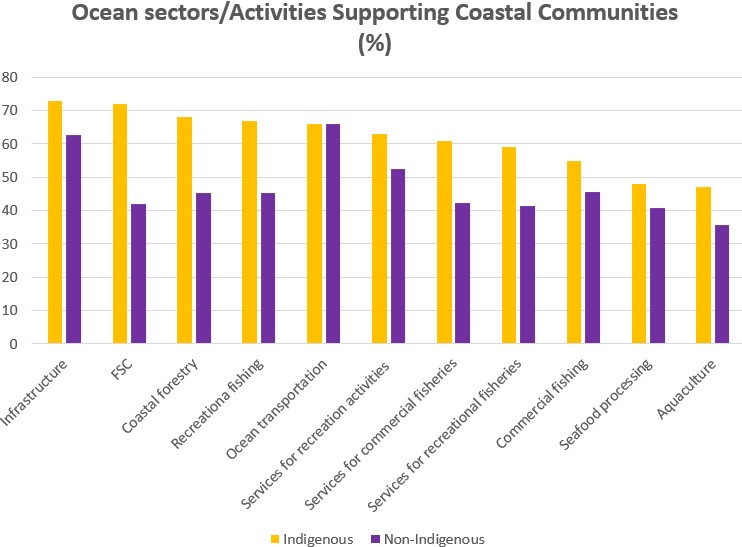
- Over 43% of B.C. coastal residents indicated most ocean sectors have high importance in supporting the communities where they live.
- Males and females provide very similar responses about how different sectors and ocean-related activities support coastal communities.
- Ocean-based transportation (66%), marine infrastructure (63%), and services for marine recreation (53%) were reported as the most important.
- Indigenous respondents were more likely to describe their communities as reliant on all ocean sectors. This is consistent with findings from the Indigenous Ocean Economy case study published in 2023 which found Indigenous people were twice as likely as non-Indigenous to be employed in marine-dependent economic sectors.
*This survey sampled B.C. coastal residents, which includes Indigenous individuals. This information is not the same as communities' input or Consultations.
Long text version
Ocean sectors/activities supporting coastal communities (%)
| Ocean sectors | Indigenous | Non-indigenous |
|---|---|---|
| Infrastructure | 73% | 63% |
| FSC | 72% | 43% |
| Coastal forestry | 68% | 46% |
| Recreational fishing | 67% | 46% |
| Ocean transportation | 66% | 66% |
| Services for recreation activities | 63% | 53% |
| Services for commercial fisheries | 61% | 43% |
| Services for recreational fisheries | 59% | 42% |
| Commercial fishing | 55% | 46% |
| Seafood processing | 48% | 41% |
| Aquaculture | 47% | 36% |
Knowledge on MPAs and on coastal/marine issues in general
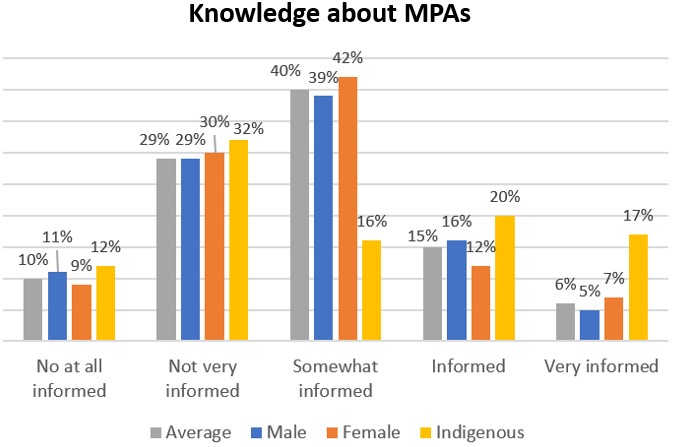
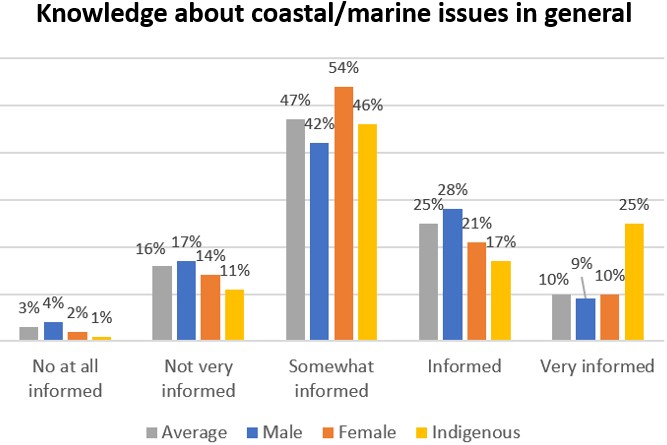
- Overall participants feel better informed about general ocean and coastal issues than about MPAs (35% informed or very informed, compared to 21% informed or very informed, respectively)
- Indigenous participants feel better inform about both aspects overall with 37% informed or very informed on MPAs and 42% on marine/coastal issues)
- When looking at the age breakdown, participants over 45 years feel better informed than younger participants
Long text version
Knowledge about Marine Protected Areas (MPAs)
Survey respondents indicated their knowledge about MPAs. Results are broken down in three categories: average, male, female, and Indigenous respondents.
| Average | Male | Female | Indigenous | |
|---|---|---|---|---|
| Not at all informed | 10% | 11% | 9% | 12% |
| Not very informed | 29% | 29% | 30% | 32% |
| Somewhat informed | 40% | 39% | 42% | 16% |
| Informed | 15% | 16% | 12% | 20% |
| Very informed | 6% | 5% | 7% | 17% |
Long text version
Knowledge about coastal and marine issues
Survey respondents indicated their knowledge about coastal and marine issues in general. Results are broken down in three categories: average, male, female, and Indigenous respondents.
| Average | Male | Female | Indigenous | |
|---|---|---|---|---|
| Not at all informed | 3% | 4% | 2% | 1% |
| Not very informed | 16% | 17% | 14% | 11% |
| Somewhat informed | 47% | 42% | 54% | 46% |
| Informed | 25% | 28% | 21% | 17% |
| Very informed | 10% | 9% | 10% | 25% |
Support for MPAs in B.C.
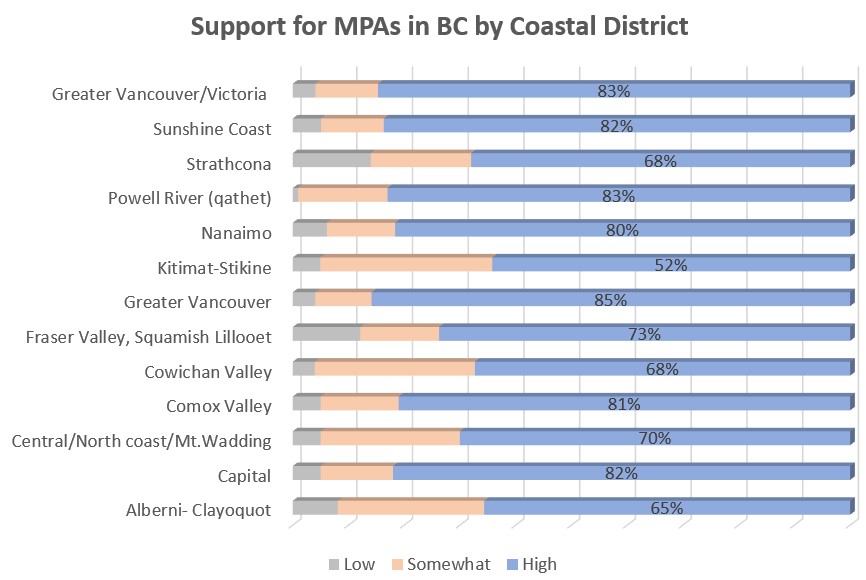
- About 82% of B.C. coastal residents support the creation of MPAs.
- Even in regions with the lowest support for MPAs, more than half of respondents expressed high support for MPAs. (e.g.: Kitimat-Stikine, Alberni-Clayoquat, Strathcona, Cowichan Valley)
- Note this question isn't specifically about support for any MPA in particular, or MPAs near the respondent's place of residence.
Long text version
Support for MPAs in B.C. by coastal district
Survey participants provided responses about their level of support for Marine Protected Areas in B.C. by coastal district.
| Coastal district | Low | Somewhat | High |
|---|---|---|---|
| Alberni-Clayoquot | 8% | 26% | 65% |
| Capital | 5% | 13% | 82% |
| Central/North coast/Mt. Waddington | 5% | 25% | 70% |
| Comox Valley | 5% | 14% | 81% |
| Cowichan Valley | 4% | 29% | 68% |
| Fraser Valley, Squamish Lillooet | 12% | 14% | 73% |
| Greater Vancouver | 4% | 10% | 85% |
| Kitimat-Stikine | 4% | 25% | 52% |
| Nanaimo | 6% | 12% | 80% |
| Powell River (qathet) | 1% | 16% | 83% |
| Strathcona | 14% | 18% | 68% |
| Sunshine Coast | 5% | 11% | 82% |
| Greater Vancouver/Victoria | 4% | 11% | 83% |
B.C. coastal residents views on how MPAs support ocean values
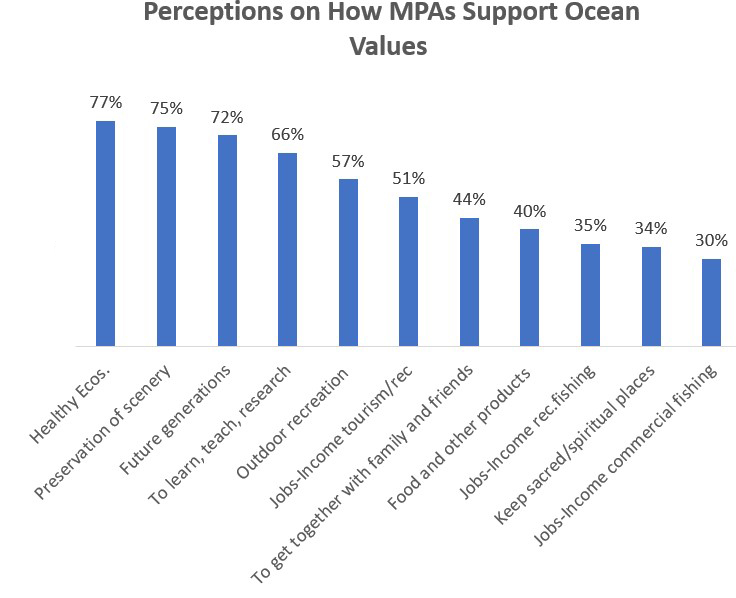
- Many participants indicated that most values listed in the survey are supported to a great extent by MPAs.
- MPA’s contribution to food and other products to sustain one’s life, opportunity to keep places sacred, religious, or spiritually special, and to spend time with family and friends were more likely raised by Indigenous respondents.
Long text version
Perceptions on how MPAs support ocean values
Respondents’ perceptions about how MPAs support ocean values.
| Ocean values supported by MPAs | Average |
|---|---|
| Healthy ecosystems | 77% |
| Preservation of scenery | 75% |
| Future generations | 72% |
| To learn, teach, research | 66% |
| Outdoor recreation | 57% |
| Jobs - income tourism/rec | 51% |
| To get together with family and friends | 44% |
| Food and other products | 40% |
| Jobs - income recreational fishing | 35% |
| Keep sacred/spiritual places | 34% |
| Jobs - income commercial fishing | 30% |
Perceived MPA support for ocean values
- The perceptions on how MPAs support ocean values often line up with the values most often identified as important by respondents.
- In other words, the survey data indicates that B.C. coastal residents believe that MPAs support the values that are important to them.

Long text version
Perceptions on how MPAs support ocean values
This table compares responses about perceptions on ocean values that are of high importance for respondents, and perceptions on how MPAs support those values.
| Ocean values | High importance ocean values | Ocean values supported by MPAs |
|---|---|---|
| Scenery/sensory enjoyment | 84% | 75% |
| Healthy marine ecosystems | 78% | 77% |
| Outdoor recreation | 62% | 57% |
| Natural and human history | 55% | - |
| A place to learn/teach | 52% | 66% |
| Food/products to sustain life | 42% | 40% |
| Socialization opportunities | 39% | 44% |
| *Ocean-based transportation | 34% | - |
| Sacred areas | 22% | 34% |
| Income/employment | 16% | 35% |
| *Passing down knowledge/traditions | 10% | - |
| *Future generations | - | 72% |
*Some values or MPA contributions to those values did not appear in both survey questions and so are not paired. This is not indicative of zero responses.
Linkages to network monitoring
- Provides reference point to assess how ocean values and support for MPAs may change through time.
- Informs design of monitoring programs to understand conservation outcomes, and adaptive management.
- Shows B.C. coastal residents' perceptions of the role of MPAs in supporting social, environmental, and aesthetic benefits, and economic ones (i.e., commercial and recreational fishing).
- Complements the views from Rights-holders and stakeholders and informs key messaging/ awareness campaigns.
- Practical experience highlights some considerations in a survey-based approach to measuring non-economic indicators
- e.g.: controlling for externalities/exogenous variables; ensuring representative sample/limitations of surveys to capture this type of information depending on the audience; identifying common values across different user groups.
Page details
- Date modified: