
Salmonid enhancement program (SEP), economic overview and contributions
Long text version
Overview of hatcheries and spawning channels
Pacific salmon hatcheries key roles:
- Conserve vulnerable salmon stocks
- Provide salmon for harvest opportunities
- Support stock assessment programs
- Support communities
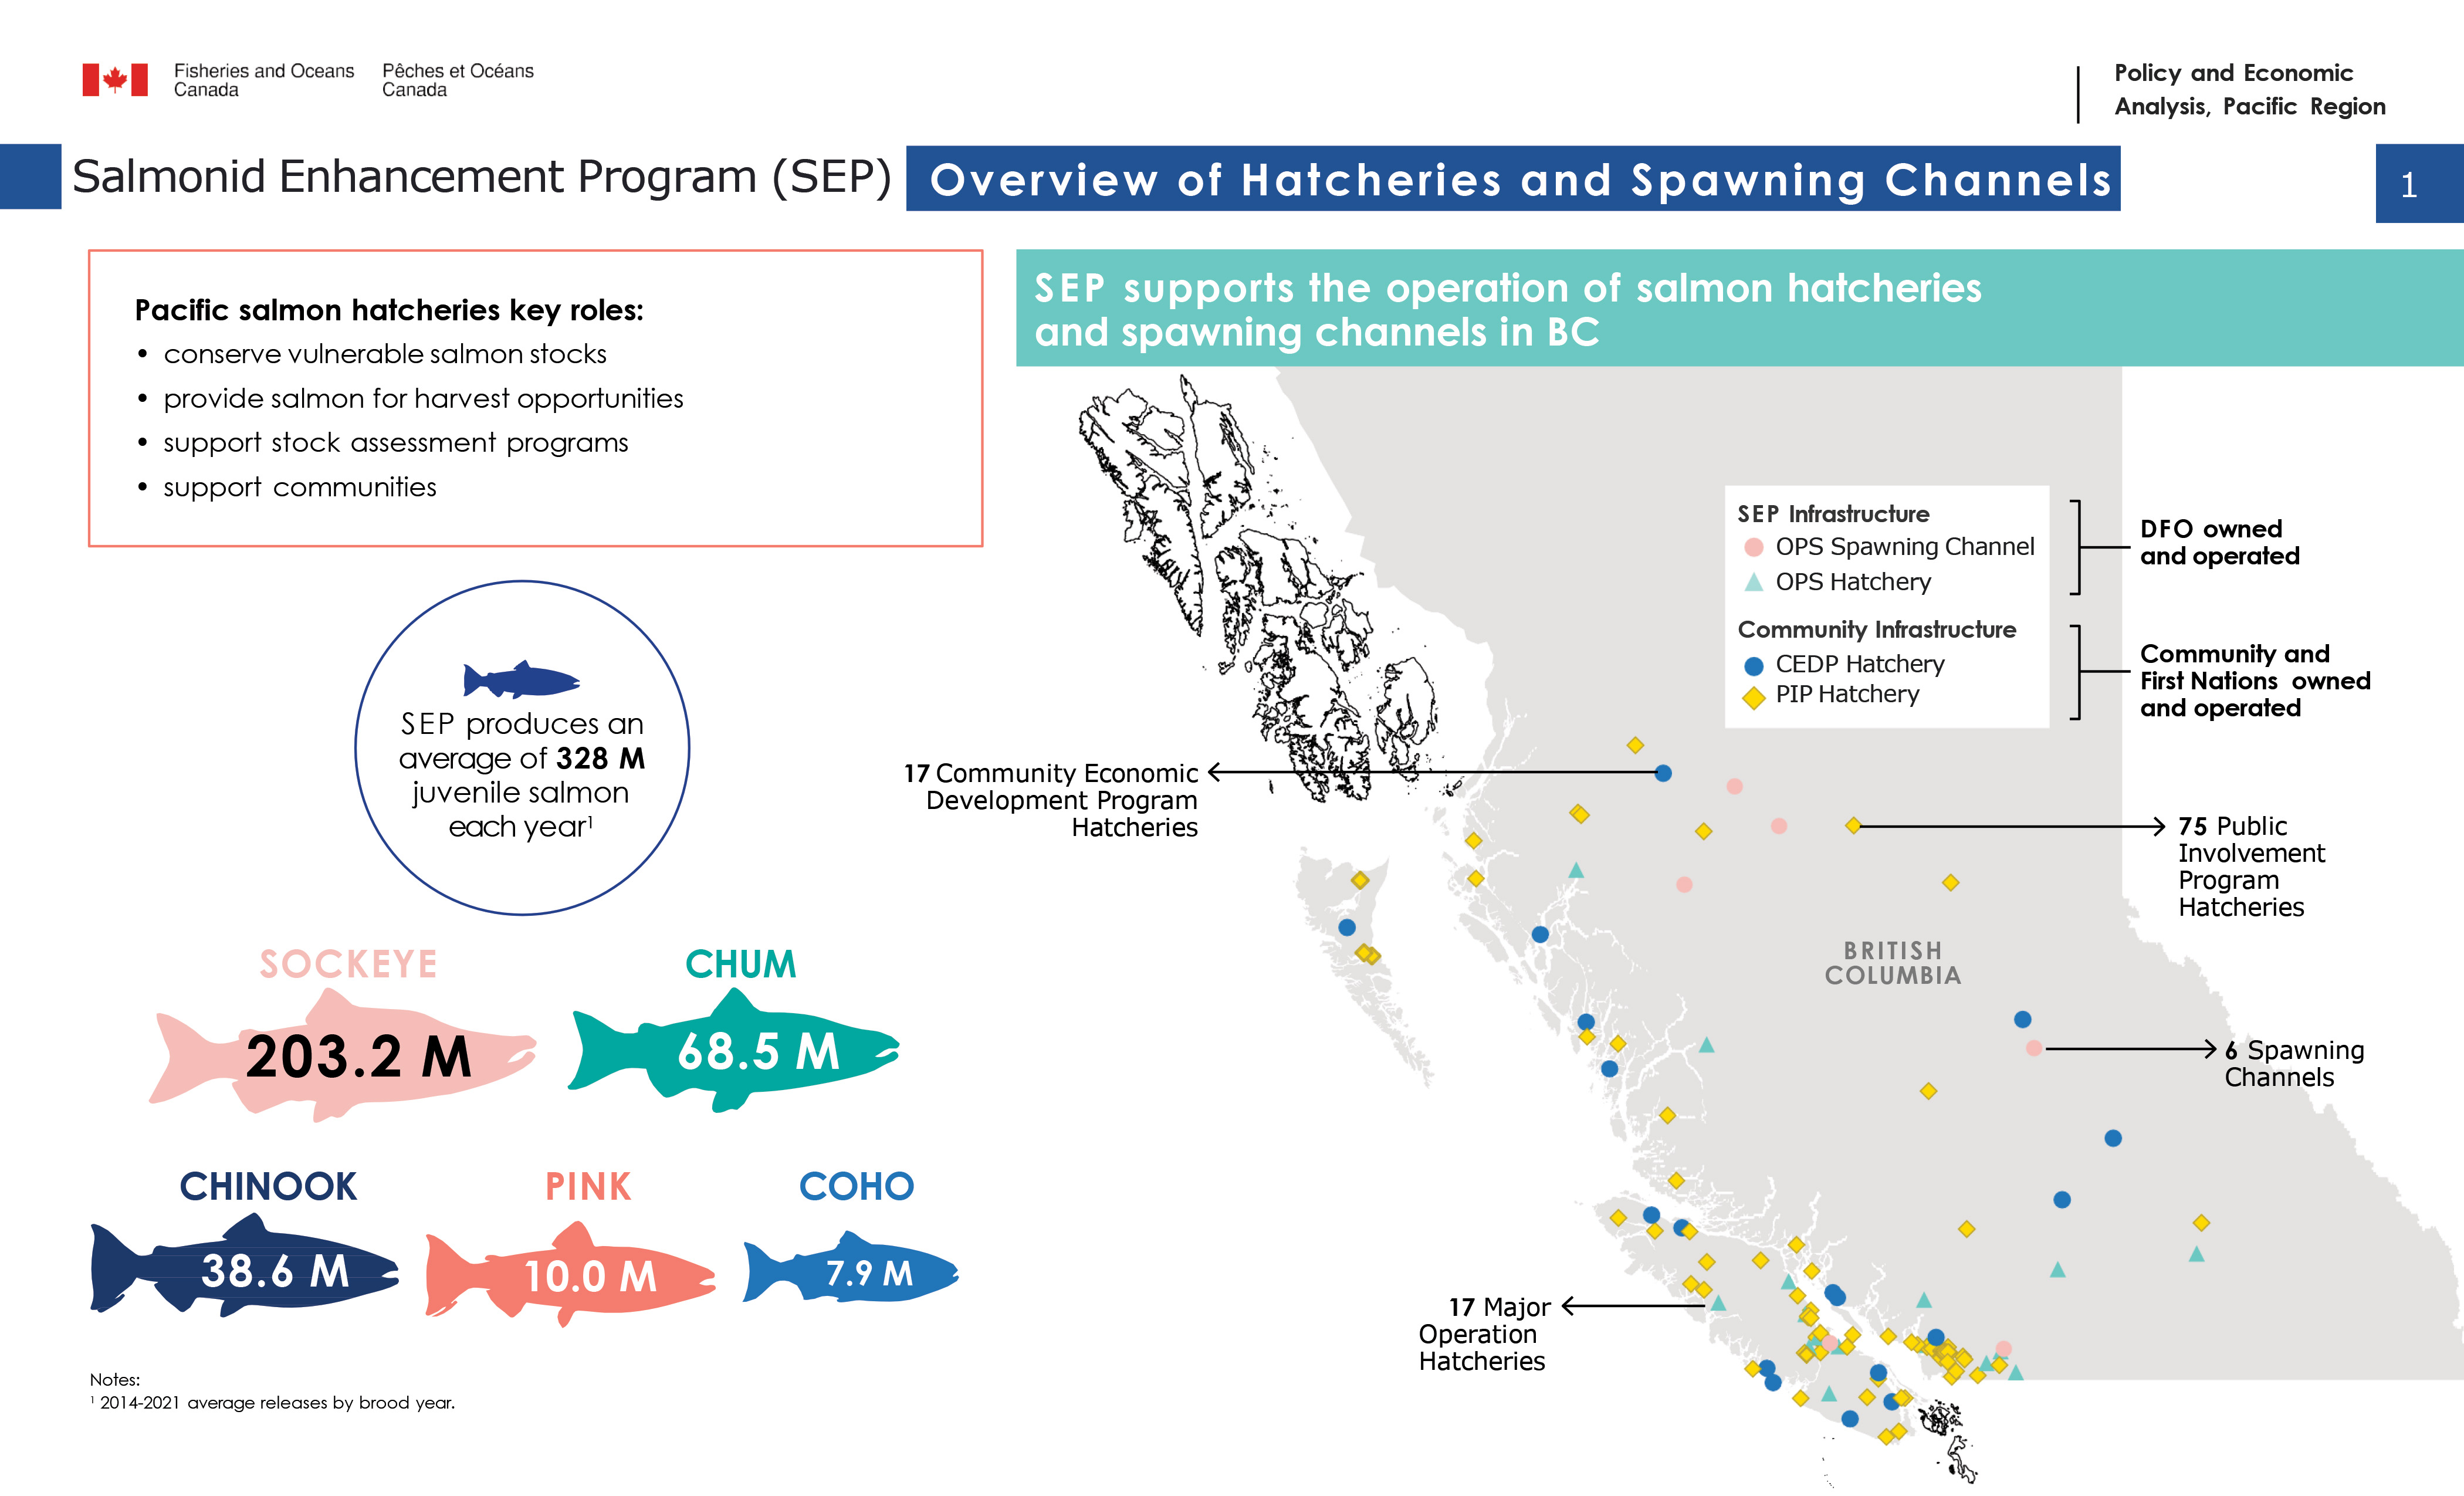
SEP supports the operation of salmon hatcheries and spawning channels in BC. The map shows locations of SEP infrastructure, which includes spawning channel and hatchery operations (OPS), and locations of community infrastructure, which includes Community Economic Development Program (CEDP) and Public Involvement Project (PIP) hatcheries. The SEP infrastructure is DFO owned and operated. The community infrastructure is community and First Nations owned and operated.
- 17 community economic development program hatcheries
- 75 public involvement program hatcheries
- 6 spawning channels
- 17 major operation hatcheries
SEP produces an average of 328M juvenile salmon each year1 between 2014-2021.
- Sockeye: 203.2M
- Chum: 68.5M
- Chinook: 38.6M
- Pink: 10.0M
- Coho: 7.9M
Notes:
12014-2021 average releases by brood year
Long text version
Salmonid enhancement program (SEP), economic overview
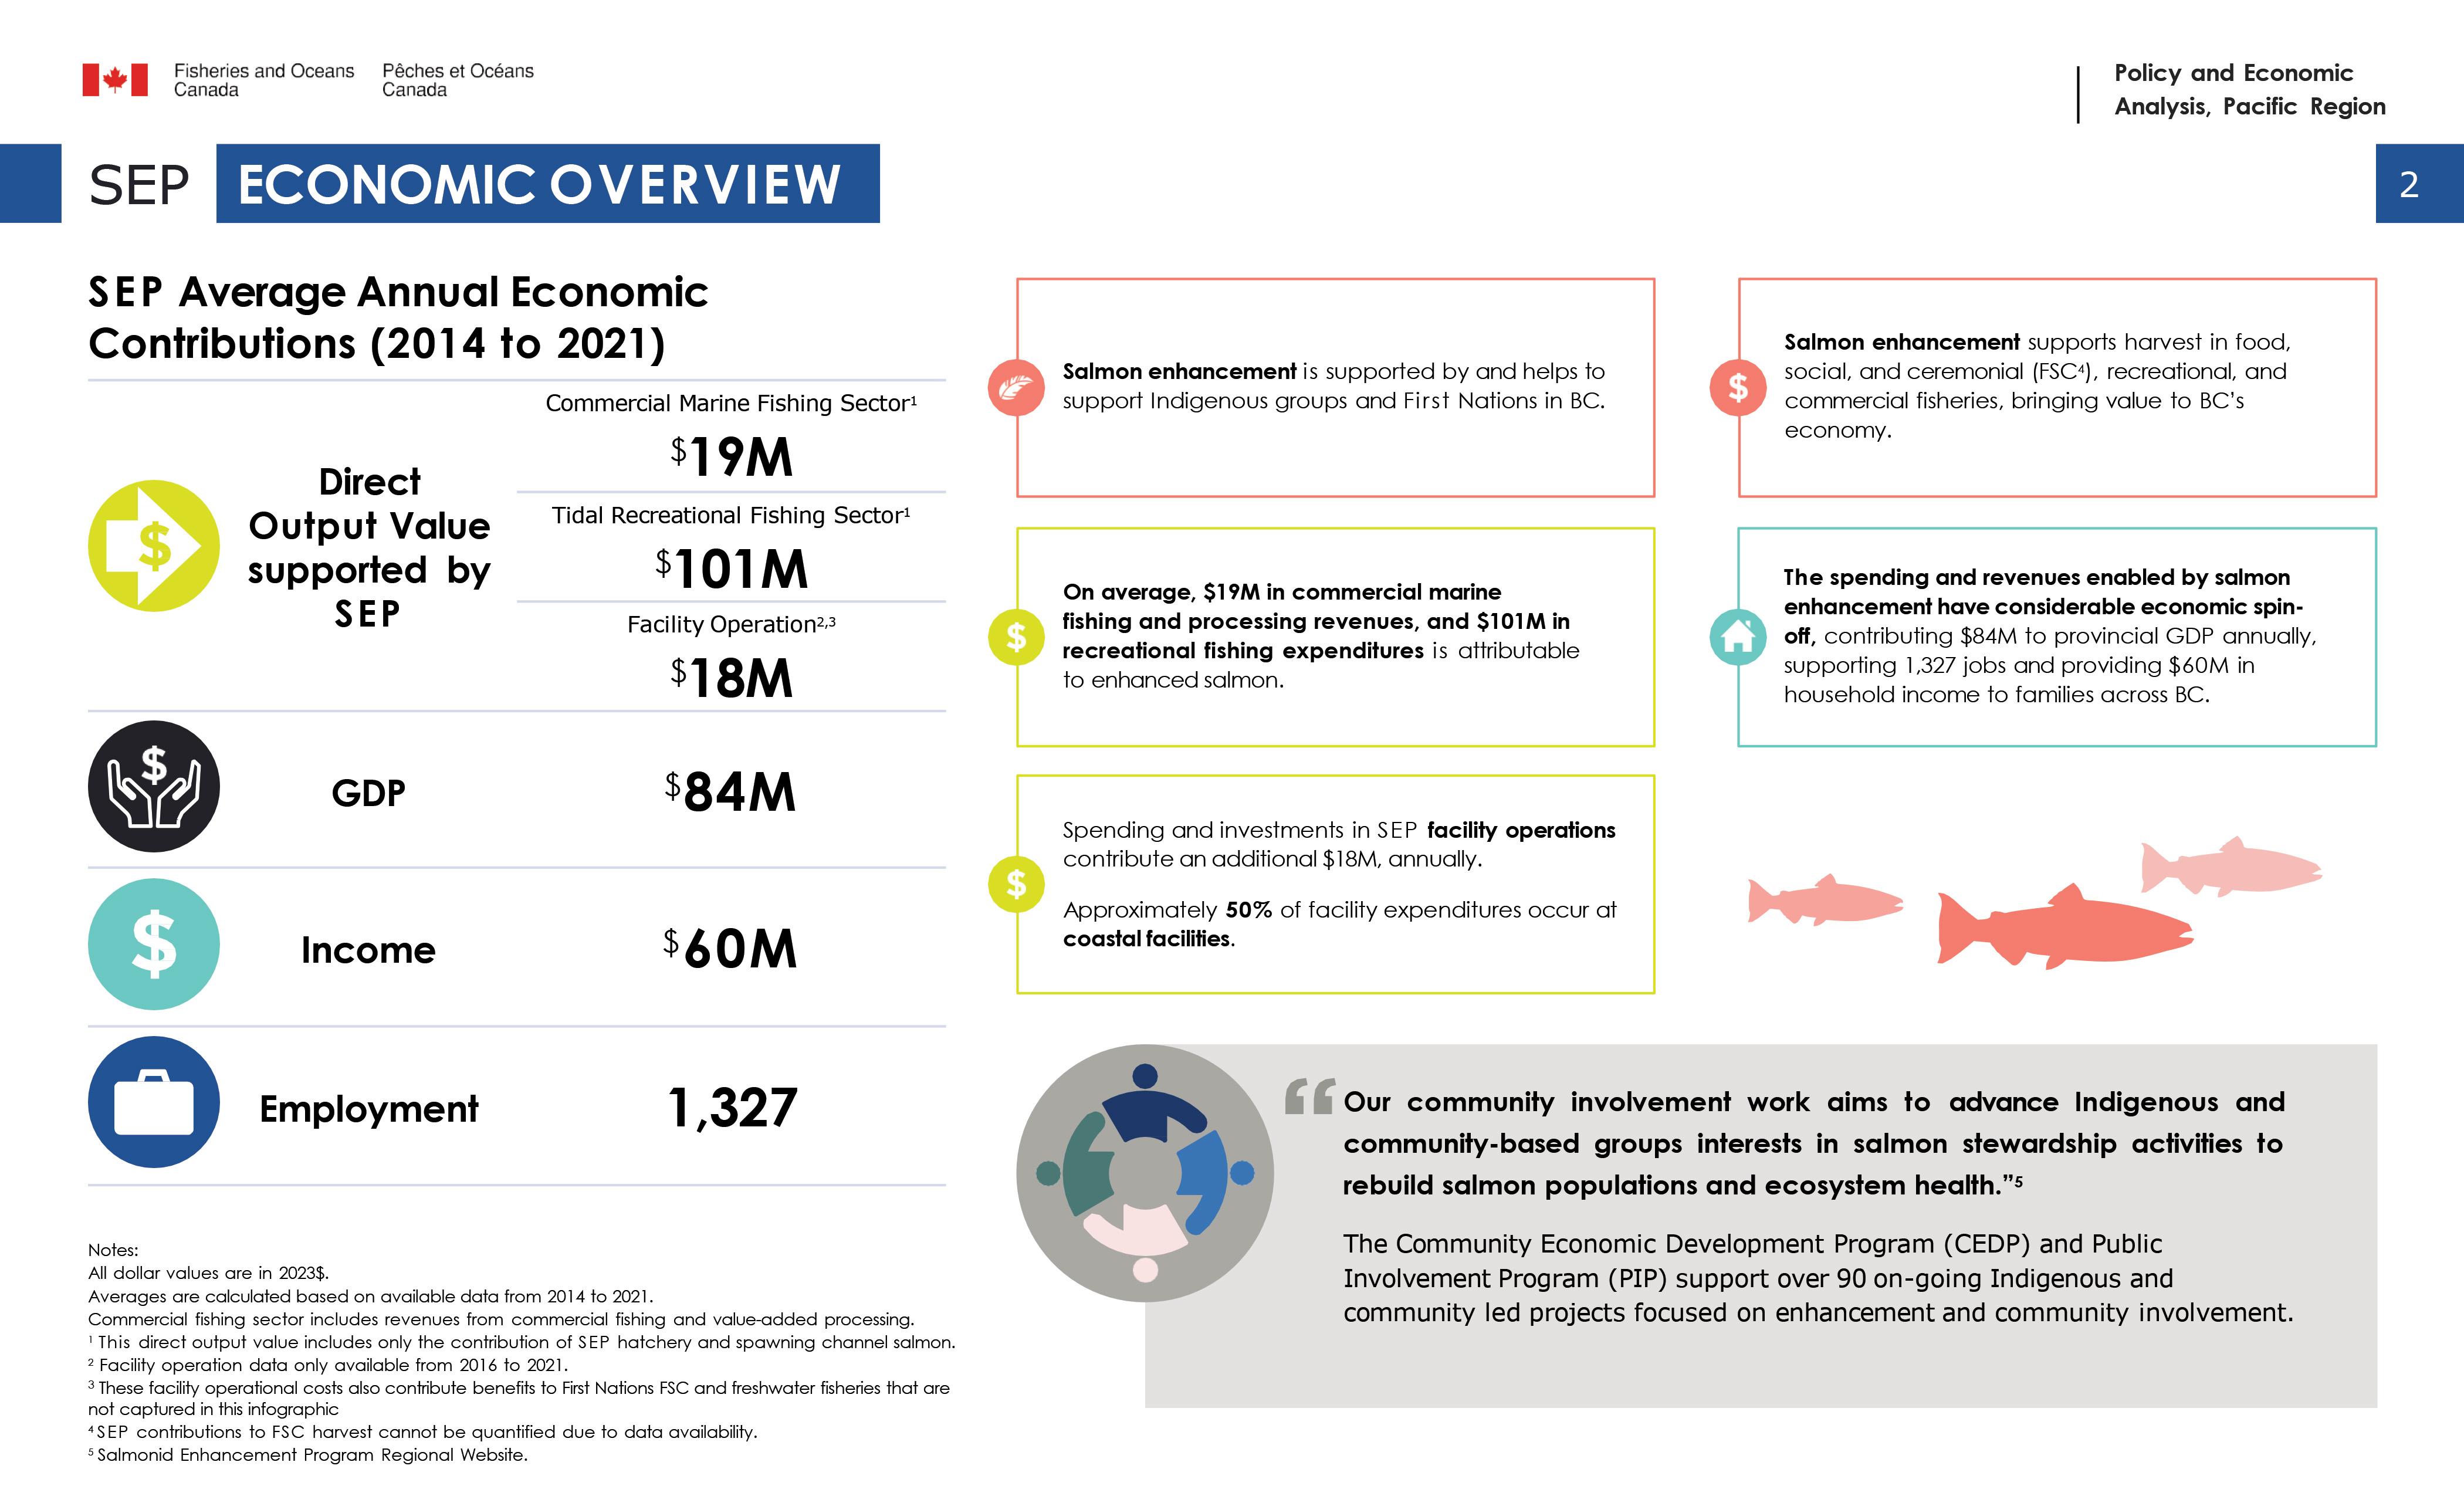
SEP average annual economic contributions (2014 to 2021)
- Direct Output Value supported by SEP
- Commercial Marine Fishing Sector: $19M1
- Tidal Recreational Fishing Sector: $101M1
- Facility Operation: $18M2,3
- GDP: $84M
- Income: $60M
- Employment: 1,327
Salmon enhancement is supported by and helps to support Indigenous groups and First Nations in BC.
On average, $19M in commercial marine fishing and processing revenues, and $101M in recreational fishing expenditures is attributable to enhanced salmon.
Spending and investments in SEP facility operations contribute an additional $18M, annually. Approximately 50% of facility expenditures occur at coastal facilities.
Salmon enhancement supports harvest in food, social, and ceremonial (FSC4), recreational, and commercial fisheries, bringing value to BC’s economy.
The spending and revenues enabled by salmon enhancement have considerable economic spin- off, contributing $84M to provincial GDP annually, supporting 1,327 jobs and providing $60M in household income to families across BC.
Our community involvement work aims to advance Indigenous and community-based groups interests in salmon stewardship activities to rebuild salmon populations and ecosystem health.5 The Community Economic Development Program (CEDP) and Public Involvement Program (PIP) support over 90 on-going Indigenous and community led projects focused on enhancement and community involvement.
Notes:
All dollar values are in 2023$.
Averages are calculated based on available data from 2014 to 2021.
Commercial fishing sector includes revenues from commercial fishing and value-added processing.
1This direct output value includes only the contribution of SEP hatchery and spawning channel salmon.
2Facility operation data only available from 2016 to 2021.
3These facility operational costs also contribute benefits to First Nations FSC and freshwater fisheries that are not captured in this infographic.
4SEP contributions to FSC harvest cannot be quantified due to data availability.
5Salmonid Enhancement Program Regional Website.
Long text version
Contribution to the marine commercial fishing sector
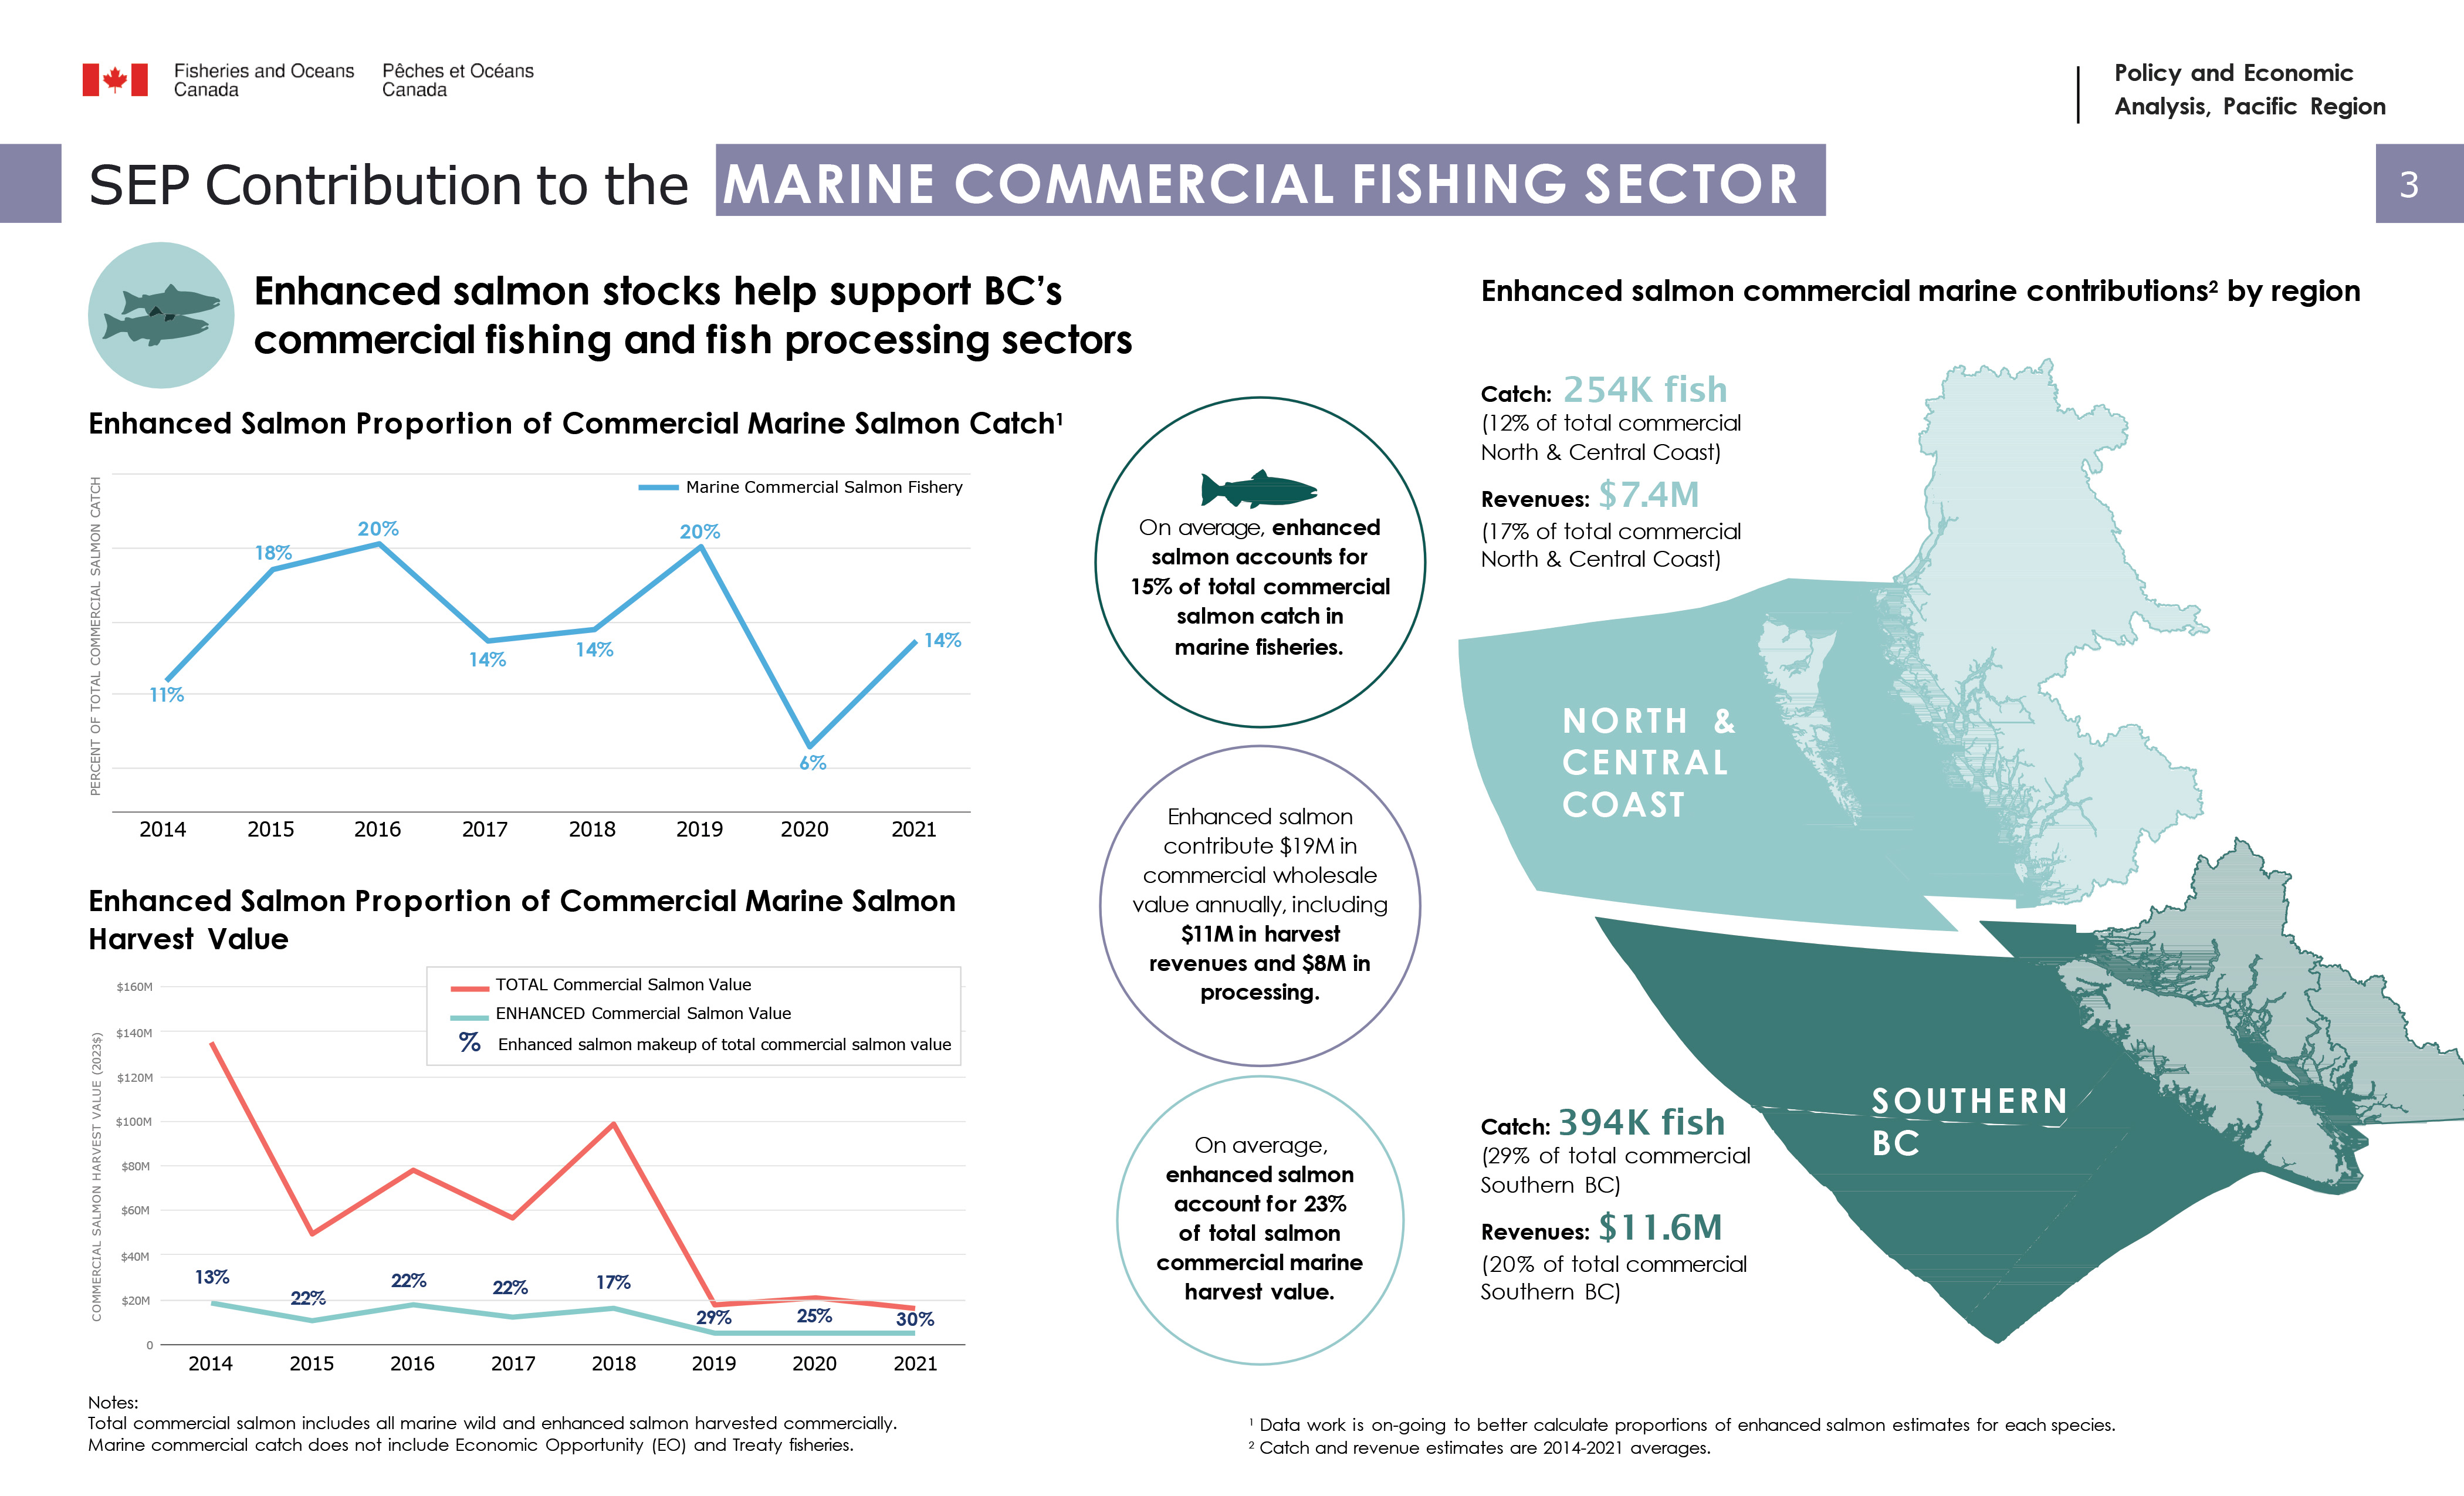
Enhanced salmon stocks help support BC’s commercial fishing and fish processing sectors.
Enhanced salmon proportion of commercial marine salmon catch1 is presented by year.
- 2014: 11%
- 2015: 18%
- 2016: 20%
- 2017: 14%
- 2018: 14%
- 2019: 20%
- 2020: 6%
- 2021: 14%
Total commercial salmon value, enhanced commercial salmon value, and enhanced salmon proportion of commercial marine salmon harvest value is presented by year.
Total commercial salmon value
- 2014: $135M
- 2015: $49M
- 2016: $78M
- 2017: $57M
- 2018: $98M
- 2019: $18M
- 2020: $20M
- 2021: $16M
Enhanced commercial salmon value
- 2014: $18M
- 2015: $11M
- 2016: $17M
- 2017: $12M
- 2018: $16M
- 2019: $5M
- 2020: $5M
- 2021: $5M
Enhanced salmon makeup of total commercial salmon value
- 2014: 13%
- 2015: 22%
- 2016: 22%
- 2017: 22%
- 2018: 17%
- 2019: 29%
- 2020: 25%
- 2021: 30%
On average, enhanced salmon accounts for 15% of total commercial salmon catch in marine fisheries.
Enhanced salmon contribute $19M in commercial wholesale value annually, including $11M in harvest revenues and $8M in processing.
On average, enhanced salmon account for 23% of total salmon commercial marine harvest value.
Enhanced salmon commercial marine contributions2 is presented by region.
- North & central coast
- Catch: 254K fish (12% of total commercial north & central coast)
- Revenues: $7.4M (17% of total commercial north & central coast)
- Southern BC
- Catch: 394K fish (29% of total commercial southern BC)
- Revenues: $11.6M (20% of total commercial southern BC)
Notes:
Total commercial salmon includes all marine wild and enhanced salmon harvested commercially. Marine commercial catch does not include Economic Opportunity (EO) and Treaty fisheries.
1Data work is on-going to better calculate proportions of enhanced salmon estimates for each species.
2Catch and revenue estimates are 2014-2021 averages.
Long text version
Contribution to the marine recreational fishing sector
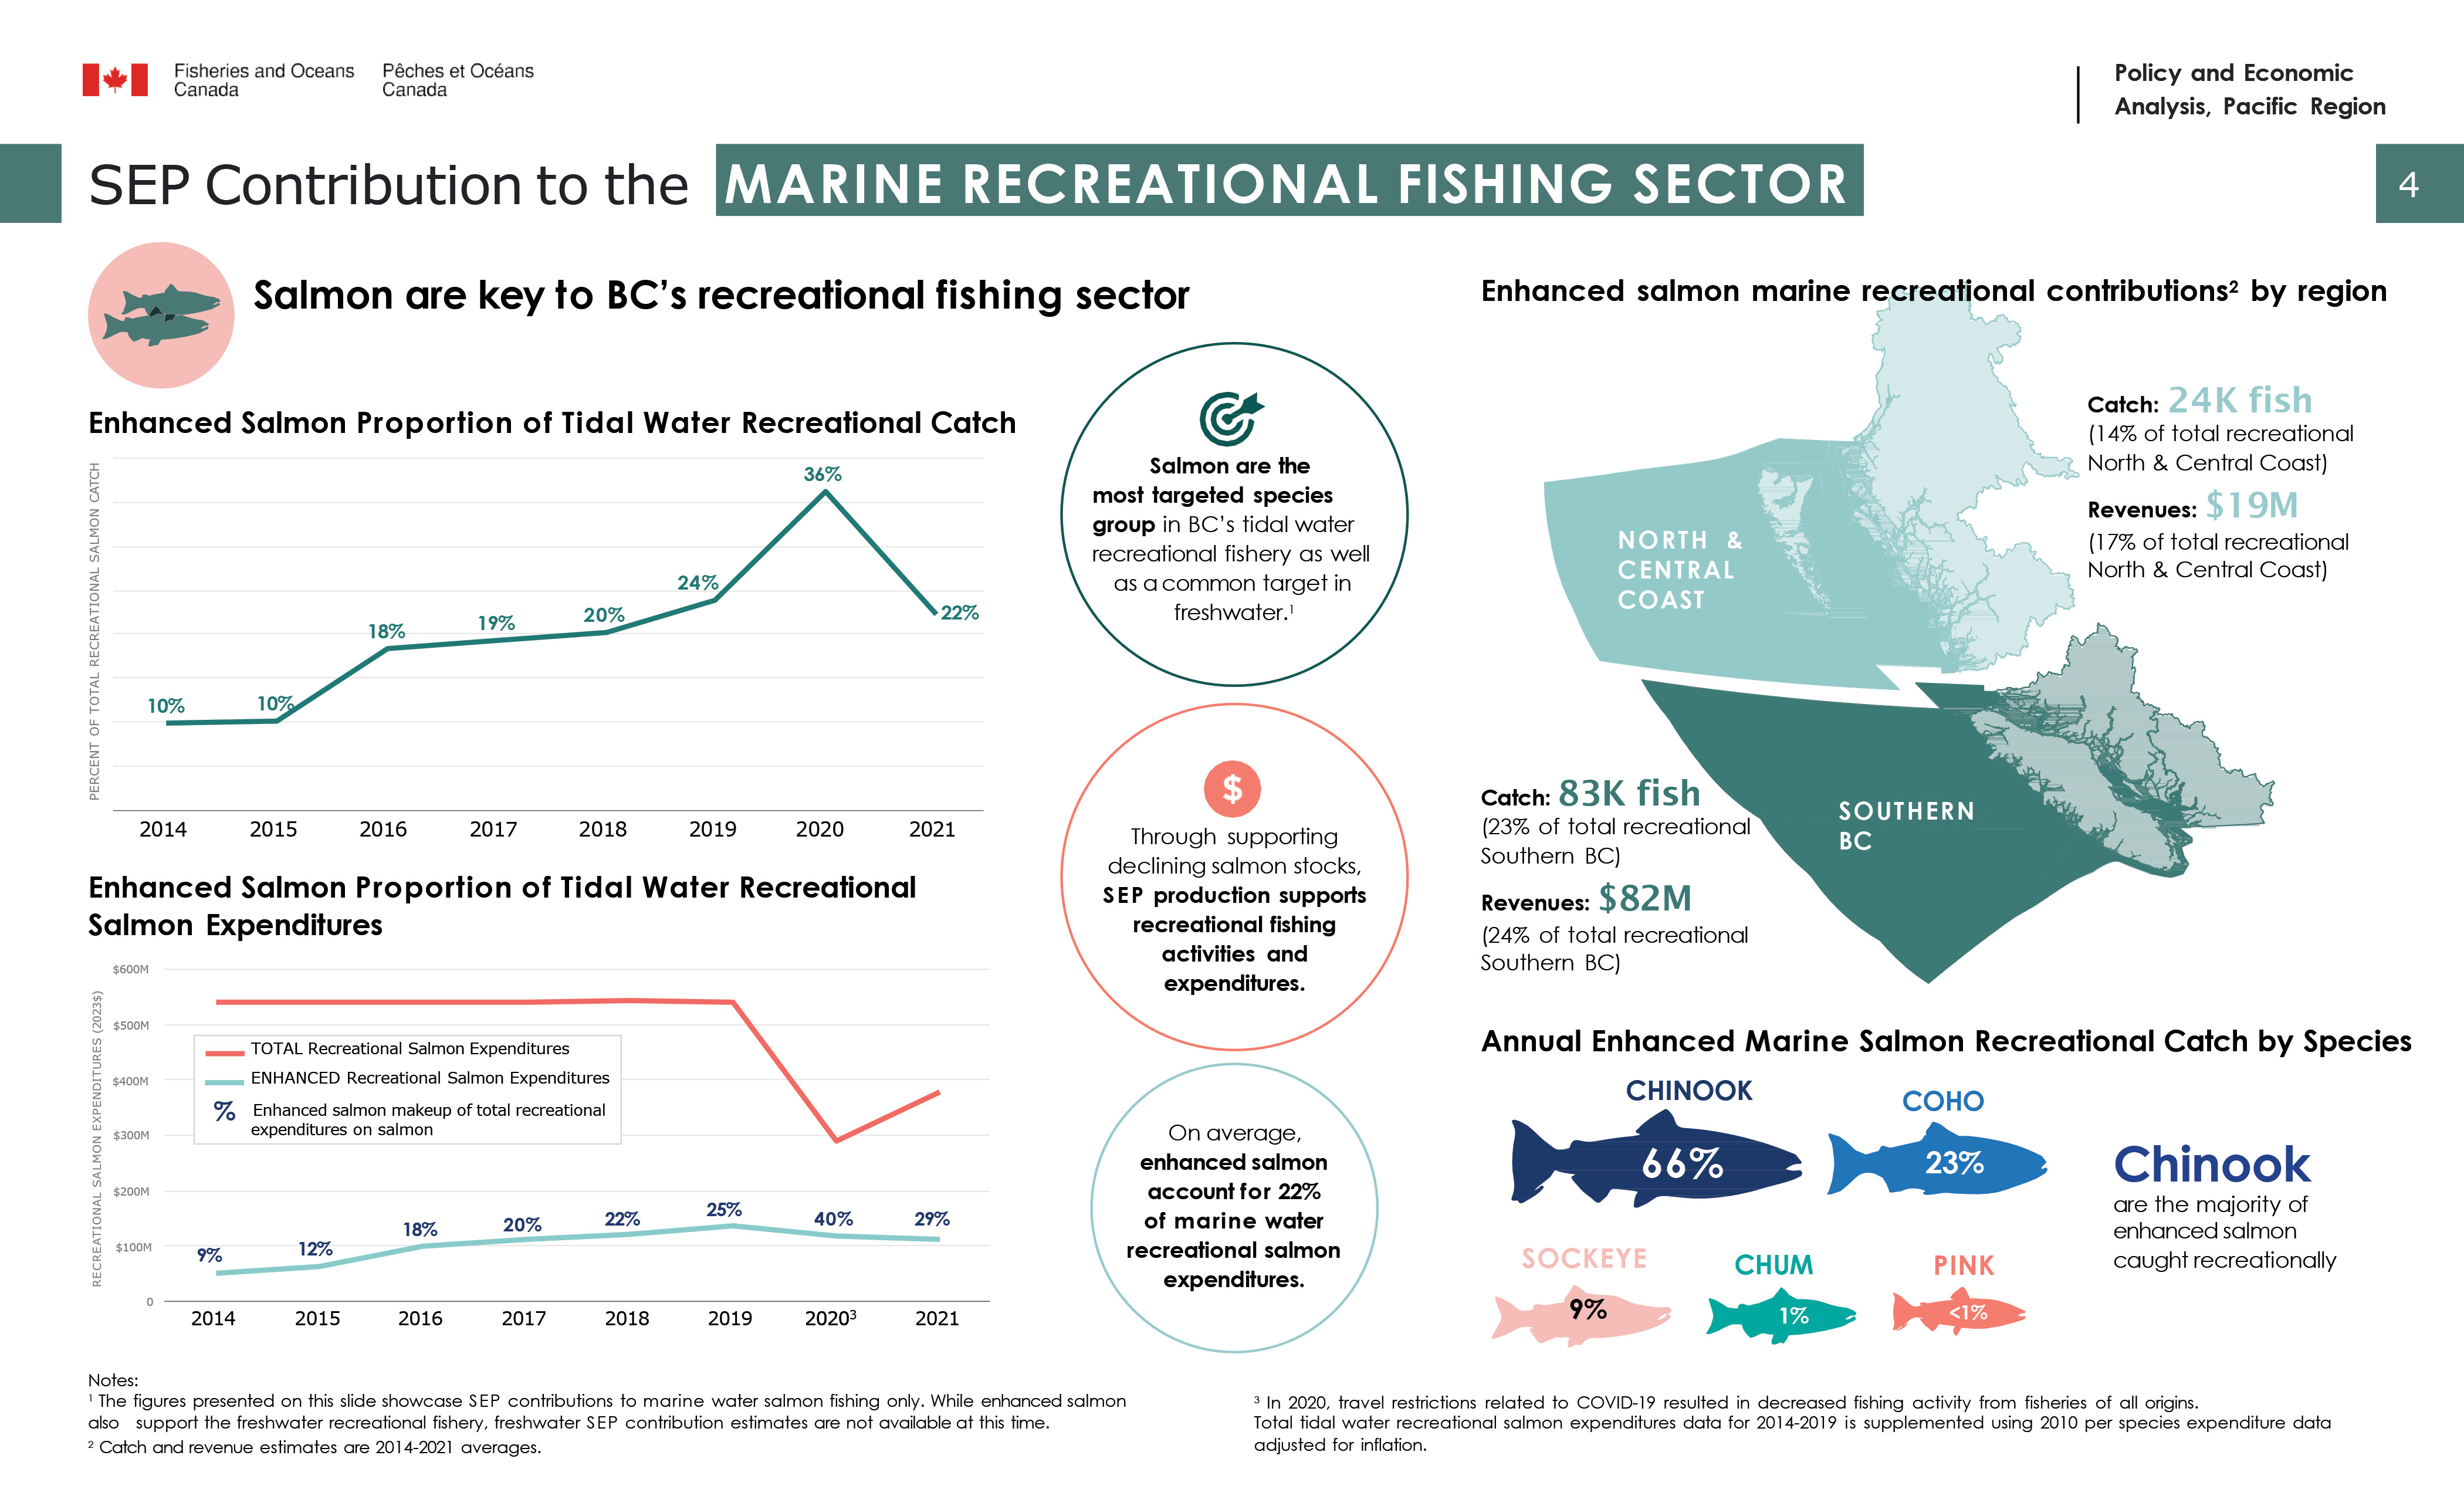
Salmon are key to BC’s recreational fishing sector.
Enhanced Salmon Proportion of Tidal Water Recreational Catch is presented by year.
- 2014: 10%
- 2015: 10%
- 2016: 18%
- 2017: 19%
- 2018: 20%
- 2019: 24%
- 2020: 36%
- 2021: 22%
Total recreational salmon expenditures, enhanced recreational salmon expenditures, and enhanced salmon makeup of total recreational expenditures on salmon is presented by year.
Total recreational salmon expenditures
- 2014: $542M
- 2015: $542M
- 2016: $542M
- 2017: $542M
- 2018: $542M
- 2019: $541M
- 2020: $288M
- 2021: $379M
Enhanced recreational salmon expenditures
- 2014: $49M
- 2015: $63M
- 2016: $100M
- 2017: $111M
- 2018: $120M
- 2019: $137M
- 2020: $117M
- 2021: $112M
Enhanced salmon makeup of total recreational expenditures on salmon
- 2014: 9%
- 2015: 12%
- 2016: 18%
- 2017: 20%
- 2018: 22%
- 2019: 25%
- 20203: 40%
- 2021: 29%
Salmon are the most targeted species group in BC’s tidal water recreational fishery as well as a common target in freshwater.1
Through supporting declining salmon stocks, SEP production supports recreational fishing activities and expenditures.
On average, enhanced salmon account for 22% of marine water recreational salmon expenditures.
Enhanced salmon marine recreational contributions2 is presented by region.
- North & central coast
- Catch: 24K fish (14% of total recreational north & central coast)
- Revenues: $19M (17% of total recreational north & central coast)
- Southern BC
- Catch: 83K fish (23% of total recreational southern BC)
- Revenues: $82M (24% of total recreational southern BC)
Annual enhanced marine salmon recreational catch is presented by species.
- Chinook: 66%
- Coho: 23%
- Sockeye: 9%
- Chum: 1%
- Pink: less than 1%
Chinook are the majority of enhanced salmon caught recreationally.
Notes:
1The figures presented on this slide showcase SEP contributions to marine water salmon fishing only. While enhanced salmon also support the freshwater recreational fishery, freshwater SEP contribution estimates are not available at this time.
2Catch and revenue estimates are 2014-2021 averages.
3In 2020, travel restrictions related to COVID-19 resulted in decreased fishing activity from fisheries of all origins.
Total tidal water recreational salmon expenditures data for 2014-2019 is supplemented using 2010 per species expenditure data adjusted for inflation.
Notes and methodology
Concepts, terms and definitions
- Salmonid enhancement program (SEP):
- aims to rebuild vulnerable salmon stocks, provide harvest opportunities, work with Indigenous and coastal communities in economic development, and improve fish habitat to sustain salmon populations.
- Commercial fishing:
- refers to catching fish for profit. Does not include aquaculture salmon.
- Direct Output:
- measure of total value of production associated with the fishing industry.
- Recreational fishing:
- refers to non-commercial fishing.
- Enhanced salmon:
- a fish that has been incubated, reared, and released to co-migrate with wild populations.
- Facility Expenditures:
- spending that occurs for the operation and maintenance of the hatchery.
Data description
The amount of enhanced stock intercepted by commercial fishing fleets and recreational anglers is estimated based on release and retrieval data submitted as part of the Enhancement Planning and Assessment Database (EPAD) and coded wire tag programs. This data is only available for chinook and coho. Sockeye, pink, and chum do not have coded wire-tag recovery estimates; instead, an estimated percentage is used to calculate enhanced catch for these species. Sockeye, pink, and chum enhanced proportion estimates may not accurately represent enhanced salmon contributions for the respective species in the fisheries as this data is highly uncertain. There is on-going work to refine enhanced salmon estimates for all species in each fishery.
Food, social, and ceremonial catch estimates are from the Pacific Salmon Commission (PSC) Annual Reports.
Total wild marine catch estimates for chinook and coho are sourced from catch stats data unit, shared by the SEP team. Total marine catch estimates for sockeye, pink, and chum are from DFO Pacific Region commercial salmon in-season catch estimates dataset (2005-2022) posted to the Government of Canada’s Open Data Portal. Total wild commercial landed value estimates for the marine fishery are from Logbook and Sale slips data. Wholesale value estimates are based on ratios applied to landed value. Total wild terminal catch estimates are from the Pacific Salmon Commission (PSC) Annual Reports.
Total wild recreational catch estimates are sourced from catch stats data unit, shared by the SEP team. Total wild salmon expenditures were supplemented using data from the Survey of Recreational Fishing in Canada (2014-2019) and Internet Socioeconomic Analysis (iSEA) Survey of Tidal Recreational Fishing (2020-2021).
Methodology
Salmon Enhancement Group (SEP): provided coded-wire tag (CWT) recoveries for chinook and coho, and a percentage of enhanced salmon for sockeye, pink, and chum. This data was provided by coast (North and South Coast), fishery type, and year. These percentages were applied to catch (number of fish) and revenues (dollars) by the same metrics (species, coast, fishery, year) to estimate enhanced salmon contributions.
- Date modified: