
Escapes of farmed fish from aquaculture facilities in B.C.
Escapes of farmed fish from aquaculture facilities in B.C. are reported to us by licence holders when a release of fish has been witnessed or there is evidence to show it likely occurred. These escapes can be a result of equipment failure, extreme weather, handling error, or holes in nets.
In B.C., fish escapes have been reported from both marine aquaculture facilities (containment structures in the ocean such as net pens) and land-based aquaculture facilities (containment structures on land and in-land waters, such as fish hatcheries).
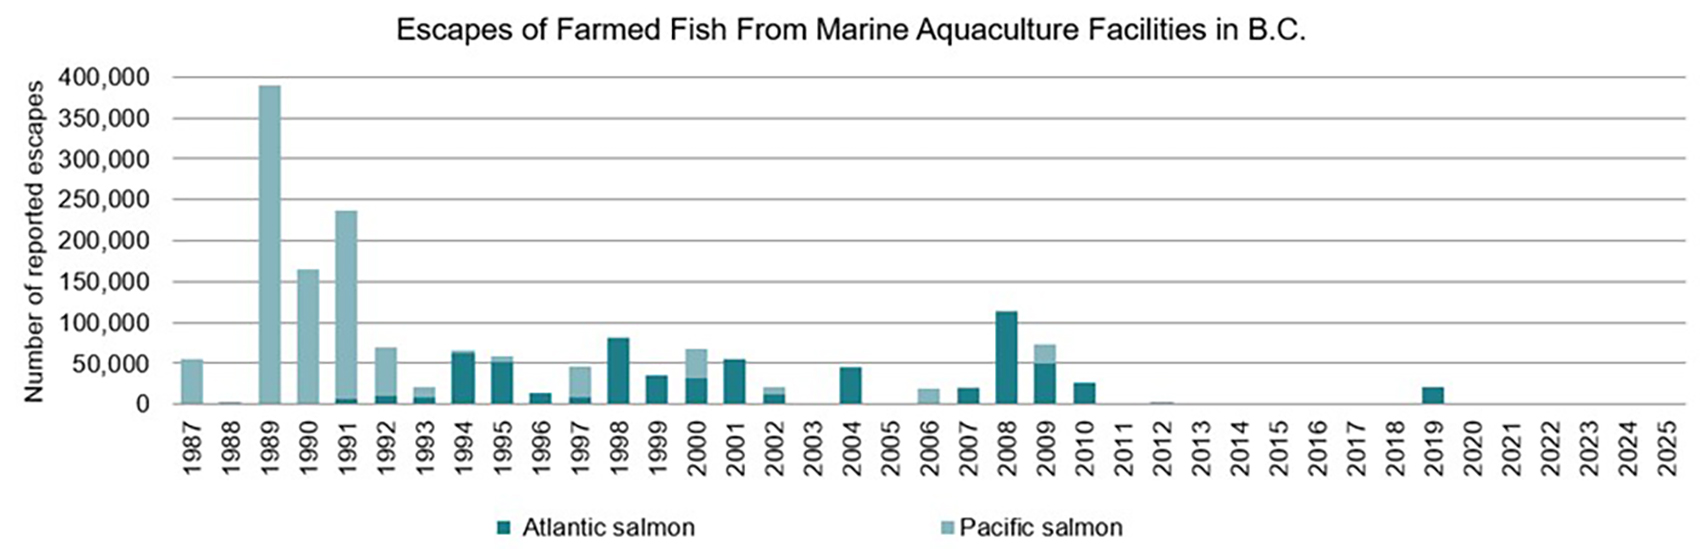
Escapes of farmed fish from marine aquaculture facilities in British Columbia
This graph shows the number of farmed fish reported to have escaped from B.C. marine aquaculture facilities from 1987 onwards. We began collecting escape reports in December of 2010. Before this, the information was collected by the Government of British Columbia. The number of escapes has decreased dramatically over time due to improved net materials and anchoring.
Long text version
Escapes of farmed fish from marine aquaculture facilities in British Columbia, 1987-2025
When no escape has been reported, we record not applicable (n/a) in the table below.
| year | Number of reported Atlantic salmon escapes | Number of reported Pacific salmon escapes |
|---|---|---|
| 2501012025 | 2 | n/a |
| 2401012024 | 1 | 3 |
| 2301012023 | 301 | n/a |
| 2201012022 | 3 | 1 |
| 2101012021 | 2 | n/a |
| 2001012020 | 1,076 | n/a |
| 1901012019 | 21,031 | n/a |
| 1801012018 | 13 | n/a |
| 1701012017 | 9 | n/a |
| 1601012016 | 23 | n/a |
| 1501012015 | 2 | 1 |
| 1401012014 | 20 | n/a |
| 1301012013 | n/a | 250 |
| 1201012012 | 8 | 2,746 |
| 1101012011 | n/a | n/a |
| 1001012010 | 27,024 | n/a |
| 0901012009 | 48,857 | 23,888 |
| 0801012008 | 111,769 | 57 |
| 0701012007 | 19,223 | 23 |
| 0601012006 | 17 | 19,068 |
| 0501012005 | 21 | 43 |
| 0401012004 | 43,969 | 16 |
| 0301012003 | 30 | 10 |
| 0299012002 | 11,257 | 9,198 |
| 0298012001 | 55,167 | n/a |
| 0297012000 | 31,855 | 36,392 |
| 0297011999 | 35,954 | n/a |
| 0296011998 | 80,975 | 1,900 |
| 0295011997 | 7,472 | 38,956 |
| 0294011996 | 13,137 | n/a |
| 0293011995 | 51,883 | 6000 |
| 0292011994 | 62,809 | 2,300 |
| 0291011993 | 9,000 | 12,113 |
| 0290011992 | 9,546 | 59,632 |
| 0289011991 | 6,650 | 229,500 |
| 0287011990 | n/a | 165,000 |
| 0286011989 | n/a | 390,165 |
| 0285011988 | n/a | 2,000 |
| 0284011987 | n/a | 54,998 |
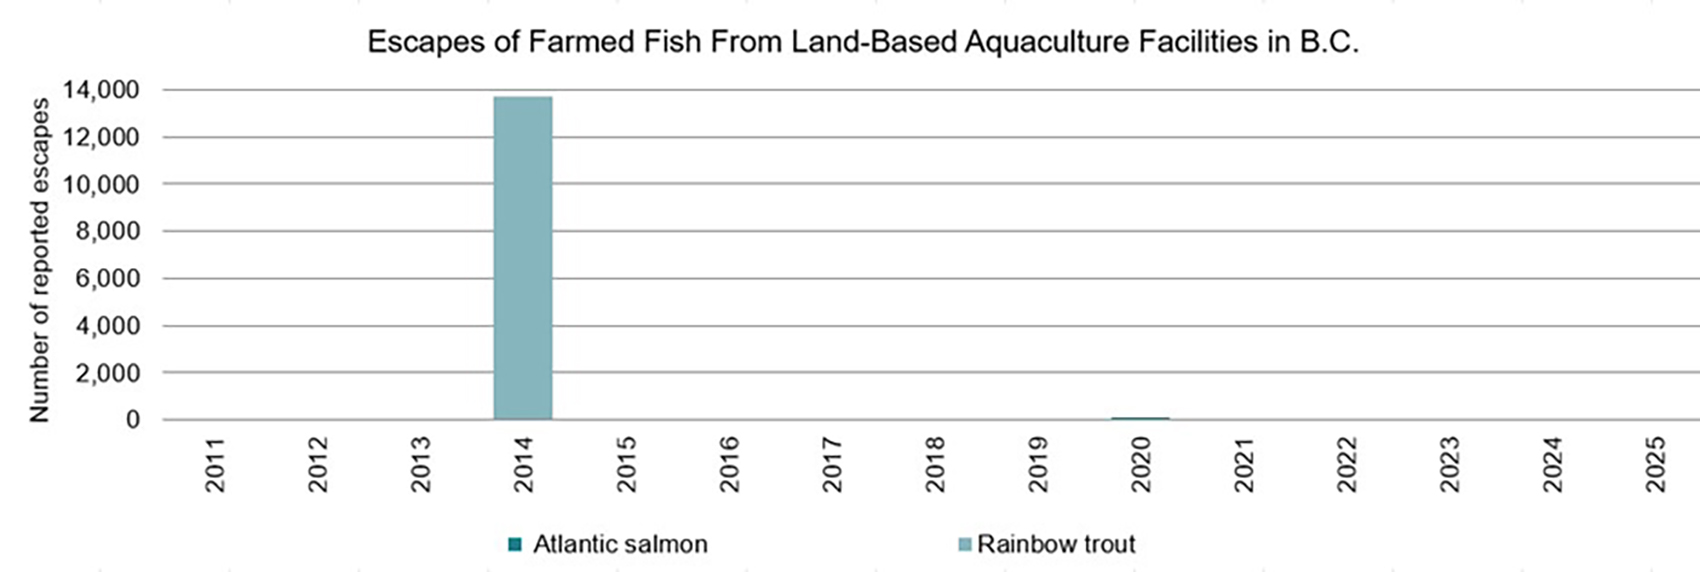
Escapes of farmed fish from land-based aquaculture facilities in British Columbia
This graph shows the number of farmed fish reported to have escaped from B.C. land-based aquaculture facilities from 2011 onwards.
Long text version
Escapes of farmed fish from land-based aquaculture facilities in British Columbia, 2011 to 2025
When no escape has been reported, we record not applicable (n/a) in the table below.
| year | Number of reported Atlantic salmon escapes | Number of reported rainbow trout escapes |
|---|---|---|
| 2501012025 | n/a | n/a |
| 2401012024 | n/a | n/a |
| 2301012023 | n/a | n/a |
| 2201012022 | 5 | n/a |
| 2101012021 | 1 | n/a |
| 2001012020 | 105 | n/a |
| 1901012019 | n/a | n/a |
| 1801012018 | n/a | n/a |
| 1701012017 | n/a | n/a |
| 1601012016 | n/a | n/a |
| 1501012015 | n/a | n/a |
| 1401012014 | n/a | 13,687 |
| 1301012013 | n/a | n/a |
| 1201012012 | n/a | n/a |
Related links
- Escape prevention for farmed fish
- Escapes of cultured finfish from BC aquaculture sites - Open Government portal
- Date modified: