
Fieldnotes 2024 to 2025: Spotlight on salmon stock assessment


Description: Fieldnotes spotlight on salmon stock assessment
Fisheries and Oceans Canada (DFO) staff, often in collaboration with partners, deliver three types of monitoring programs to support area-based salmon stock assessment. The information generated by these programs is compiled annually to provide advice on the management of salmon populations.
- Population monitoring programs estimate the abundance of salmon and their condition. Methods used range from basic visual surveys to application intensive mark-recapture or passage enumeration, and associated biological sampling.
- Catch monitoring programs estimate catch, releases, fishing effort, and the stock and age composition of catch, to evaluate harvest impacts. These are estimated through harvester reporting and survey methods. Age and stock composition is estimated by sampling DNA, scales, coded wire tags, and other stock identifiers.
- Ecosystem monitoring programs monitor habitat changes and their impact on salmon. This may include methods such as basic water quality monitoring to more comprehensive hydrology or food-web studies.
Pacific salmon stock assessment monitoring projects by area:
- YTR (Yukon and Transboundary Rivers): 45 projects
- NC (North Coast): 54 projects
- SC (South Coast): 74 projects
- FI (Fraser River and Interior): 76 projects
Area-based monitoring is further subdivided by proportion of monitoring types: Eco (Ecosystem), Catch, or Pop (Population)1.
A graph showing Pacific salmon Conservation Units (CUs) by species. Learn more.
A map showing coho salmon CU boundaries in British Columbia.
Working together for salmon
DFO, First Nations and Indigenous organizations are committed to working together and weaving science and Indigenous Knowledge to understand the many challenges facing Pacific salmon populations and inform better decision-making.
- Unique Indigenous collaborators in 2023 and 2024: 40
- DFO-Indigenous monitoring projects by area1:
- YTR (Yukon and Transboundary Rivers): 12 projects
- NC (North Coast): 14 projects
- SC (South Coast): 34 projects
- FI (Fraser River and Interior): 19 projects
A map showing DFO-Indigenous monitoring projects by species1.
Salmon stock assessment activities
A map showing DFO-Indigenous salmon stock assessment monitoring programs by activity and species1 (chinook, coho, chum, pink and sockeye)
Population monitoring:
- Enumeration (escapement): 169
- Biological sampling: 86
Catch monitoring:
- Enumeration (catch): 72
- Biological sampling: 12
Ecosystems monitoring:
- Stream assessment: 11
- Lake assessment: 5
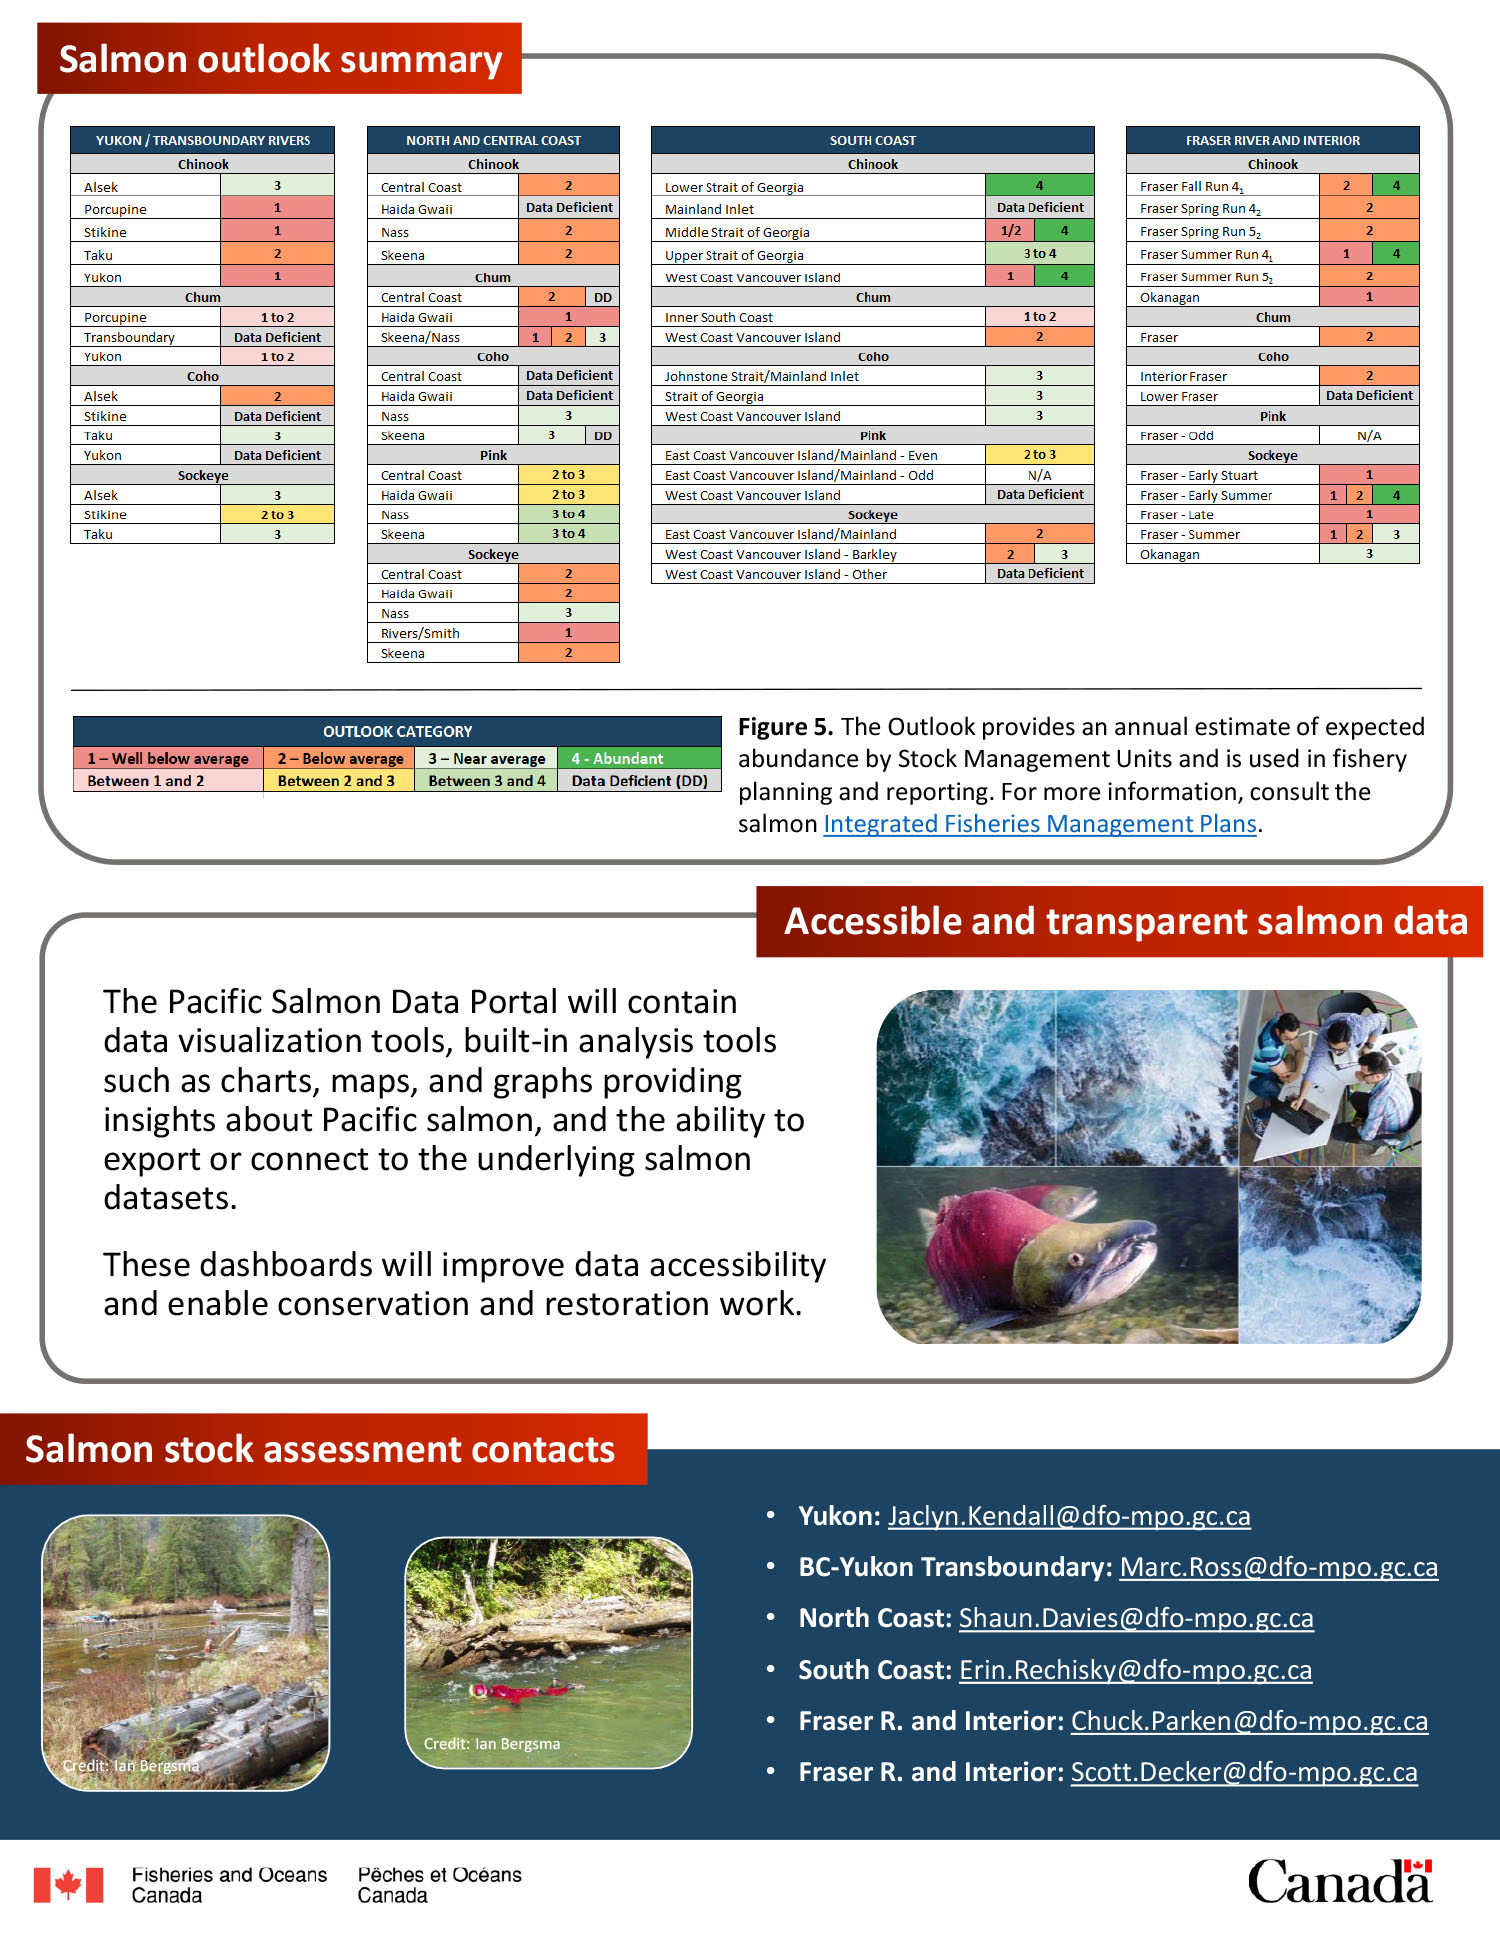
Salmon outlook summary
The Outlook provides an annual estimate of expected abundance by Stock Management Units and is used in fishery planning and reporting. For more information, consult the salmon Integrated Fisheries Management Plans.
| Species | River | Expected abundance |
|---|---|---|
| Chinook | Alsek | Near average |
| Chinook | Porcupine | Well below average |
| Chinook | Stikine | Well below average |
| Chinook | Taku | Below average |
| Chinook | Yukon | Well below average |
| Chum | Porcupine | Between well below and below average |
| Chum | Transboundary | Data deficient |
| Chum | Yukon | Between well below and below average |
| Coho | Alsek | Below average |
| Coho | Stikine | Data deficient |
| Coho | Taku | Near average |
| Coho | Yukon | Data deficient |
| Sockeye | Alsek | Near average |
| Sockeye | Stikine | Between below average and near average |
| Sockeye | Taku | Near average |
| Species | River | Expected abundance |
|---|---|---|
| Chinook | Central Coast | Below average |
| Chinook | Haida Gwaii | Data deficient |
| Chinook | Nass | Below average |
| Chinook | Skeena | Below average |
| Chum | Central Coast | Below average/Data deficient |
| Chum | Haida Gwaii | Well below average |
| Chum | Skeena/Nass | Well below average/Below average/Near average |
| Coho | Central Coast | Data deficient |
| Coho | Haida Gwaii | Data deficient |
| Coho | Nass | Near average |
| Coho | Skeena | Near average/Data deficient |
| Pink | Central Coast | Between below average and near average |
| Pink | Haida Gwaii | Between below average and near average |
| Pink | Nass | Between near average and abundant |
| Pink | Skeena | Between near average and abundant |
| Sockeye | Central Coast | Below average |
| Sockeye | Haida Gwaii | Below average |
| Sockeye | Nass | Near average |
| Sockeye | Rivers/Smith | Well below average |
| Sockeye | Skeena | Below average |
| Species | River | Expected abundance |
|---|---|---|
| Chinook | Lower Strait of Georgia | Abundant |
| Chinook | Mainland Inlet | Data deficient |
| Chinook | Middle Strait of Georgia | Well below average/Abundant |
| Chinook | Upper Strait of Georgia | Between near average and abundant |
| Chinook | West Coast Vancouver Island | Well below average/Abundant |
| Chum | Inner South Coast | Between well below and below average |
| Chum | West Coast Vancouver Island | Below average |
| Coho | Johnstone Strait/Mainland Inlet | Near average |
| Coho | Strait of Georgia | Near average |
| Coho | West Coast Vancouver Island | Near average |
| Pink | East Coast Vancouver Island/Mainland - Even | Between below average and near average |
| Pink | East Coast Vancouver Island/Mainland - Odd | N/A |
| Pink | West Coast Vancouver Island | Data deficient |
| Sockeye | East Coast Vancouver Island/Mainland | Below average |
| Sockeye | West Coast Vancouver Island - Barkley | Below average/Near average |
| Sockeye | West Coast Vancouver Island - Other | Data deficient |
| Species | River | Expected abundance |
|---|---|---|
| Chinook | Fraser fall run 4 | Below average/Abundant |
| Chinook | Fraser spring run 4 | Below average |
| Chinook | Fraser spring run 5 | Below average |
| Chinook | Fraser summer run 4 | Well below average/Abundant |
| Chinook | Fraser summer run 5 | Below average |
| Chinook | Okanagan | Well below average |
| Chum | Fraser | Below average |
| Coho | Interior Fraser | Below average |
| Coho | Lower Fraser | Data deficient |
| Pink | Fraser - Odd | N/A |
| Sockeye | Fraser - Early Stuart | Well below average |
| Sockeye | Fraser - Early summer | Well below average/Below average/Abundant |
| Sockeye | Fraser - Late | Well below average |
| Sockeye | Fraser - Summer | Well below average/Below average/Near average |
| Sockeye | Okanagan | Near average |
Accessible and transparent salmon data
The Pacific Salmon Data Portal will contain data visualization tools, built-in analysis tools such as charts, maps, and graphs providing insights about Pacific salmon, and the ability to export or connect to the underlying salmon datasets.
These dashboards will improve data accessibility and enable conservation and restoration work.
Salmon stock assessment contacts
- Yukon: Jaclyn.Kendall@dfo mpo.gc.ca
- BC-Yukon Transboundary: Marc.Ross@dfo mpo.gc.ca
- North Coast: Shaun.Davies@dfo-mpo.gc.ca
- South Coast: Erin.Rechisky@dfo-mpo.gc.ca
- Fraser R. and Interior: Chuck.Parken@dfo-mpo.gc.ca
- Fraser R. and Interior: Scott.Decker@dfo-mpo.gc.ca
Notes
1 Figure 1, Figure 4, Map 2, and Map 3 represent activities or projects funded by grants and contributions.
- Date modified: