
Fieldnotes - spotlight on the Canadian Hydrographic Service
Description: Spotlight on the Canadian Hydrographic Service
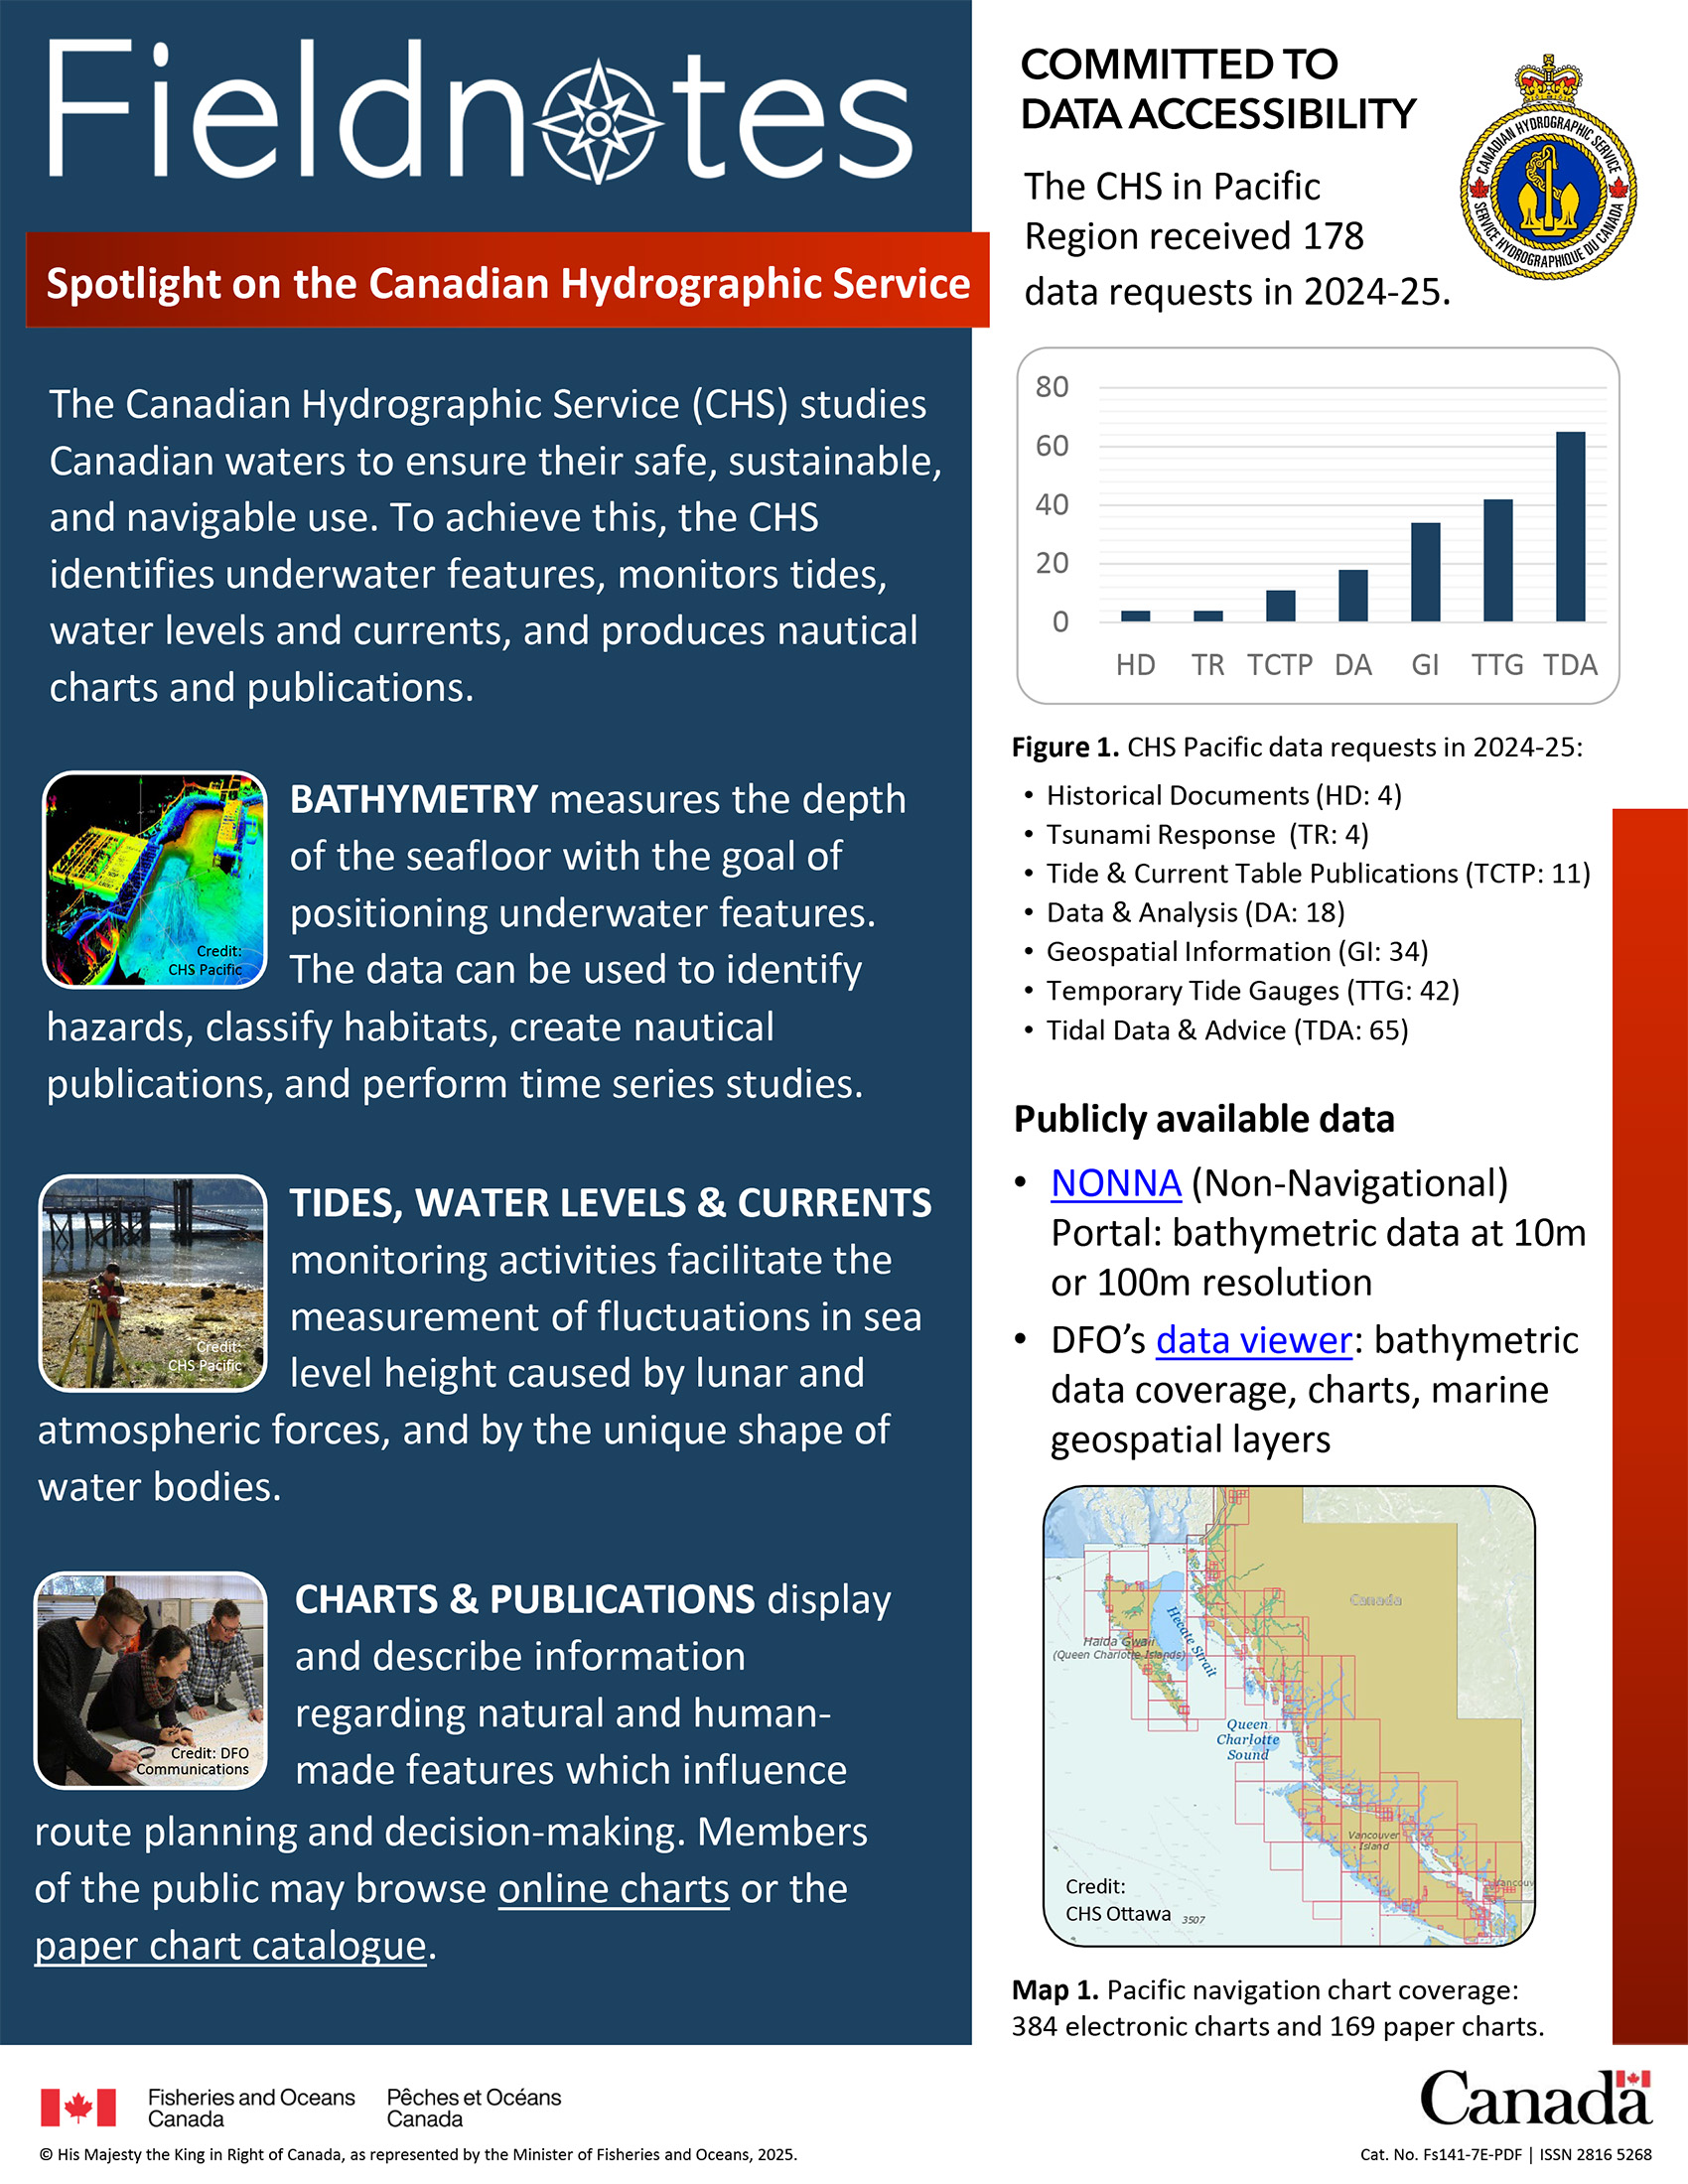
Spotlight on the Canadian Hydrographic Service
The Canadian Hydrographic Service (CHS) studies Canadian waters to ensure their safe, sustainable, and navigable use. To achieve this, the CHS identifies underwater features, monitors tides, water levels and currents, and produces nautical charts and publications.
Bathymetry measures the depth of the seafloor with the goal of positioning underwater features. The data can be used to identify hazards, classify habitats, create nautical publications, and perform time series studies.
Tides, water levels and currents monitoring activities facilitate the measurement of fluctuations in sea level height caused by lunar and atmospheric forces, and by the unique shape of water bodies.
Charts and publications display and describe information regarding natural and human-made features which influence route planning and decision-making. Members of the public may browse online charts or the paper chart catalogue.
Committed to data accessibility
The CHS in Pacific Region received 178 data requests in 2024-25.
Figure 1 shows a graph representing CHS Pacific data requests in 2024-25.
- Historical documents (HD: 4)
- Tsunami response (TR: 4)
- Tide and current table publications (TCTP: 11)
- Data and analysis (DA: 18)
- Geospatial information (GI: 34)
- Temporary tide gauges (TTG: 42)
- Tidal data and advice (TDA: 65)
Publicly available data
- NONNA (Non-Navigational) Portal: bathymetric data at 10m or 100m resolution
- DFO’s data viewer: bathymetric data coverage, charts, marine geospatial layers
Map 1. shows an over view of Pacific navigation chart coverage: 384 electronic chars and 169 paper charts.

Description: Depth of knowledge - bathymetric applications
Depth of knowledge: bathymetric applications
Investigating the seafloor
Bathymetry can be used to monitor the seafloor, including the observation of sensitive benthic areas for human impact.
For example, anchor scour marks can be identified to mitigate their influence on marine habitats.
Did you know? CHS charts more than 75 anchor berths in the Pacific Region. Learn more.
Community hydrography
The CHS assists First Nations to collect hydrographic data in their Territories. Five Vancouver Island First Nations are now equipped with bathymetric data loggers to support marine protection and habitat mapping projects
Map 2. shows bathymetric data collected by First Nations in 2024-25.
The five First Nations are:
- K'ómoks
- Ka:’yu:’k’t’h’/ Che:k’tles7et’h’
- Mamalilikulla
- Tlowitsis
- Wei Wai Kum
Tides, water levels, and currents monitoring
Map 3. shows a map of CHS real-time tidal stations in British Columbia.
Water level information is critical to voyage planning. The CHS maintains a network of 97 sensors on the Pacific Coast, which measure tides, water levels, and currents.
Figure 2 shows a pie graph representing the number of Pacific Coast CHS water level and current sensors, by type:
- Real-time observation stations (RTOS) - 45
- Temporary tide gauges (TTG) - 25
- Permanent tide gauges (PTG) - 16
- Current meter stations (CMS) - 6
- Tsunami monitoring stations (TMS) - 5
97 sensors in total.

Description: Off the charts - hydrographic mapping applications
Off the charts: hydrographic mapping applications
Restoring Indigenous place names
In 2024-25 CHS restored the following Indigenous place names on its navigation charts, in the Éy7á7juuthem and sháshishálem languages:
Restored place names in the Éy7á7juuthem language
- Tohkwonon to toqʷanan
- Kahkeeky to q̓aq̓ɛyq̓ay
- Kwehtums kahkeeky to q̓ʷətəms q̓aq̓ɛyq̓ay
- Pahkeeahjim to p̓aq̓iʔaǰɩm
- Tuxwnech to toxʷnač
- Teehshohsum to t̓ɩšosəm
- Ahgykson Island to ʔaʔgayqsən
- Tlukeht kwukthyehs to θoqʷɛt kʷukʷθays
Restored place names in the sháshishálem language
- Jervis Inlet (northern arm) to lekw’emin
- Pender Harbour to ḵalpilin
- Earls Cove to sḵelh
- Deserted Bay to ts’unay
- Mount Victoria to ḵ’els
Figure 3. is a detail of paper chart 3535 showing the restored place name ḵalpilin in the sháshishálem language.
Identifying biological features
CHS provides data on biological features, which support habitat conservation. For example, a 2023 collaborative effort was able to predict kelp canopy presence at 88 to 94% accuracy off the east coast of Haida Gwaii.
Figure 4. is a detail of a field sheet denoting depth and kelp presence.
Identifying hazards
Hazard mapping contributes to safe navigation, and protecting people, the environment, and the economy.
Map 4. is a detail of a map showing over 926 shipwrecks documented in CHS's data holding for BC waters.
Contact CHS Pacific Region
- Bathymetry: Stacey.Verrin@dfo-mpo.gc.ca
- Community Hydrography: Michel.Breton@dfo-mpo.gc.ca
- Tides and Water Levels: Denny.Sinnott@dfo-mpo.gc.ca
- Navigation Charts: Elizabeth.Bonner@dfo-mpo.gc.ca
- Questions or comments: CHSInfo@dfo-mpo.gc.ca
- Date modified: