
Fraser River environmental watch report - August 28, 2025
Ten-day daily forecasts of lower Fraser River temperature and flow conditions as well as current conditions throughout the Fraser basin are updated bi-weekly from roughly late-June until mid-August. These short-range forecasts are generated using river temperature and river flow forecast models (Hague and Patterson 2014).
The latest research on Pacific salmon freshwater migration suggests there are population-specific differences in temperature and flow tolerance thresholds (Eliason et al. 2011). These differences likely relate back to the variability in the average river environmental conditions experienced by salmon beginning their river migration at different times of the year and along different paths (Farrell et al. 2008). Despite these differences, there are also species-wide thresholds that will result in migration difficulties for most populations of Fraser River sockeye salmon. We provide species-level thresholds as a guide to interpreting the potential effect of current and forecasted river temperature and flow conditions on returning salmon. However, in general, fish historically returning to the Fraser River in the mid-summer will be more tolerant of higher temperatures than those fish returning in the early or late summer or early fall.
Current temperatures: August 27, 2025
| Location | Daily mean | Historic mean | Year range |
|---|---|---|---|
| Stuart River at Fort St. James | 20.0 | 16.9 | 2000-2024 |
| Stellako River at Glenannan | 19.4 | 17.4 | 2011-2024 |
| Nautley River at Fort Fraser | 21.9 | 16.7 | 2007-2024 |
| Nechako River at Vanderhoof | 20.9 | 16.5 | 2000-2024 |
| Nechako River at Isle Pierre | 20.9 | 17.6 | 2006-2024 |
| Bowron River at Box Canyon | 18.1 | NA | 2019-2024 |
| Fraser River at Shelley | NA | 13.7 | 1994-2024 |
| Quesnel River at Quesnel | 18.6 | 16.7 | 2000-2024 |
| Fraser River at Marguerite | 18.9 | 16.9 | 2015-2024 |
| Chilcotin River at Hanceville | 17.6 | 15.1 | 2019-2024 |
| Fraser River at Texas Creek | NA | 17.0 | 2006-2024 |
| North Thompson River at McLure | 17.8 | 14.9 | 2006-2023 |
| South Thompson River at Chase | 21.7 | 19.2 | 1994-2024 |
| Thompson River at Ashcroft | 20.2 | 18.4 | 1995-2024 |
| Fraser River at Qualark | 19.6 | 17.0 | 1950-2024 |
*Nechako R at Isle Pierre water temperature was calculated using a mixing model
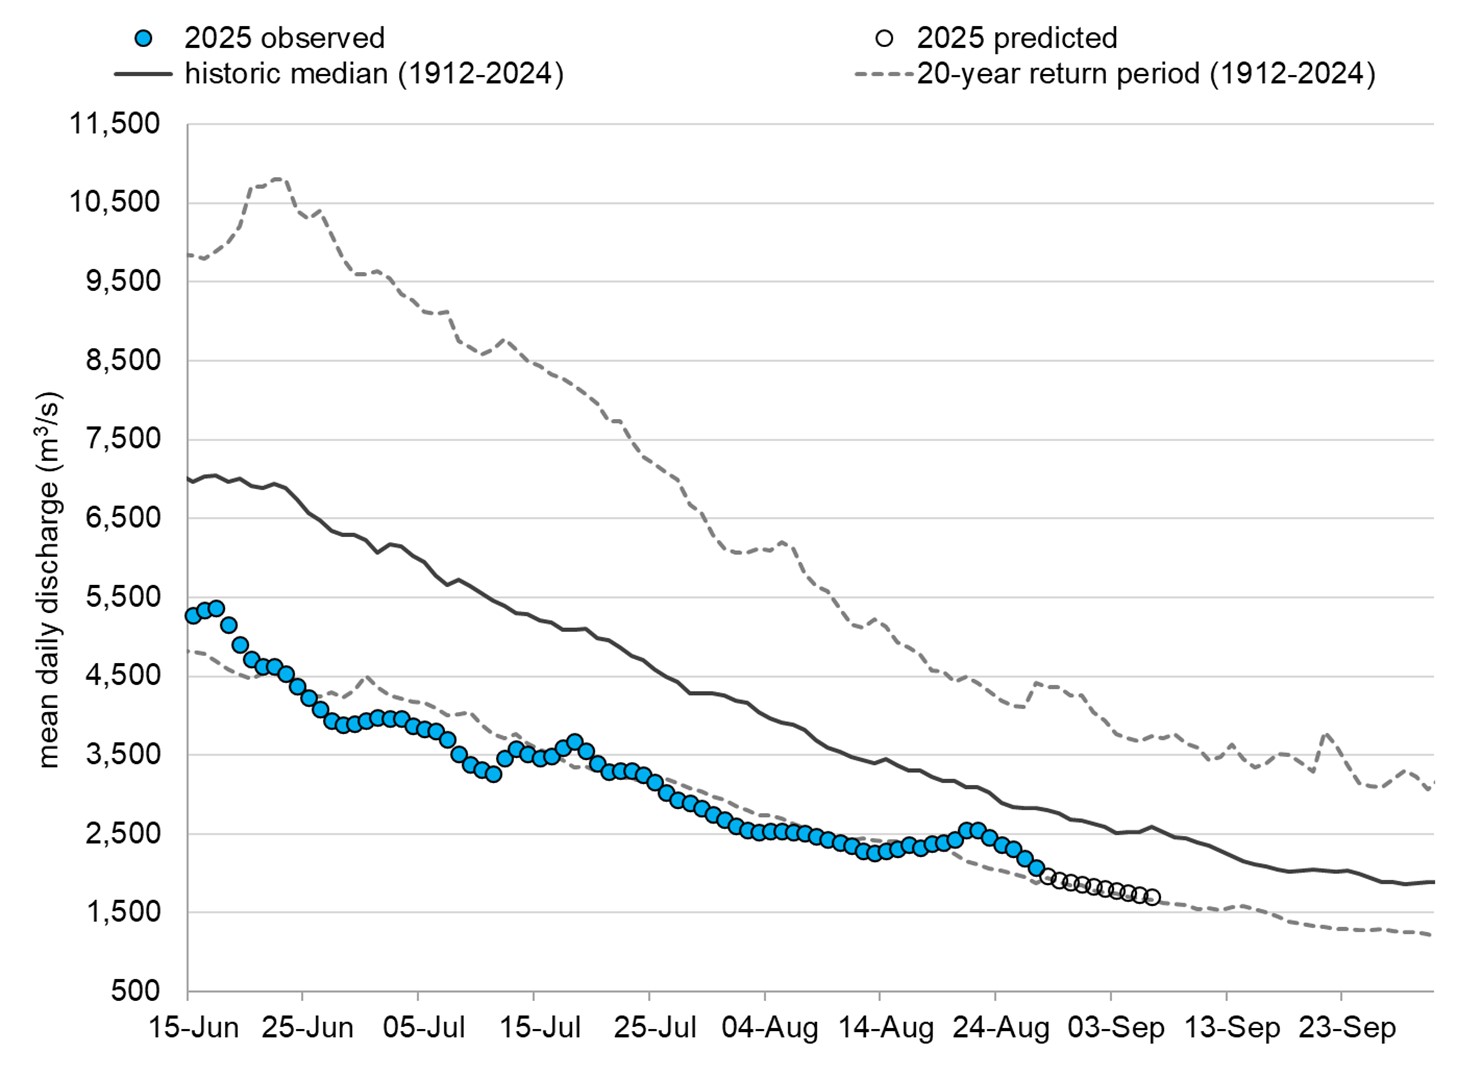
Fraser River discharge at Hope
Critical levels for fish passage through Fraser Canyon:
- 7000 cms - Early signs of physiological stress evident
- 8000 cms - Difficultly in migration delaying migration time.
- 9000 cms - Barrier to migration through Hell's Gate.
Long text version
Graph showing Fraser River mean water discharge at Hope. Graph shows 2025 observed and predicted mean daily discharge, 20 year historic median and 20 year return period (1912 to 2024). Trend lines show a steady rate then a gradual decline starting mid-June.
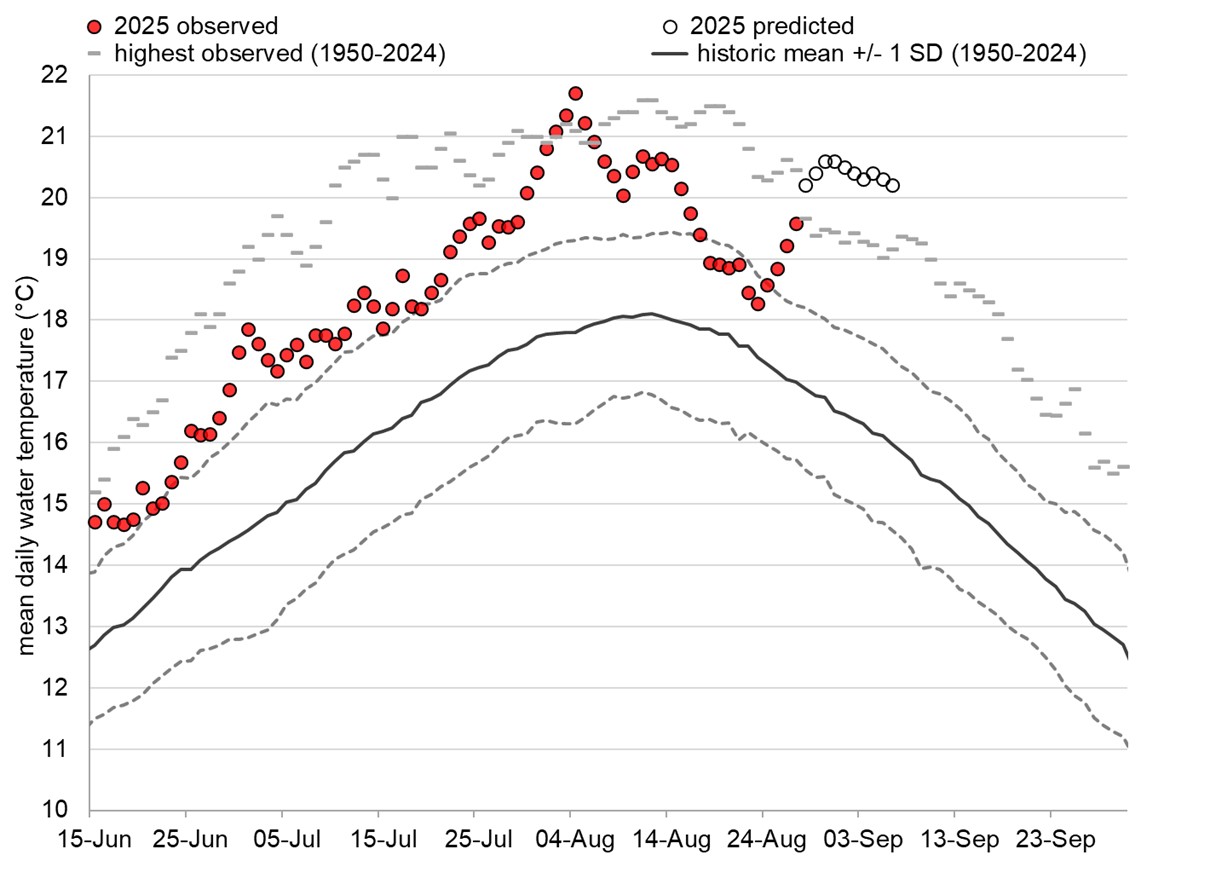
Fraser River water temperatures at Qualark
- 18°C - Decreased swimming performance
- 19°C - Early signs of physiological stress and slow migration
- 20°C - Associated with high pre-spawn mortality and disease
- 21°C - Chronic exposure can lead to severe stress and early mortality
Long text version
Graph showing Fraser River mean water temperatures at Qualark. Graph shows 2025 observed and predicted temperatures, highest observed (1950 to 2024) and historic mean (1950 to 2024). Trend lines show an increase from June to a high in August, and a decline to lows in September.
- Date modified: