
Herring stock assessments
Herring spawn in about 18% (5,348 km) of British Columbia's 29,500 km coastline. In partnership with First Nations, the fishing industry, government, and non-government organizations, our scientists assess the abundance of Pacific herring and identify strategies to meet objectives for conservation and fisheries management.
Our Pacific herring sampling surveys include:
- biological sampling surveys: Through these surveys we aim to collect biological samples from pre-spawning aggregations of Pacific Herring throughout the British Columbia coast. Monitoring of herring biology helps track changes in age and growth which informs stock status.
- spawn surveys: We monitor Pacific herring spawn (egg deposition). This helps to track changes in stock abundance. By performing these surveys, we aim to measure herring spawn on kelps and eelgrasses in intertidal / subtidal habitats using SCUBA surveys.
Stock assessment areas
The maps below show the 5 major and 2 minor Pacific herring stock assessment regions (SAR).
Major SARs:
- Haida Gwaii (HG)
- Prince Rupert District (PRD)
- Central coast (CC)
- Strait of Georgia (SoG)
- West coast of Vancouver Island (WCVI)
Minor SARs:
- Area 27 (A27)
- Area 2 West (A2W)
You can use these maps when referring to the Pacific herring spawning index data to geographically locate the regions.
Central coast
Central coast

Long text version
Map showing the following Central coast herring sections:
- 061 to 067
- 071 to 078
- 081 to 086
- 091 to 093
- 101 to 103
Haida Gwaii and A2W
Haida Gwaii and Area 2 West

Long text version
Map showing the following Haida Gwaii and Area 2 West herring sections:
- 001 to 006
- 011 to 012
- 021 to 025
Prince Rupert
Prince Rupert District

Long text version
Map showing the following Prince Rupert District herring sections:
- 031 to 033
- 041 to 043
- 051 to 053
Strait of Georgia
Strait of Georgia
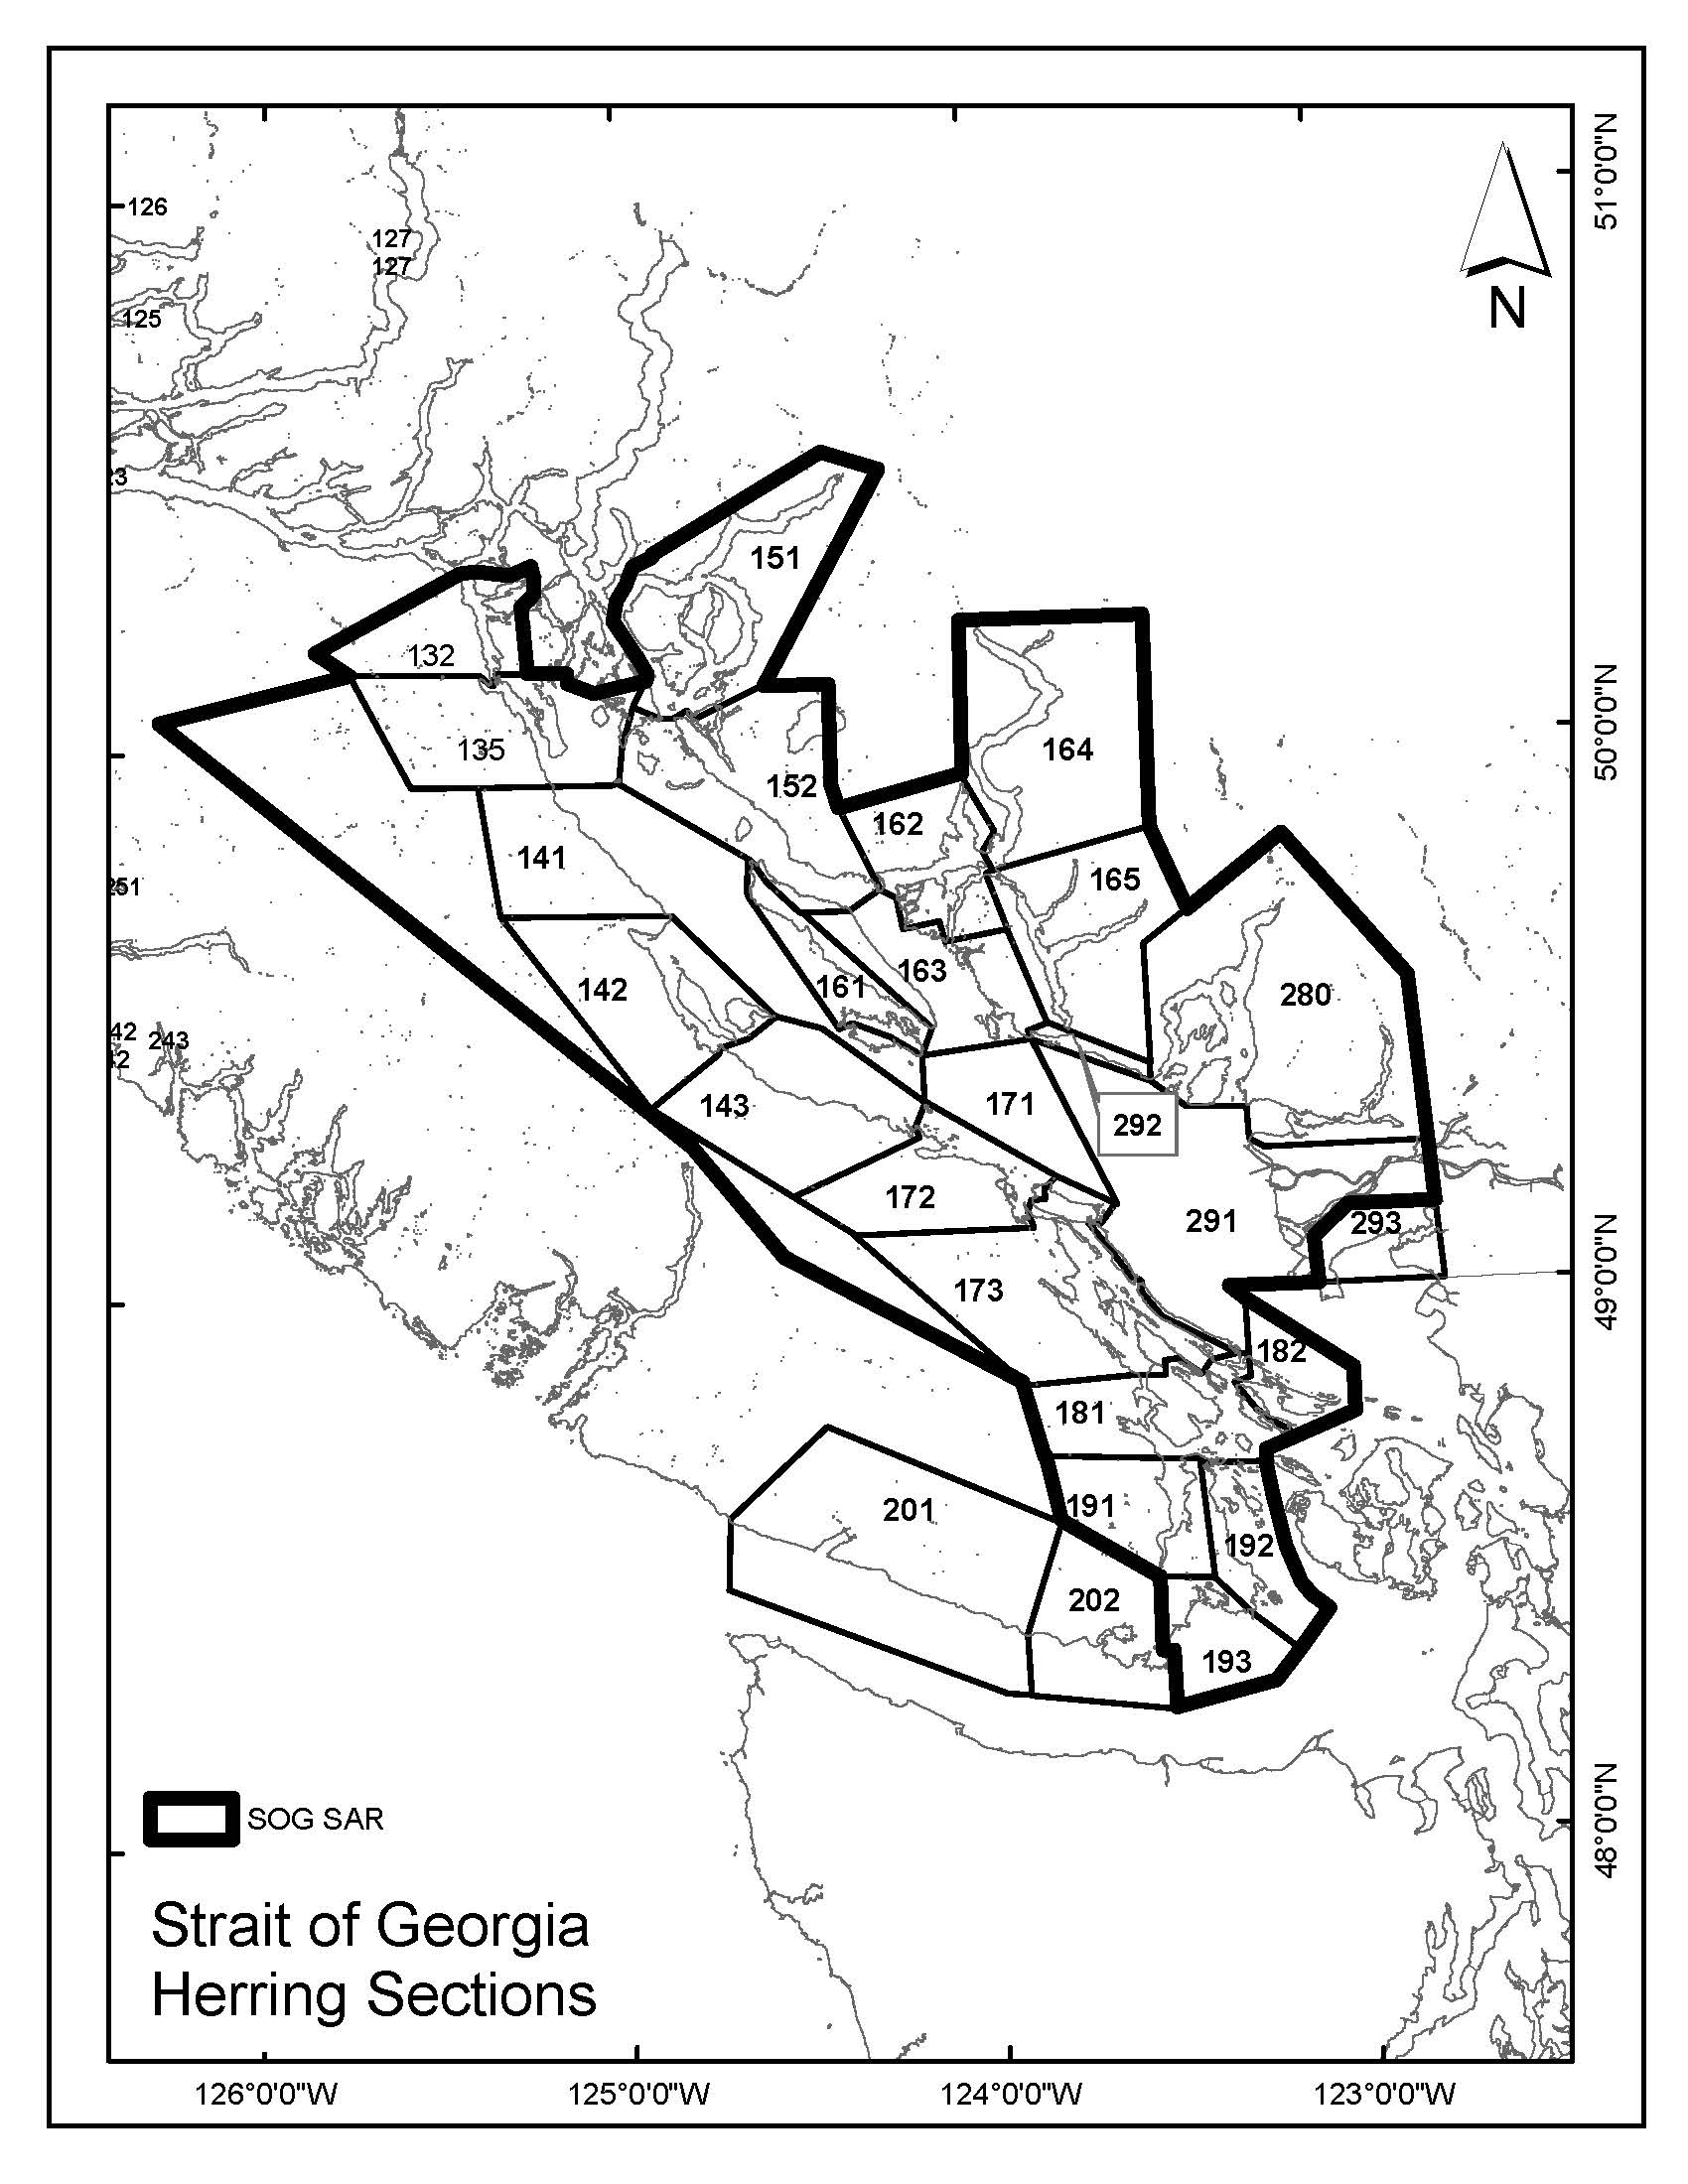
Long text version
Map showing the following Strait of Georgia herring sections:
- 132
- 135
- 141 to 143
- 151 to 152
- 161 to 165
- 171 to 173
- 181 to 182
- 191 to 193
- 201 to 202
- 280
- 291 to 293
West coast Vancouver Island and A27
West coast of Vancouver Island and Area 27

Long text version
Map showing the following West coast of Vancouver Island and Area 27 herring sections:
- 211
- 220
- 231 to 233
- 241 to 245
- 251 to 253
- 261 to 263
- 271 to 274
Data
We have used the following models to provide stock assessment advice for the major stock areas:
- 1980 to 2005: statistical catch-age model
- 2006 to 2010: herring catch age model using a Bayesian framework
- 2011 to present: integrated statistical catch age model
Pacific herring spawn index data:
Related links
- Date modified: