
British Columbia 4 sectors report, 2022
On this page
- Key economic indicators for B.C.’s fisheries and aquaculture sector (2022 Edition)
- Fisheries and aquaculture employment (2022 Edition)
- Supply and distribution of BC seafood
- Upstream industries
Key economic indicators for B.C.’s fisheries and aquaculture sector (2022)
Long text version
Key economic indicators for B.C.’s fisheries and aquaculture sector (2022)
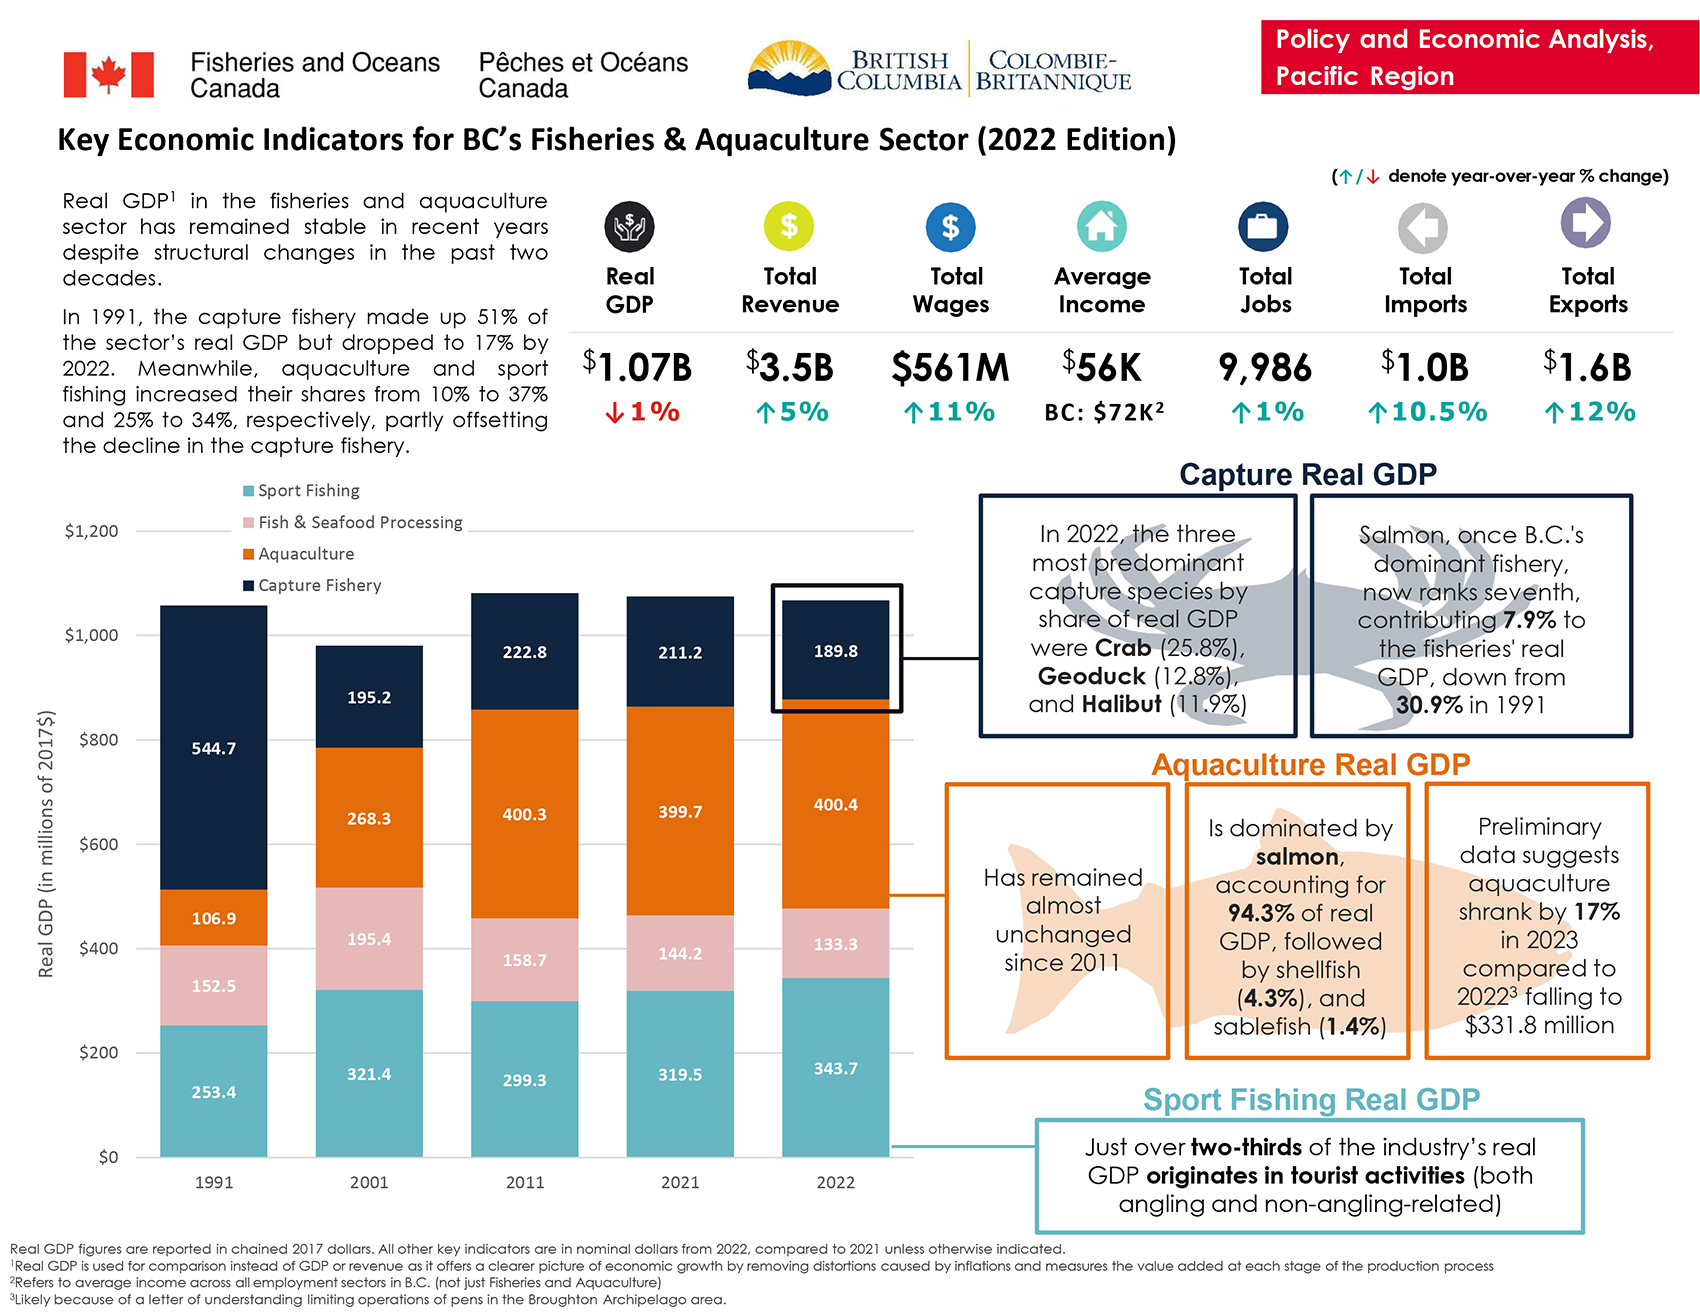
Real GDPFootnote 1 in the fisheries and aquaculture sector has remained stable in recent years despite structural changes in the past two decades.
In 1991, the capture fishery made up 51% of the sector’s real GDP but dropped to 17% by 2022. Meanwhile, aquaculture and sport fishing increased their shares from 10% to 37% and 25% to 34%, respectively, partly offsetting the decline in the capture fishery.
Key metrics from the British Columbia’s Fisheries and Aquaculture Sector 2022 Edition Report are reported.
- Real GDP ($1.07 billion, decreasing 1% since 2021)
- Total revenue ($3.5 billion, increasing 5% since 2021)
- Total wages ($561 million, increasing 11 % since 2021)
- Average income ($56 thousand in the sector, compared to $72 thousandFootnote 2 in all sectors in B.C.)
- Total jobs (9,986, increasing 1% since 2021)
- Total imports ($1.0 billion, increasing 10.5% since 2021)
- Total exports ($1.6 billion, increasing 12% since 2021)
Real GDP for the four sectors (sport fishing, fish and seafood processing, aquaculture and the capture fishery) are presented for the past 30 years.
1991 real GDP:
- Capture fishery ($544.7 million)
- Aquaculture ($106.9 million)
- Fish and seafood processing ($152.5 million)
- Sport fishing ($253.4 million)
2001 real GDP:
- Capture fishery ($195.2 million)
- Aquaculture ($268.3 million)
- Fish and seafood processing ($195.4 million)
- Sport fishing ($321.4 million)
2011 real GDP:
- Capture fishery ($222.8 million)
- Aquaculture ($400.3 million)
- Fish and seafood processing ($158.7 million)
- Sport fishing ($299.3 million)
2021 real GDP:
- Capture fishery ($211.2 million)
- Aquaculture ($399.7 million)
- Fish and seafood processing ($144.2 million)
- Sport fishing ($319.5 million)
2022 real GDP:
- Capture fishery ($189.8 million)
- Aquaculture ($400.4 million)
- Fish and seafood processing ($133.3 million)
- Sport fishing ($343.7 million)
Capture real GDP:
- In 2022, the 3 most predominant capture species by share of real GDP were crab (25.8%), geoduck (12.8%), and halibut (11.9%).
- Salmon, once B.C.’s dominant fishery, now ranks seventh, contributing 7.9% to the fisheries’ real GDP, down from 30.9% in 1991.
Aquaculture real GDP:
- Has remained almost unchanged since 2011.
- Is dominated by salmon, accounting for 94.3% of real GDP, followed by shellfish (4.3%), and sablefish (1.4%).
- Preliminary data suggests aquaculture shrank by 17% in 2023 compared to 2022Footnote 3 falling to $331.8 million.
Sport fishing real GDP:
- Just over two-thirds of the industry’s real GDP originates in tourist activities (both angling and non-angling related).
Fisheries and aquaculture employment (2022 Edition)
Long text version
Fisheries and aquaculture employment (2022 Edition)
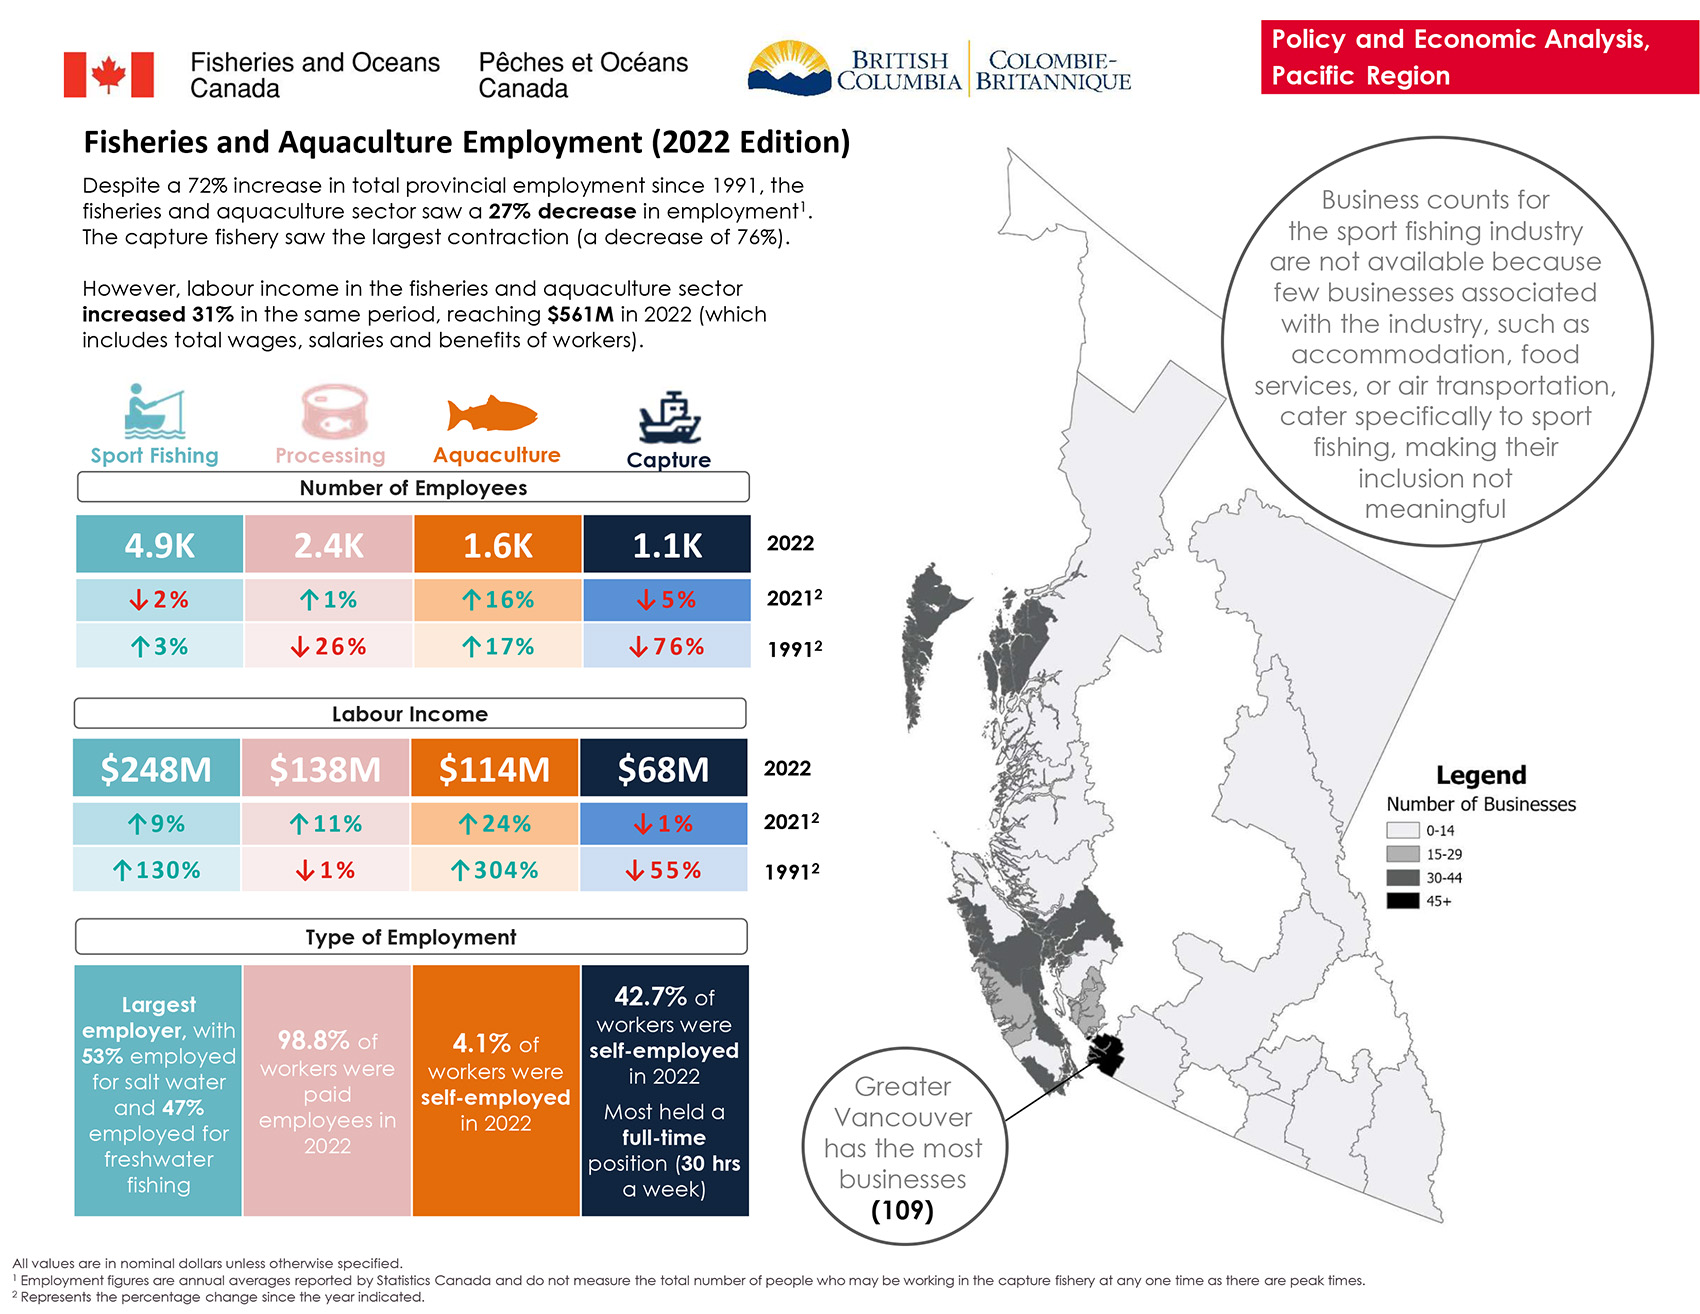
Despite a 72% increase in total provincial employment since 1991, the fisheries and aquaculture sector saw a 27% decrease in employmentFootnote 4. The capture fishery saw the largest contraction (a decrease of 76%).
However, labour income in the fisheries and aquaculture sector increased 31% in the same period, reaching $561 million in 2022 (which includes total wages, salaries and benefits of workers).
Key metrics for the number of employees by sector:
In 2022,
- Sport fishing had 4,900 employees (down 2% since 2021, but up 3% since 1991)Footnote 5
- Fish and seafood processing had 2,400 employees (up 1% since 2021, but down 26% since 1991)Footnote 5
- Aquaculture had 1,600 employees (up 16% since 2021 and 17% since 1991)Footnote 5
- Capture fishery had 1,100 employees (down 5% since 2021 and 76% since 1991)Footnote 5
Key metrics for labour income by sector:
In 2022,
- Sport fishing labour income totaled $248 million (up 9% since 2021, and 130% since 1991)Footnote 5
- Fish and seafood processing labour income totaled $138 million (up 11% since 2021 but down 1% since 1991)Footnote 5
- Aquaculture labour income totaled $114 million (up 24% since 2021 and 304% since 1991)Footnote 5
- Capture fishery labour income totaled $68 million (down 1% since 2021 and 55% since 1991)Footnote 5
Key statistics of employment type for each sector, in 2022:
- The sport fishing sector is the largest employer, with 53% employed for salt water and 47% employed for freshwater fishing.
- 98.8% of the fish and seafood processing sector’s workers were paid employees (i.e. not self-employed)
- 4.1% of the aquaculture employees were self-employed
- 42.7% of the capture fishery workers were self-employed and most held a full-time position (30 hours a week)
Provincial map representing the number of fisheries and aquaculture businesses (excluding sport fishing) by provincial regional district.
Business counts for the sport fishing industry are not available because few businesses associated with the industry, such as accommodation, food services, or air transportation, cater specifically to sport fishing, making their inclusion not meaningful.
Greater Vancouver has the most businesses (109).
Supply and distribution of BC seafood
Long text version
Supply and distribution of BC seafood
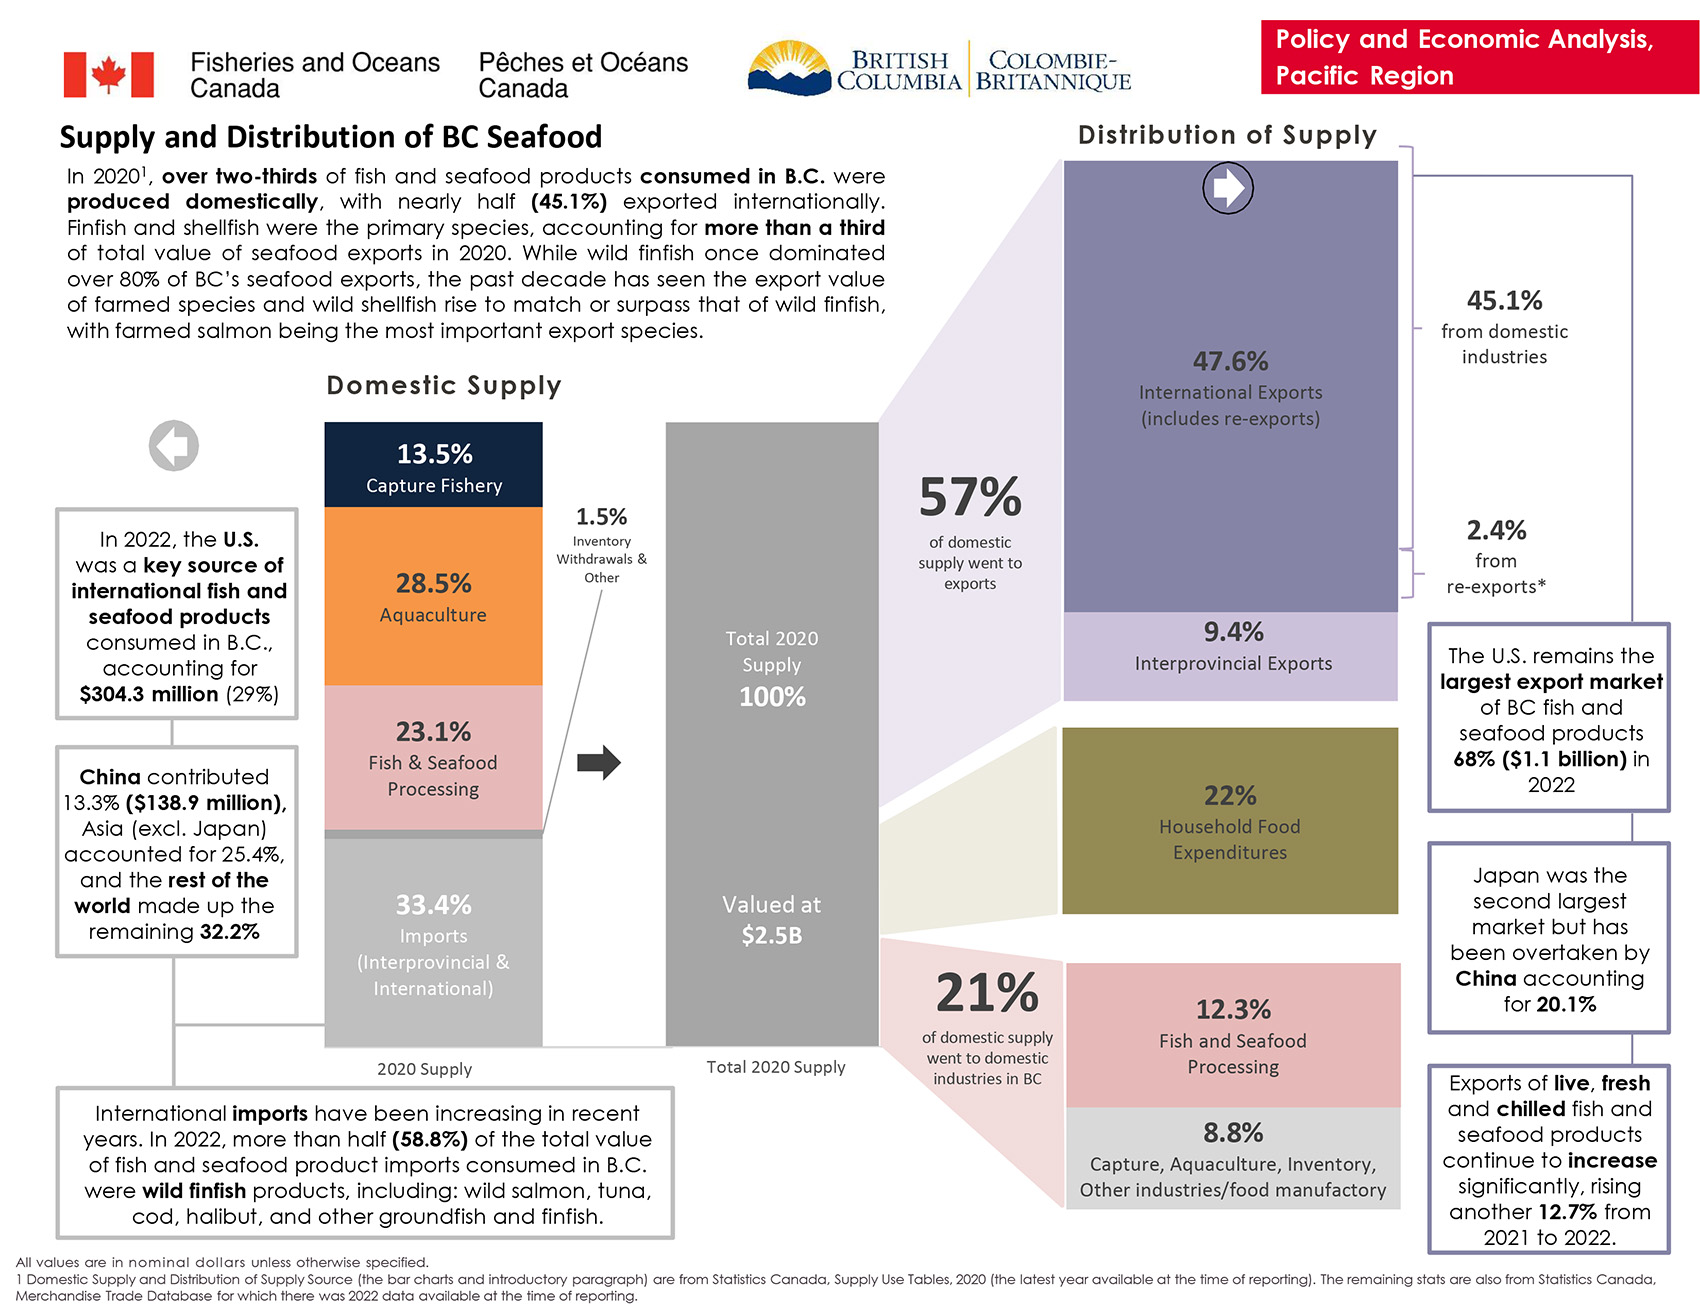
In 2020, over two-thirds of the fish and seafood products consumed in B.C. were produced domestically, with nearly half (45.1%) exported internationally. Finfish and shellfish were the primary species, accounting for more than a third of total value of seafood exports in 2020. While wild finfish once dominated over 80% of BC’s seafood exports, the past decade has seen the export value of farmed species and wild shellfish rise to match or surpass that of wild finfish, with farmed salmon being the most important export species.
Domestic supply: key metrics from 2020
- 13.5% was from the capture fishery
- 28.5% was from aquaculture
- 23.1% was from fish and seafood processing, and
- 33.4% was from imports (both interprovincial and international)
- Total 2020 supply was valued at $2.5 billion
In 2022, the U.S. was key source of international fish and seafood products consumed in B.C., accounting for $304.3 million (29%).
China contributed 13.3% ($138.9 million), Asia (excl. Japan) accounted for 25.4% and the rest of the world made up the remaining 32.2%.
International imports have been increasing in recent years. In 2022, more than half (58.8%) of the total value of fish and seafood product imports consumed in B.C. were wild finfish products, including: wild salmon, tuna, cod, halibut, and other groundfish and finfish.
Distribution of supply: key metrics from 2020
- 57% of domestic supply went to exports (9.4% to Interprovincial exports and 47.6% to International exports (of which 45.1% was from domestic industries and 2.4% from re-exports))
- 22% of domestic supply went to household food expenditures
- 21% of domestic supply went to domestic industries in B.C. (12.3% to fish and seafood processing, and 8.8% to capture fisheries, aquaculture, inventories or other industries/food manufacturing)
The U.S. remains the largest export market of B.C. fish and seafood products 68%, ($1.1 billion) in 2022.
Japan was the second largest market but has been overtaken by China accounting for 20.1%.
Exports of live, fresh, and chilled fish and seafood products continue to increase significantly, rising another 12.7% from 2021 to 2022.
Notes:
All values are in nominal dollars unless otherwise specified.
Domestic supply and distribution of supply source (the bar charts and introductory paragraph) are from Statistics Canada, supply use tables, 2020 (the latest year available at the time of reporting). The remaining stats are also from Statistics Canada, merchandise trade database for which there was 2022 data available at the time of reporting.
Upstream industries
Long text version
Upstream industries
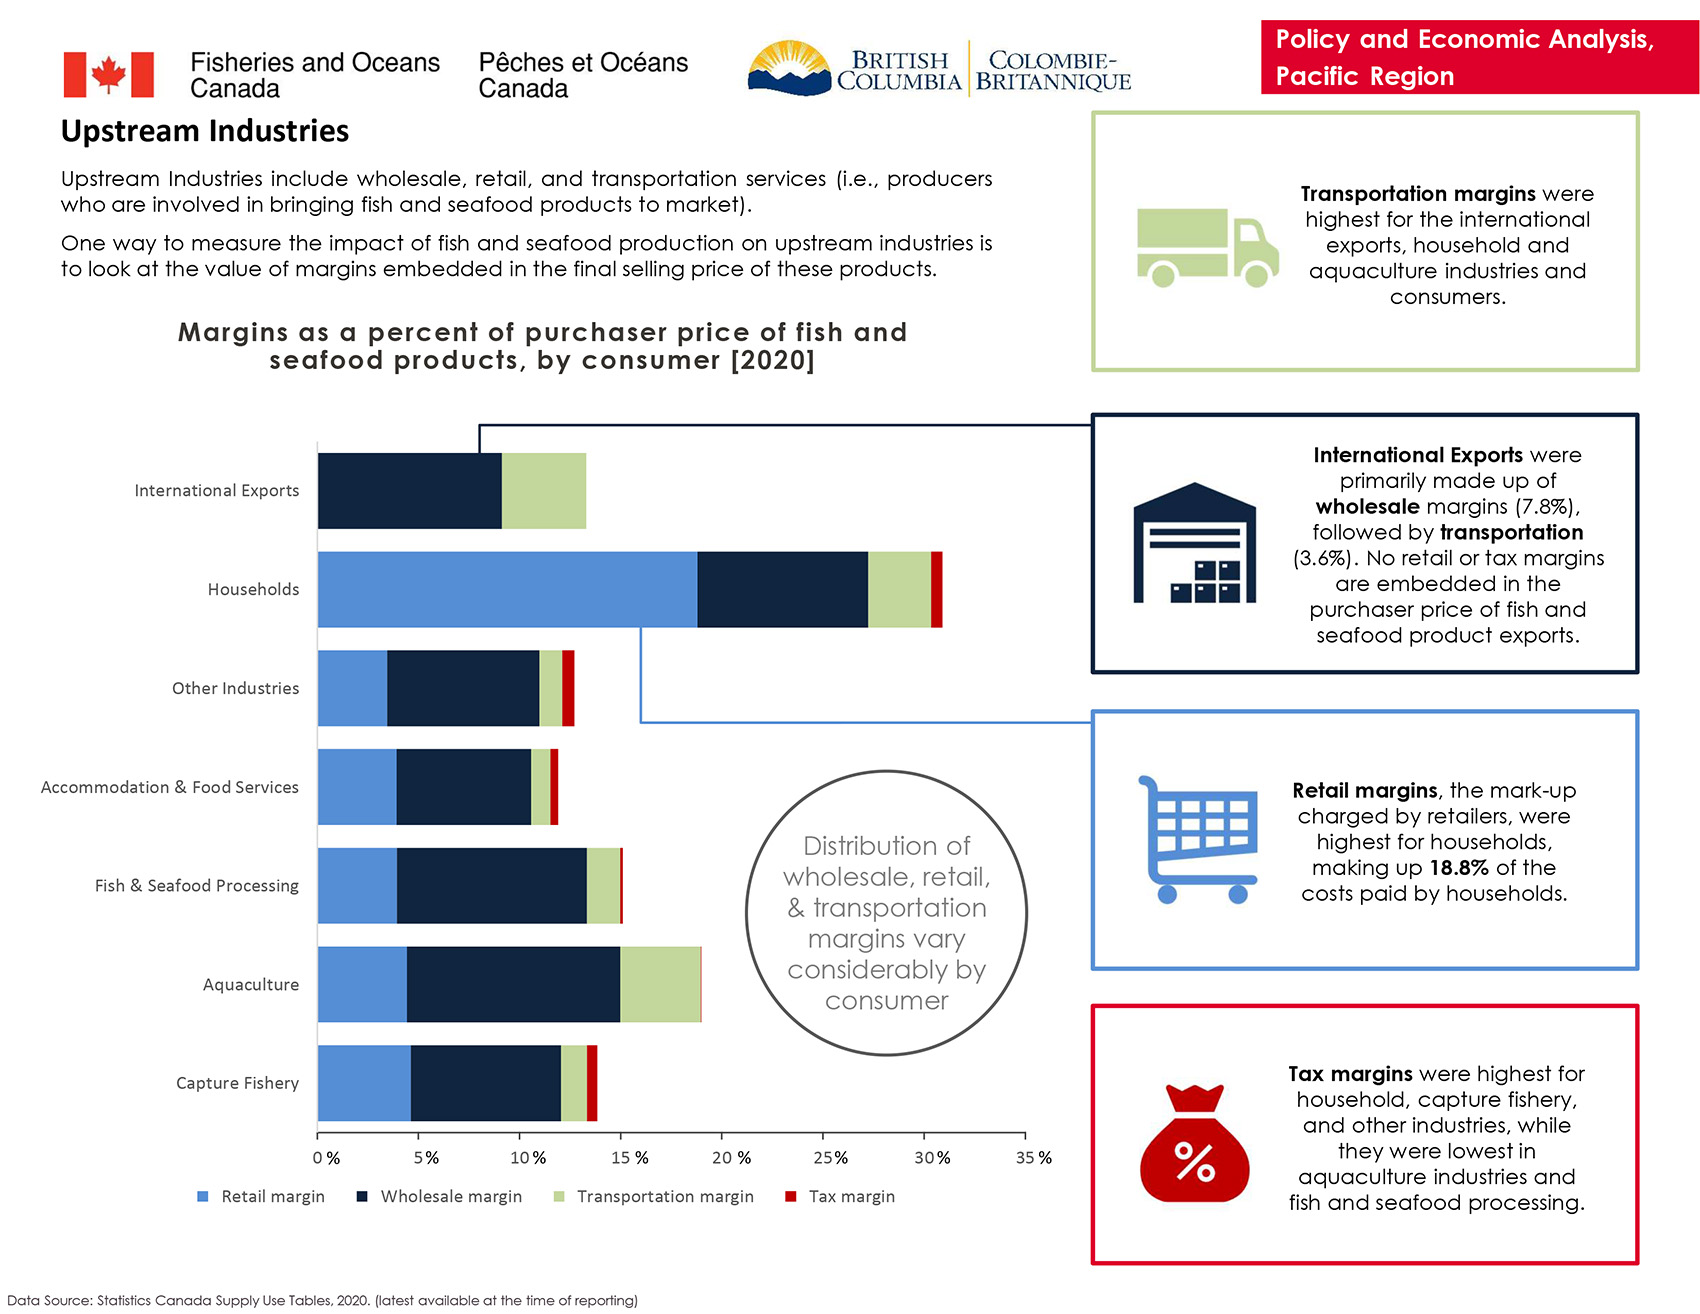
Upstream industries include wholesale, retail, and transportation services (i.e., producers who are involved in bringing fish and seafood products to market).
One way to measure the impact of fish and seafood production on upstream industries is to look at the value of margins embedded in the final selling price of these products.
Margins as a percent of purchaser prices of fish and seafood products, by consumer [2020]:
International exports
- 9.1% wholesale margin
- 4.2% transportation margin
Households
- 18.8% retail margin
- 8.4% wholesale margin
- 3.1% transportation margin
- 0.6% tax margin
Other industries
- 3.5% retail margin
- 7.5% wholesale margin
- 1.1% transportation margin
- 0.6% tax margin
Accommodation and food services
- 3.9% retail margin
- 6.6% wholesale margin
- 0.9% transportation margin
- 0.4% tax margin
Fish and seafood processing
- 3.9% retail margin
- 9.4% wholesale margin
- 1.6% transportation margin
- 0.1% tax margin
Aquaculture
- 4.4% retail margin
- 10.5% wholesale margin
- 4.0% transportation margin
- 0.01% tax margin
Capture fishery
- 4.6% retail margin
- 7.4% wholesale margin
- 1.3% transportation margin
- 0.5% tax margin
Transportation margins were highest for the international exports, household and aquaculture industries and consumers.
International exports were primarily made up of wholesale margins (7.8%), followed by transportation (3.6%). No retail or tax margins are embedded in the purchaser price of fish and seafood product exports.
Retail margins, the mark-up charged by retailers, were highest for households, making up 18.8% of the costs paid by households.
Tax margins were highest for household, capture fishery, and other industries, while they were lowest in aquaculture industries and fish and seafood processing.
Notes:
Data Source: Statistics Canada Supply Use Tables, 2020 (latest available at the time of reporting).
Page details
- Date modified: