
All Pacific commercial fisheries
This profile provides a sector-wide overview of the economic contributions of Pacific commercial wild-capture fisheries, drawing primarily on data from DFO logbooks, sale slips, surveys, and public reports and data.
Long text version
2023 Economic Profile of all BC Commercial Fisheries
The commercial fisheries targets over 90 species across 19 commercial fisheries, using a range of gear types, harvest control rules and geographic areas.
Key metrics (values are in 2023 dollars)
(The up and down arrows denote year-over-year percentage change)
- Landed value ($452M), decreased by 10% since 2022
- Landings in kilograms (100M), decreased by 13% since 2022
- Value-added from processing ($531M2), decreased by 28% since 2022
- Active vessels1 (1,063), decreased by 7% since 2022
- Licence eligibilities6 (6,893), decreased by 3% since 2022
- Wild exports ($819M, increased by 3% since 2022)
Landings and landed value by commercial fishery group
Landings (in kilograms)
Tuna
- 2013 - 5.1M KG
- 2014 - 4.8M KG
- 2015 - 4.4M KG
- 2016 - 2.8M KG
- 2017 - 1.8M KG
- 2018 - 2.7M KG
- 2019 - 2.4M KG
- 2020 - 2.4M KG
- 2021 - 2.4M KG
- 2022 - 3.6M KG
- 2023 - 1.1M KG
Salmon
- 2013 - 30M KG
- 2014 - 42M KG
- 2015 - 20M KG
- 2016 - 26M KG
- 2017 - 15M KG
- 2018 - 17M KG
- 2019 - 5M KG
- 2020 - 8M KG
- 2021 - 4M KG
- 2022 - 8M KG
- 2023 - 7M KG
Herring
- 2013 - 19M KG
- 2014 - 23M KG
- 2015 - 20M KG
- 2016 - 26M KG
- 2017 - 28M KG
- 2018 - 16M KG
- 2019 - 19M KG
- 2020 - 11M KG
- 2021 - 14M KG
- 2022 - 5M KG
- 2023 - 6M KG
Shellfish
- 2013 - 13M KG
- 2014 - 13M KG
- 2015 - 18M KG
- 2016 - 15M KG
- 2017 - 12M KG
- 2018 - 13M KG
- 2019 - 18M KG
- 2020 - 17M KG
- 2021 - 18M KG
- 2022 - 16M KG
- 2023 - 14M KG
Groundfish
- 2013 - 98M KG
- 2014 - 86M KG
- 2015 - 88M KG
- 2016 - 120M KG
- 2017 - 130M KG
- 2018 - 142M KG
- 2019 - 139M KG
- 2020 - 135M KG
- 2021 - 107M KG
- 2022 - 83M KG
- 2023 - 71M KG
Landed value (in 2023 dollars)
Tuna
- 2013 - $30M
- 2014 - $19M
- 2015 - $18M
- 2016 - $25M
- 2017 - $20M
- 2018 - $18M
- 2019 - $14M
- 2020 - $12M
- 2021 - $20M
- 2022 - $31M
- 2023 - $6M
Salmon
- 2013 - $51M
- 2014 - $150M
- 2015 - $58M
- 2016 - $90M
- 2017 - $65M
- 2018 - $111M
- 2019 - $22M
- 2020 - $25M
- 2021 - $24M
- 2022 - $41M
- 2023 - $23M
Herring
- 2013 - $10M
- 2014 - $15M
- 2015 - $14M
- 2016 - $21M
- 2017 - $23M
- 2018 - $17M
- 2019 - $18M
- 2020 - $10M
- 2021 - $9M
- 2022 - $2M
- 2023 - $4M
Shellfish
- 2013 - $154M
- 2014 - $168M
- 2015 - $172M
- 2016 - $140M
- 2017 - $174M
- 2018 - $217M
- 2019 - $243M
- 2020 - $205M
- 2021 - $298M
- 2022 - $258M
- 2023 - $268M
Groundfish
- 2013 - $155M
- 2014 - $149M
- 2015 - $185M
- 2016 - $192M
- 2017 - $228M
- 2018 - $202M
- 2019 - $183M
- 2020 - $140M
- 2021 - $164M
- 2022 - $168M
- 2023 - $148M
Value added
In 2023, $531M in value-added wild processing and wholesale was generated by 198 processing plants coastwide. 114 of those were in the Lower Mainland and 45 were in Southern Vancouver Island.
Licence valuation3
Licence values vary widely across fisheries, from 20K (schedule II) to $1.5M (sea cucumber and crab). For some fisheries, there are additional quota costs, varying from $1.5M (groundfish trawl) to $9.3M (geoduck).
Economic contribution4
Commercial fisheries contributed $548M (GDP) to the provincial economy, with a total employment and income contribution of 7,200 and $354M, respectively.
Export of wild harvest by fishery group (2023)
Export quantity (in kilograms)
- Groundfish - 30M KG
- Herring - 4.5M KG
- Salmon - 8M KG
- Shellfish (non-dive) - 17M KG
- Shellfish (dive) - 1.0M KG
- Tuna 1.5M - KG
- Other 21M - KG
Export value (in 2023 dollars)
- Groundfish - $152M
- Herring - $23M
- Salmon - $119M
- Shellfish (non-dive) - $364M
- Shellfish (dive) - $43M
- Tuna - $27M
- Other - $92M
Exports: main markets are the United States (35%), China (32%), Lithuania (8%), and Japan (6%). Percentages are of total volume.
On average, over half of active commercial fishing vessels participate in a single fishery, while the rest diversify into multiple fisheries.
More diversified fisheries:
- Sablefish
- Rockfish
- Green sea urchin
- Red sea urchin
- Sea cucumber
- Shrimp trawl
- Tuna
- Salmon troll
- Halibut
Less diversified fisheries:
- Salmon gillnet
- Salmon seine
- Groundfish trawl
- Geoduck
- Crab
- Prawn
Fishery diversification for active vessels5 (2019-2022)
- One fishery 56%
- Two fisheries 23%
- Three fisheries 11%
- More than three fisheries 10%
Footnotes
- All values are from 2023 compared to 2022 in 2023-dollars by calendar year, unless otherwise specified.
- 1Active vessel count does not include herring vessels due to the party-based characteristic of fishery
- 2 inclusive of imports and domestic production. Domestic only value-added was $278M in 2023.
- 3Both licence value and quota value are averaged by licence.
- 4Economic contribution includes both harvesting and processing sectors.
- 5Active vessel refers to vessel that is active in at least one fishery. Diversified vessels can be active in the only fishery
- 6Licence eligibilities represents the number of issued licences.
Long text version
2023 Economic Profile of all commercial fisheries
Commercial Fisheries Economic Summary
Note this package includes all Pacific Commercial Fisheries with significant economic activity, as such, it currently excludes smaller fisheries such as: Eulachon, Euphausiid, Sardine, and Scallop by Trawl.
All values are from 2023 compared to 2022 in 2023-dollars by calendar year, unless otherwise specified.
2023 data and dollar values are considered preliminary and subject to change.
Key Commercial Fisheries Summary Table:
Clam
- Landed Value: $1.7M (Down 11% since 2022)
- Landed KG: 265K KG (Down 18% since 2022)
- Wholesale Value: $12.2M (Up 29% since 2022)
- Active Vessels: Not Applicable
- Licence Eligibilities: 718 (No Change since 2022)
- Licence Values: Not Applicable
Crab
- Landed Value: $113M (Down 4% since 2022)
- Landed KG: 7.2M KG (Down 19% since 2022)
- Wholesale Value: $224M (Up 8% since 2022)
- Active Vessels: 211 (Down 2% since 2022)
- Licence Eligibilities: 2161 (No Change since 2022)
- Licence Values: $1.5M (No Change since 2022)
Geoduck
- Landed Value: $65M2 (Up 13% since 2022)
- Landed KG: 1.3M KG3 (Down 2% since 2022)
- Wholesale Value: $71.2M (Up 15% since 2022)
- Active Vessels: 30 (Down 1% since 2022)
- Licence Eligibilities: 55 (No Change since 2022)
- Licence Values: $285K4 (Up 14% since 2022)
Green Sea Urchin
- Landed Value: $1.8M (Up 19% since 2022)
- Landed KG: 292K3 (No Change since 2022)
- Wholesale Value: $3.0M (down 5% since 2022)
- Active Vessels: 205 (Up 11% since 2022)
- Licence Eligibilities: 49 (No Change since 2022)
- Licence Values: $120K (Up 50% since 2022)
Groundfish: Trawl
- Landed Value: $59.2M (Down 13% since 2022)
- Landed KG: 62.8M KG (Down 16% since 2022)
- Wholesale Value: $75.1M (down 31% since 2022)
- Active Vessels: 41 (No Change since 2022)
- Licence Eligibilities: 139 (No Change since 2022)
- Licence Values: $41.0K (No Change since 2022)
Groundfish: Sablefish
- Landed Value: $25.5M (Down 13% since 2022)
- Landed KG: 3.3M KG (Up 13% since 2022)
- Wholesale Value: Not Applicable6
- Active Vessels: 41 (Up 2.5% since 2022)
- Licence Eligibilities: 48 (No Change since 2022)
- Licence Values: $525.0K (No Change since 2022)
Groundfish: Halibut
- Landed Value: $54.9M (Down 13% since 2022)
- Landed KG: 3.9M KG (Down 6% since 2022)
- Wholesale Value: $156.9M (Up 58% since 2022)
- Active Vessels: 139 (Down 8% since 2022)
- Licence Eligibilities: 433 (Up 1% since 2022)
- Licence Values: $32.7K (Up 0.25% since 2022)
Groundfish: Rockfish
- Landed Value: $2.6M (Up 2% since 2022)
- Landed KG: 0.3M KG (Up 4% since 2022)
- Wholesale Value: $23.5M (Down 31% since 2022)
- Active Vessels: 67 (Down 1% since 2022)
- Licence Eligibilities: 261 (Up 6% since 2022)
- Licence Values: Inside: $37.5K. Outside: $224K (No Change since 2022)
Groundfish: Schedule II
- Landed Value: $5.4M (Up 23% since 2022)
- Landed KG: 0.8M KG (Up 37% since 2022)
- Wholesale Value: $12.7M (Up 4% since 2022)
- Active Vessels: 67 (Down 1% since 2022)
- Licence Eligibilities: 307 (Down 4% since 2022)
- Licence Values: No licence7
Herring
- Landed Value: $3.7M (Up 94% since 2022)
- Landed KG: 6.2M KG (Up 29% since 2022)
- Wholesale Value: $9.7M (Up 77% since 2022)
- Active Vessels: Not Applicable
- Licence Eligibilities: 1,751 (Up 11% since 2022)
- Licence Values: Herring Gillnet: $37.0K. Herring Seine: $107.5K (No Change since 2022)
Oyster
- Landed Value: $592K (Undetermined change)
- Landed KG: 53.5K KG (Up 20% since 2022)
- Wholesale Value: Not Applicable
- Active Vessels: Not Applicable
- Licence Eligibilities: 65 (No Change since 2022)
- Licence Values: $22.0K (Undetermined change)
Prawn
- Landed Value: $73.1K (Up 9% since 2022)
- Landed KG: 1.6M KG (Down 0.7% since 2022)
- Wholesale Value: $74.9M (Down 16% since 2022)
- Active Vessels: 196 (Down 2% since 2022)
- Licence Eligibilities: 246 (Down 0.4% since 2022)
- Licence Values: $1.15M (Up 35% since 2022)
Long text version
Commercial Fisheries Economic Summary…Continued
Salmon
- Landed Value: $23.0M (Down 45% since 2022)
- Landed KG: 7.1M KG (Down 10% since 2022)
- Wholesale Value: $37.5M (Down 41% since 2022)
- Active Vessels: 448 (Down 8% since 2022)
- Licence Eligibilities: 1,637 (Down 15% since 2022)
- Licence Values: See BC Salmon Profile
Yukon River Salmon
- Landed Value: $0.0M (No Change since 2022)
- Landed KG: 0.0M KG (No Change since 2022)
- Wholesale Value: $0.0M (No Change since 2022)
- Active Vessels: Not Applicable
- Licence Eligibilities: Not Applicable
- Licence Values: Not Applicable
Sea Cucumber
- Landed Value: $8.5M (Down 6% since 2022)
- Landed KG: 1.7M KG (No Change since 2022)
- Wholesale Value: $16M (Up 35% since 2022)
- Active Vessels: 31 (Down 6% since 2022)
- Licence Eligibilities: 85 (No Change since 2022)
- Licence Values: $1.6M (Up 7% since 2022)
Shrimp Trawl
- Landed Value: $504K (Down 59% since 2022)
- Landed KG: 61K (Down 48% since 2022)
- Wholesale Value: $1.3M (Down 33% since 2022)
- Active Vessels: 15 (Down 32% since 2022)
- Licence Eligibilities: 230 (Down 2% since 2022)
- Licence Values: $42.0K (No Change since 2022)
Tuna
- Landed Value: $4.0M (Down 84% since 2022)
- Landed KG: 1.1M KG (Down 69% since 2022)
- Wholesale Value: $33M (Down 50% since 2022)
- Active Vessels: 79 (Down 33% since 2022)
- Licence Eligibilities: 1618 (Down 39% since 2022)
- Licence Values: Not Applicable9
Red Sea Urchin
- Landed Value: $6.1M (Down 11% since 2022)
- Landed KG: 1.9M KG (Down 11% since 2022)
- Wholesale Value: $14.4M (Down 1% since 2022)
- Active Vessels: 3110 (Down 14% since 2022)
- Licence Eligibilities: 110 (No Change since 2022)
- Licence Values: $290K (Down 11% since 2022)
Footnotes:
- All values are from 2023 compared to 2022 in 2023-dollars by calendar year, unless otherwise specified.
- 2023 data and dollar values are considered preliminary and subject to change.
- *Licence eligibilities represents the number of issued licences.
- 1 Total eligible licences. This total excludes retired licences but are still within DFO’s inventory.
- 2 Landed value is calculated from fisheries manager landings multiplied by the 2023 price survey value in the absence of complete logbook data and is considered preliminary.
- 3 Landings are by Fishing season to more accurately represent fishery landings.
- 4 Licence value is the value without quota which is generally considered more valuable at $925 a block.
- 5 Active vessels are from 2022 and compared to 2021 due to incomplete 2023 data.
- 6 Wholesale value is not available due to incomplete data.
- 7 Schedule II is managed by quota.
- 8 The USA 68 fishing licences were not issued in 2023 due to the expiration of the most recent fishing regime, with details for the 2024 season pending negotiations for a new regime.
- 9 The CT licence is available to holders of any vessel based commercial or communal commercial licence with a Schedule II privileges (C licence) therefore there is no direct value associated with the licence and this metric has been omitted from the report.
- 10 Active vessels are from 2022 and compared to 2021 due to incomplete 2023 logbook data.
Long text version
Fleet Revenue and Diversification
2019-2022 Pacific Fisheries: Fleet Revenue and Diversification
Pelagic
Tuna - licence prefix CT
- Average landed value per active vessel: $160,000
- Number of commercial licences: 255
- Number of communal commercial licences: 0
- Tuna: 19%
- Halibut: 29%
- Sablefish: 23%
- Prawn: 11%
- Others: 18%
Shellfish
Crab - licence prefix R
- Average landed value per active vessel: $574,000
- Number of commercial licences: 187
- Number of communal commercial licences: 34
- Crab: 97%
- Prawn: 2%
- Halibut: 1%
Red sea urchin - licence prefix ZC
- Average landed value per active vessel: $157,000
- Number of commercial licences: 80
- Number of communal commercial licences: 30
- Red sea urchin: 35%
- Sea cucumber: 38%
- Geoduck: 19%
- Green sea urchin: 5%
- Others: 3%
Green sea urchin - licence prefix ZA
- Average landed value per active vessel: $75,000
- Number of commercial licences: 48
- Number of communal commercial licences: 1
- Green sea urchin: 13%
- Sea cucumber: 42%%
- Geoduck: 25%
- Red sea urchin: 19%
- Others: 1%
Shrimp - licence prefix S
- Average landed value per active vessel: $89,000
- Number of commercial licences: 207
- Number of communal commercial licences: 26
- Shrimp: 9%
- Groundfish trawl: 29%
- Prawn: 14%
- Halibut: 11%
- Others: 37%
Geoduck - licence prefix G
- Average landed value per active vessel: $1.4M
- Number of commercial licences: 50
- Number of communal commercial licences: 5
- Geoduck: 94%
- Sea cucumber: 5%
- Others: 1%
Sea cucumber - licence prefix ZD
- Average landed value per active vessel: $326,000
- Number of commercial licences: 83
- Number of communal commercial licences: 3
- Sea cucumber: 43%
- Geoduck: 36%
- Red sea urchin: 15%
- Green sea urchin: 4%
- Others: 3%
Prawn - licence prefix W
- Average landed value per active vessel: $203,000
- Number of commercial licences: 185
- Number of communal commercial licences: 62
- Prawn: 64%
- Halibut: 10%
- Tuna: 8%
- Crab: 5%
- Others: 13%
- Salmon
Gillnet - licence prefix AG
- Average landed value per active vessel: $20,000
- Number of commercial licences: 797
- Number of communal commercial licences: 334
- Gillnet: 26%
- Halibut: 26%
- Prawn: 20%
- Crab: 7%
- Others: 21%
Seine - licence prefix AS
- Average landed per active vessel: $89,000
- Number of commercial licences: 209
- Number of communal commercial licences: 67
- Seine: 23%
- Groundfish trawl: 33%
- Halibut: 31%
- Sablefish: 8%
- Others: 5%
Troll - licence prefix AT
- Average landed per active vessel: $63,000
- Number of commercial licences: 293
- Number of communal commercial licences: 92
- Troll: 23%
- Halibut: 37%
- Tuna: 16%
- Prawn: 11%
- Others: 13%
- Groundfish
Halibut - licence prefix L
- Average landed value per active vessel: $360,000
- Number of commercial licences: 340
- Number of communal commercial licences: 94
- Halibut: 44%
- Crab: 16%
- Sablefish: 11%
- Tuna: 9%
- Others: 20%
Rockfish - licence prefix ZN
- Average landed value per active vessel: $103,000
- Number of commercial licences: 210
- Number of communal commercial licences: 51
- Rockfish: 4%
- Halibut: 39%
- Sablefish: 19%
- Crab: 16%
- Others: 23%
Sablefish - licence prefix K
- Average landed value per active vessel: $730,000
- Number of commercial licences: 41
- Number of communal commercial licences: 7
- Sablefish: 55%
- Halibut: 31%
- Tuna: 6%
- Prawn: 3%
- Others: 5%
Groundfish trawl - licence prefix T
- Average landed value per active vessel: $1.5M
- Number of commercial licences: 135
- Number of communal commercial licences: 4
- Groundfish trawl: 84%
- Sablefish: 5%
- Halibut: 3%
- Tuna: 2%
- Others: 6%
Schedule II - licence prefix C
- Average landed value per active vessel: $65,000
- Number of commercial licences: 308
- Number of communal commercial licences: 14
- Schedule II: 1%
- Geoduck: 30%
- Sea cucumber: 29%
- Red sea urchin: 22%
- Others: 17%
Footnotes
- Average landed value in X per active vessel* - refers to the average landed value earned solely in the subject fishery per vessel that actively fished in the subject fishery.
- Average revenue streams per active vessel licensed in x** - refers to the average landed value earned across all diversified fisheries per active vessel that was licensed in the subject fishery, regardless if it fished in the subject fishery or not.
Long text version
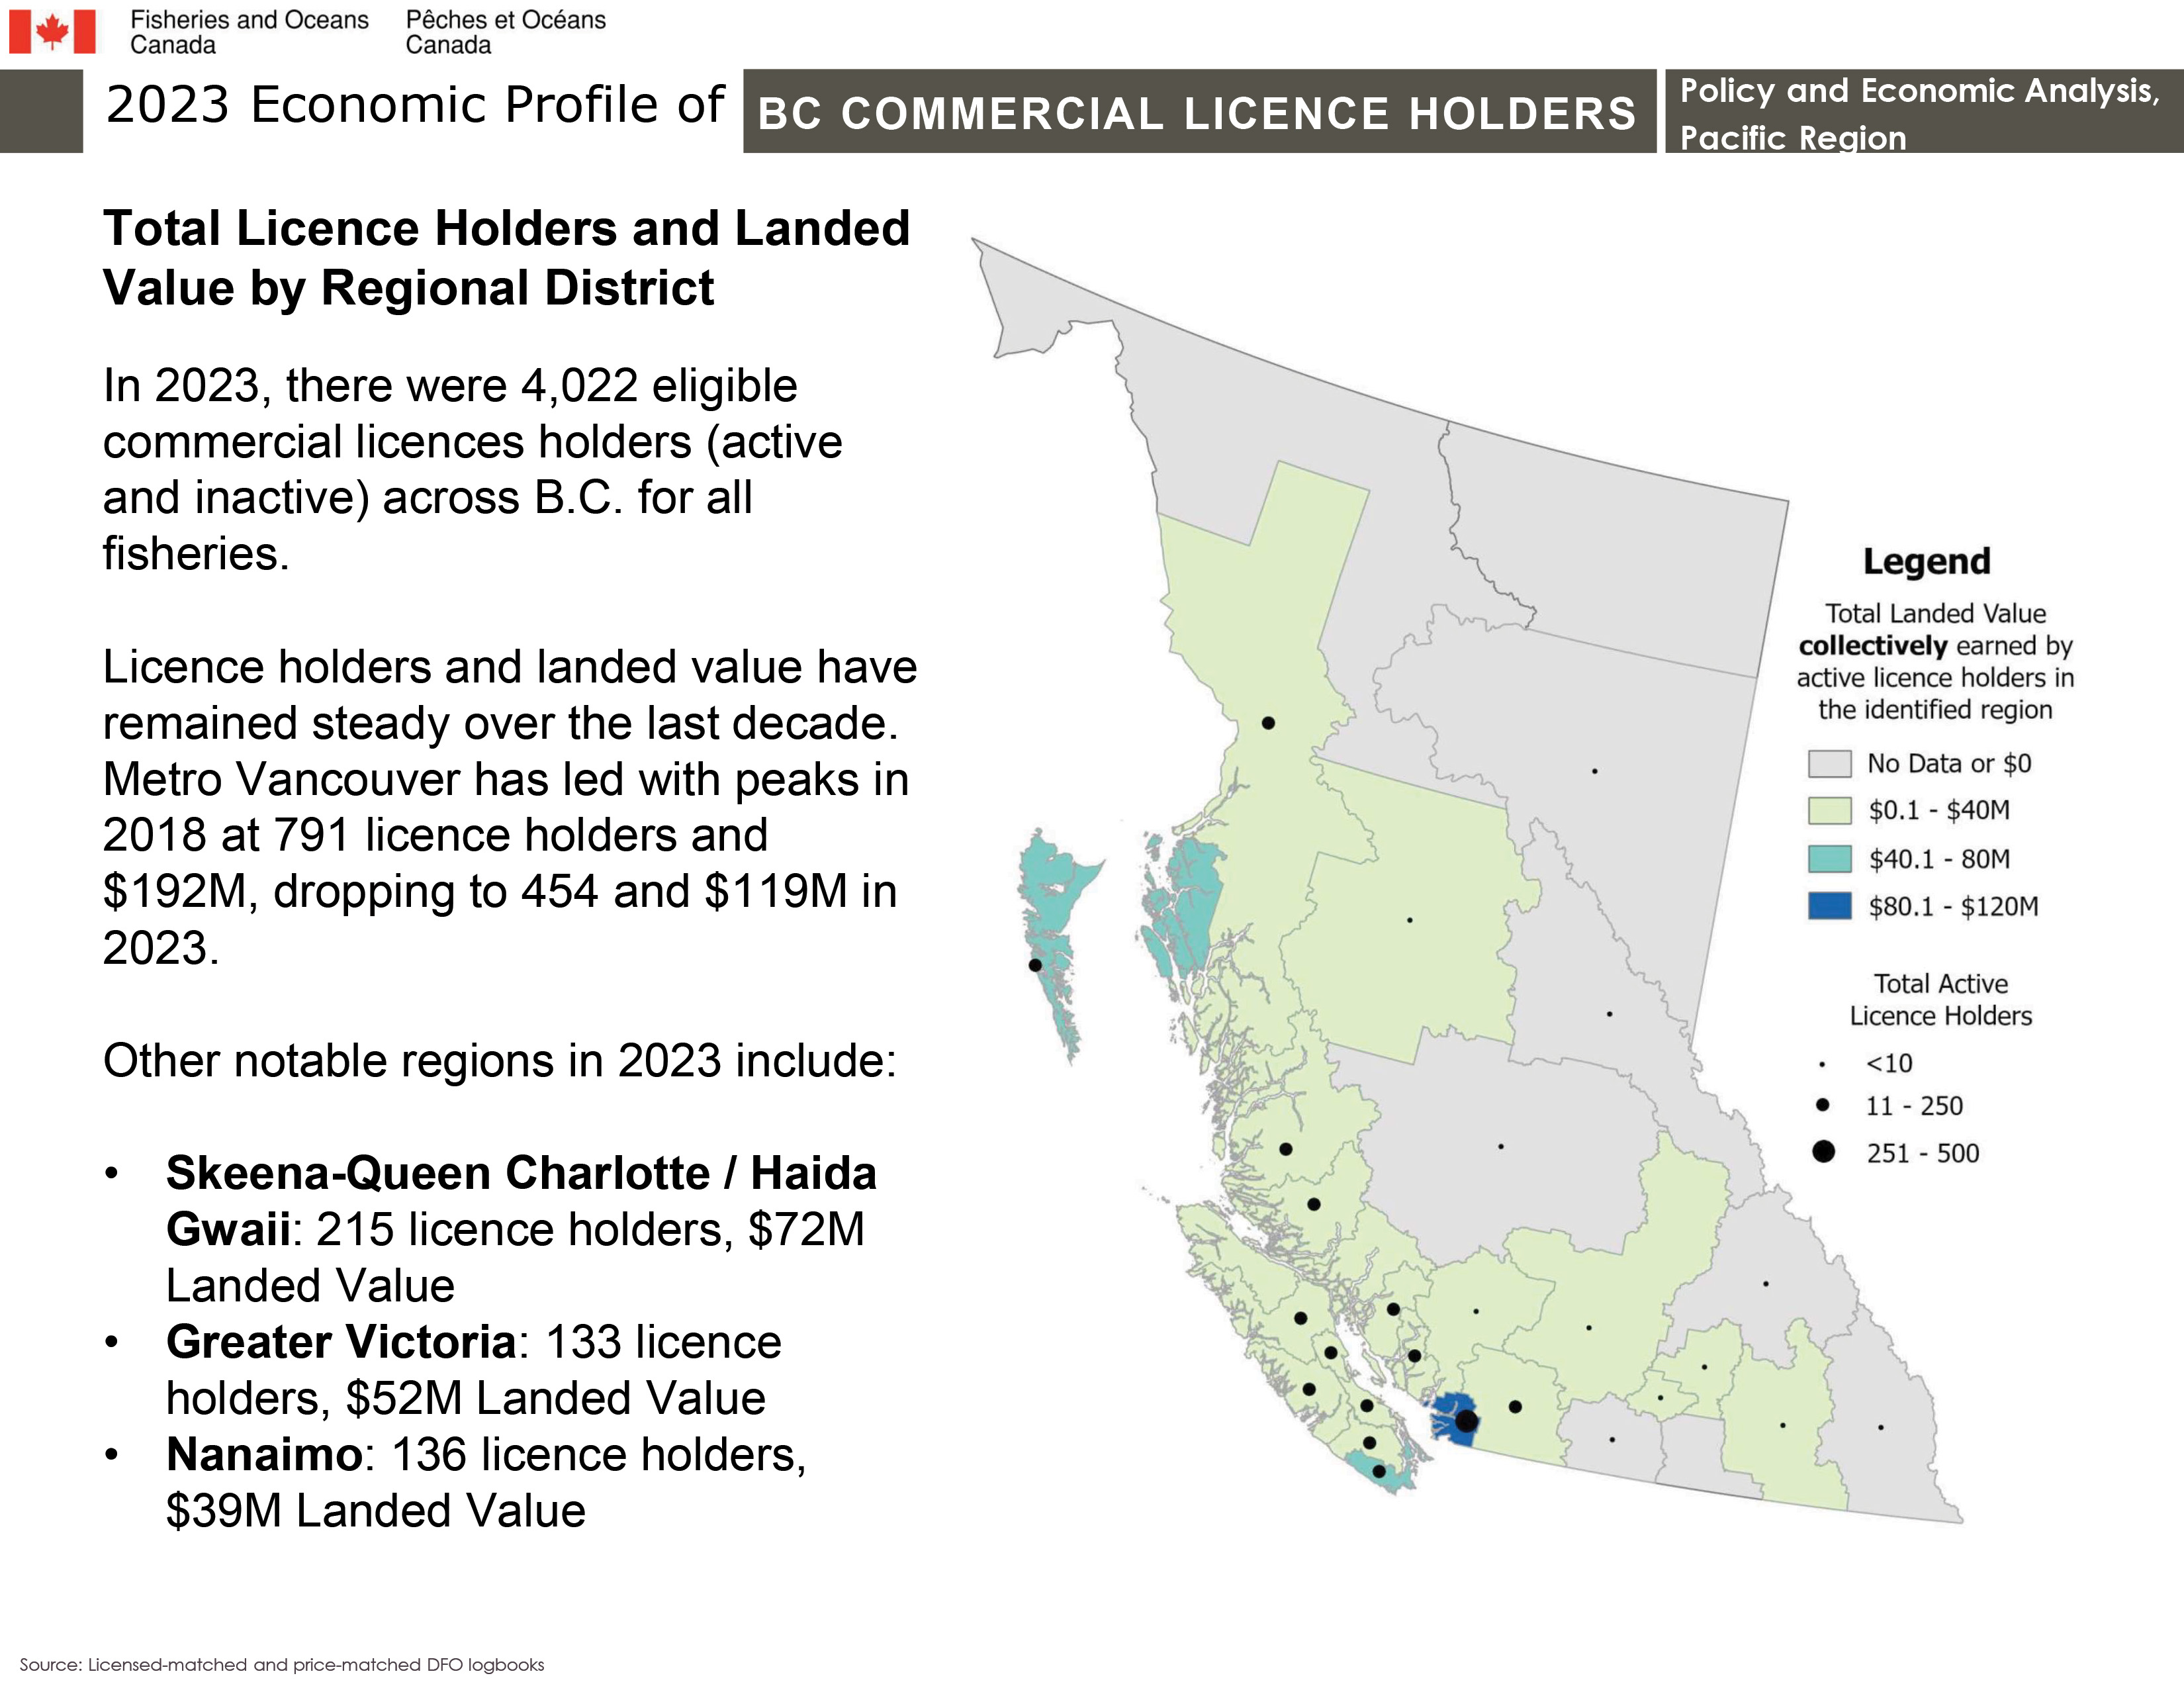
2023 Economic Profile of BC Commercial Licence Holders
Total Licence Holders and Landed Value by Regional District in 2023
In 2023, there were 4,022 eligible commercial licences holders (active and inactive) across B.C. for all fisheries.
Licence holders and landed value have remained steady over the last decade. Metro Vancouver has led with peaks in 2018 at 791 licence holders and $192M, dropping to 454 and $119M in 2023.
Other notable regions in 2023 include:
- Skeena-Queen Charlotte / Haida Gwaii: 215 licence holders, $72M Landed Value
- Greater Victoria: 133 licence holders, $52M Landed Value
- Nanaimo: 136 licence holders, $39 Landed Value
Map – Legend
- Total Landed Value
- No Data or $0
- $0.1 – $40M
- $40.1 – $80M
- $90.1 – 1$20M
- Total Licence Holders (Active & Inactive)
- <10
- 11 – 250
- 251 – 500
Source: Licensed-matched and price-matched DFO logbooks
- Date modified: