
Groundfish fishery
The following profile provides the socioeconomic context of the groundfish fishery in British Columbia. It includes an overview of the commercial and recreational sectors. This overview is based on data collected from DFO commercial harvest logbooks and sale slips, public reports, and DFO surveys on harvest prices and recreational fisheries.
Long text version
2023 Economic profile of the groundfish fishery
Commercial fisheries overview
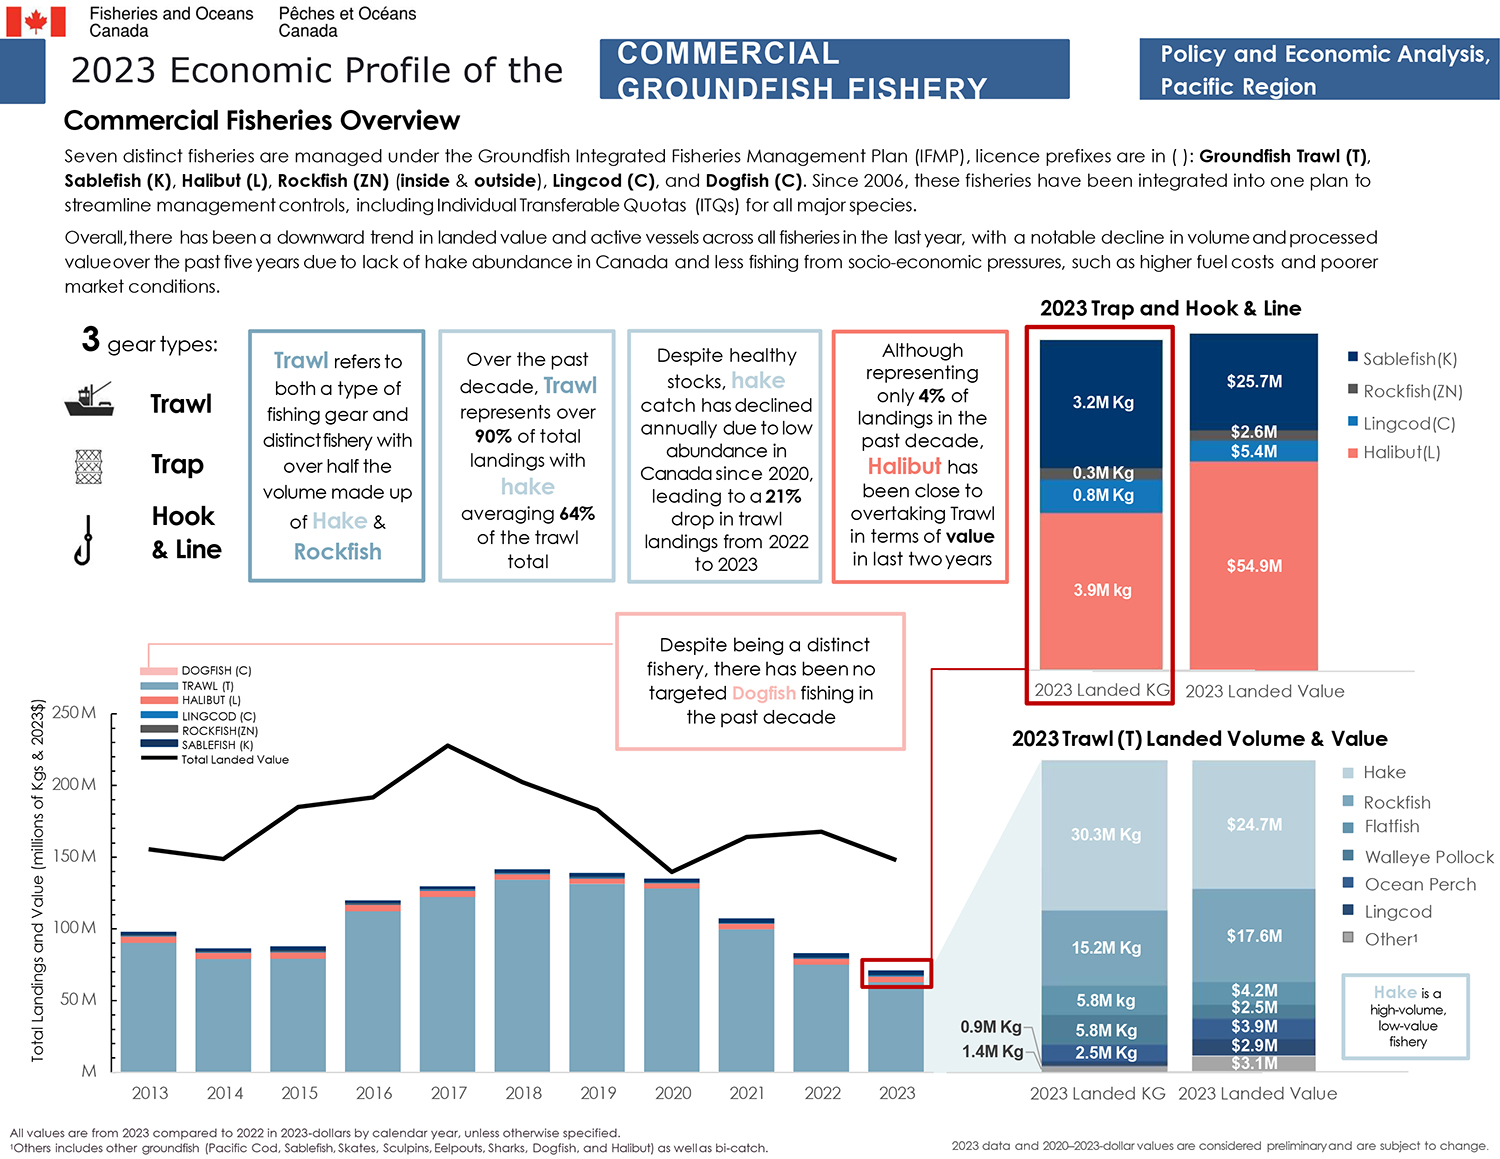
Seven distinct fisheries are managed under the Groundfish Integrated Fisheries Management Plan (IFMP), licence prefixes are in ( ): Groundfish Trawl (T), Sablefish (K), Halibut (L), Rockfish (ZN) (inside & outside), Lingcod (C), and Dogfish (C). Since 2006, these fisheries have been integrated into one plan to streamline management controls, including Individual Transferable Quotas (ITQs) for all major species.
Overall, there has been a downward trend in landed value and active vessels across all fisheries in the last year, with a notable decline in volume and processed value over the past five years due to lack of hake abundance in Canada and less fishing from socio-economic pressures, such as higher fuel costs and poorer market conditions.
There are 3 gear types in the groundfish fishery:
- Trawl
- Trap
- Hook and line
Trawl refers to both a type of fishing gear and distinct fishery with over half the volume made up of hake and rockfish.
Over the past decade, trawl represents over 90% of total landings with hake averaging 64% of the trawl total.
Despite healthy stocks, hake catch has declined annually due to low abundance in Canada since 2020, leading to a 21% drop in trawl landings from 2022 to 2023.
Although representing only 4% of landings in the past decade, halibut has been close to overtaking trawl in terms of value in last two years.
Despite being a distinct fishery, there has been no targeted dogfish fishing in the past decade.
Harvest by Fishery and Total Landed Value from 2013 to 2023 chart
Trawl
- 2013 – 89.7M kg
- 2014 – 78.8M kg
- 2015 – 78.8 M kg
- 2016 – 112.2M kg
- 2017 – 122.1M kg
- 2018 – 134.3M kg
- 2019 - 131.4M kg
- 2020 – 128.1M kg
- 2021 – 99.8M kg
- 2022 – 75.0M kg
- 2023 – 62.8M kg
Halibut
- 2013 – 4.4M kg
- 2014 – 4.3M kg
- 2015 – 4.4M kg
- 2016 – 4.3M kg
- 2017 – 4.4M kg
- 2018 – 3.8M kg
- 2019 – 4.0M kg
- 2020 – 3.6M kg
- 2021 – 3.8M kg
- 2022 – 4.2M kg
- 2023 – 3.9M kg
Lingcod
- 2013 – 0.4M kg
- 2014 – 0.4M kg
- 2015 – 0.6M kg
- 2016 – 0.6M kg
- 2017 – 0.7M kg
- 2018 – 0.7M kg
- 2019 – 0.6M kg
- 2020 – 0.4M kg
- 2021 – 0.5M kg
- 2022 – 0.6M kg
- 2023 – 0.8M kg
Rockfish
- 2013 – 0.6M kg
- 2014 – 0.6M kg
- 2015 – 0.7M kg
- 2016 – 0.5M kg
- 2017 – 0.4M kg
- 2018 – 0.4M kg
- 2019 – 0.4M kg
- 2020 – 0.2M kg
- 2021 – 0.3M kg
- 2022 – 0.3M kg
- 2023 – 0.3M kg
Sablefish
- 2013 – 2.2M kg
- 2014 – 2.0M kg
- 2015 – 2.8M kg
- 2016 – 2.1M kg
- 2017 – 2.0M kg
- 2018 – 2.5M kg
- 2019 – 2.7M kg
- 2020 – 2.5M kg
- 2021 – 3.0M kg
- 2022 – 2.9M kg
- 2023 – 3.2M kg
Total landed value
- 2013 - $155.5M
- 2014 - $148.6M
- 2015 – $185.0M
- 2016 - $192.0M
- 2017 – $228.0M
- 2018 - $202.3M
- 2019 - $183.0M
- 2020 - $139.7M
- 2021 – $164.0M
- 2022 - $167.6M
- 2023 - $147.8M
2023 Trap and Hook and Line
Landings (in kilograms)
- Sablefish - 3.2M kg
- Rockfish - 0.3M kg
- Lingcod - 0.8M kg
- Halibut - 3.9M kg
Landed value (in 2023$)
- Sablefish $25.7M
- Rockfish $2.6M
- Lingcod $5.4M
- Halibut $54.9M
2023 Trawl Landed volume and value by Species
Landings (in kilograms)
- Hake - 30.3M kg
- Rockfish - 15.2M kg
- Flatfish - 5.8M kg
- Walleye pollock - 5.8M kg
- Ocean perch - 2.5M kg
- Lingcod - 0.9M kg
- OtherFootnote 1 - 1.4M kg
Landed value (in 2023$)
- Hake - $24.7M
- Rockfish - $17.6M
- Flatfish - $4.2M
- Walleye pollock - $2.5M
- Ocean perch - $3.9M
- Lingcod - $2.9M
- OtherFootnote 2 - $3.1M
Hake is a high-volume, low-value fishery.
Footnotes
- All values are from 2023 compared to 2022 in 2023-dollars by calendar year, unless otherwise specified.
- 2023 data and 2020–2023-dollar values are considered preliminary and are subject to change.
Long text version
2023 Economic profile of the groundfish fishery
Export overview
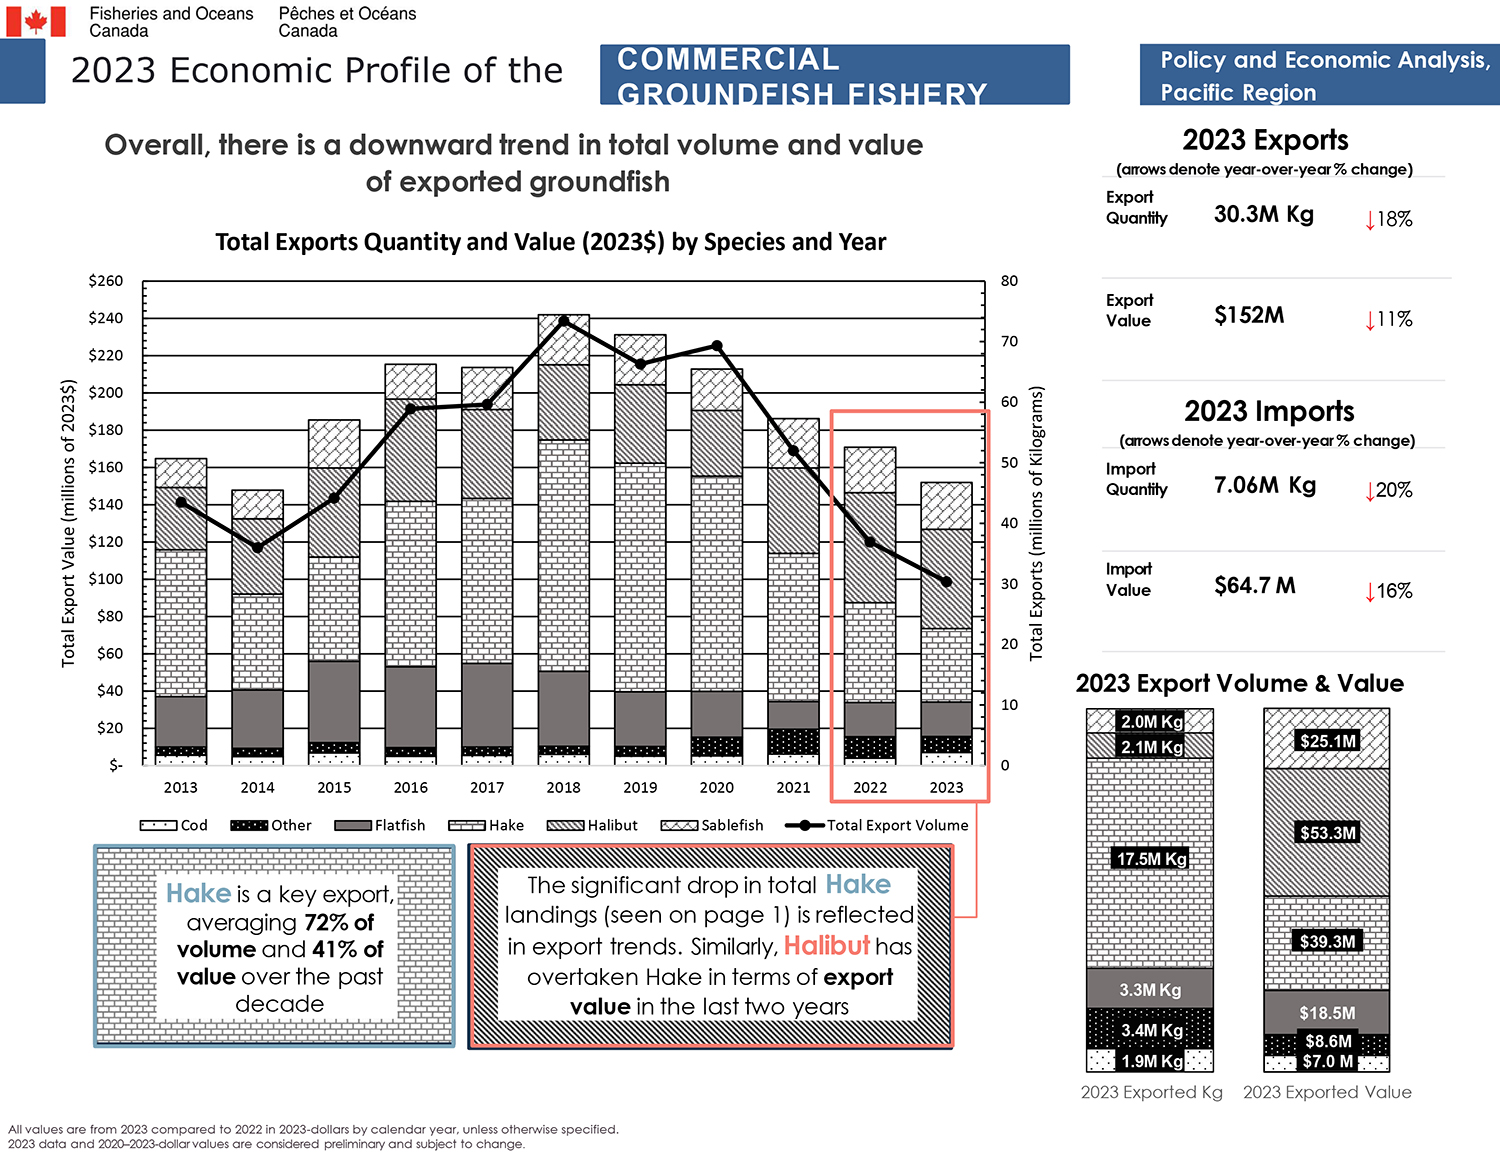
Overall, there is a downward trend in total volume and value of exported groundfish
Total exports quantity and value (2023$) by species and year
Cod
- 2013 - $5.52M
- 2014 - $4.83M
- 2015 - $6.79M
- 2016 – $5.0M
- 2017 - $6.0M
- 2018 - $6.0M
- 2019 - $5.0M
- 2020 - $5.0M
- 2021 - $6.0M
- 2022 - $4.0M
- 2023 - $7.0M
Flatfish
- 2013 - $27.0M
- 2014 - $31.3M
- 2015 - $43.5M
- 2016 - $43.0M
- 2017 - $45.0M
- 2018 - $40.0M
- 2019 - $29.0M
- 2020 - $25.0M
- 2021 - $15.0M
- 2022 - $18.0M
- 2023 - $18.5M
Hake
- 2013 - $78.8M
- 2014 - $51.45M
- 2015 - $56.0M
- 2016 - $89.0M
- 2017 - $89.0M
- 2018 - $124.0M
- 2019 - $123.0M
- 2020 - $116.0M
- 2021 - $80.0M
- 2022 - $54.0M
- 2023 - $39.0M
Halibut
- 2013 - $33.4M
- 2014 - $40.3M
- 2015 - $47.8M
- 2016 - $55.0M
- 2017 - $48.0M
- 2018 - $40.0M
- 2019 - $42.0M
- 2020 - $35.0M
- 2021 - $46.0M
- 2022 - $59.0M
- 2023 - $53.0M
Sablefish
- 2013 - $15.5M
- 2014 - $15.3M
- 2015 - $25.7M
- 2016 - $19.0M
- 2017 - $23.0M
- 2018 - $27.0M
- 2019 - $27.0M
- 2020 - $22.0M
- 2021 - $26.0M
- 2022 - $24.0M
- 2023 - $25.0M
Other
- 2013 - $4.4M
- 2014 - $4.4M
- 2015 - $5.5M
- 2016 - $5.0M
- 2017 - $4.0M
- 2018 - $4.0M
- 2019 - $5.0M
- 2020 - $10.0M
- 2021 - $14.0M
- 2022 - $12.0M
- 2023 - $8.6M
Total export volume
- 2013 – 43M kg
- 2014 – 36M kg
- 2015 – 44M kg
- 2016 – 59M kg
- 2017 – 50M kg
- 2018 – 73M kg
- 2019 – 66M kg
- 2020 – 69M kg
- 2021 – 52M kg
- 2022 – 37M kg
- 2023 – 30M kg
Hake is a key export, averaging 72% of volume and 41% of value over the past decade.
The significant drop in total hake landings (seen on page 1) is reflected in export trends. Similarly, halibut has overtaken hake in terms of export value in the last two years.
2023 Exports
- Export quantity 30.3M kilograms, decreased by 18% since 2022.
- Export value $152M, decreased by 11% since 2022.
2023 Imports
- Import quantity 7.06M kilograms, decreased by 20% since 2022.
- Import value $64.7M kilograms, decreased by 16% since 2022.
2023 export volume and value
Exported volume (in kilograms)
- Sablefish - 2.0M kg
- Halibut - 2.1M kg
- Hake - 17.5M kg
- Flatfish - 3.3M kg
- Cod - 1.9M kg
- Other - 3.4M kg
Exported value (2023$)
- Sablefish - $25.1M
- Halibut - $53.3M
- Hake - $39.3M
- Flatfish - $18.5M
- Cod - $7.0M
- Other - $8.6M
Footnotes
- All values are from 2023 compared to 2022 in 2023-dollars by calendar year, unless otherwise specified.
- 2023 data and 2020–2023-dollar values are considered preliminary and subject to change.
Long text version
2023 Economic profile of the groundfish fishery
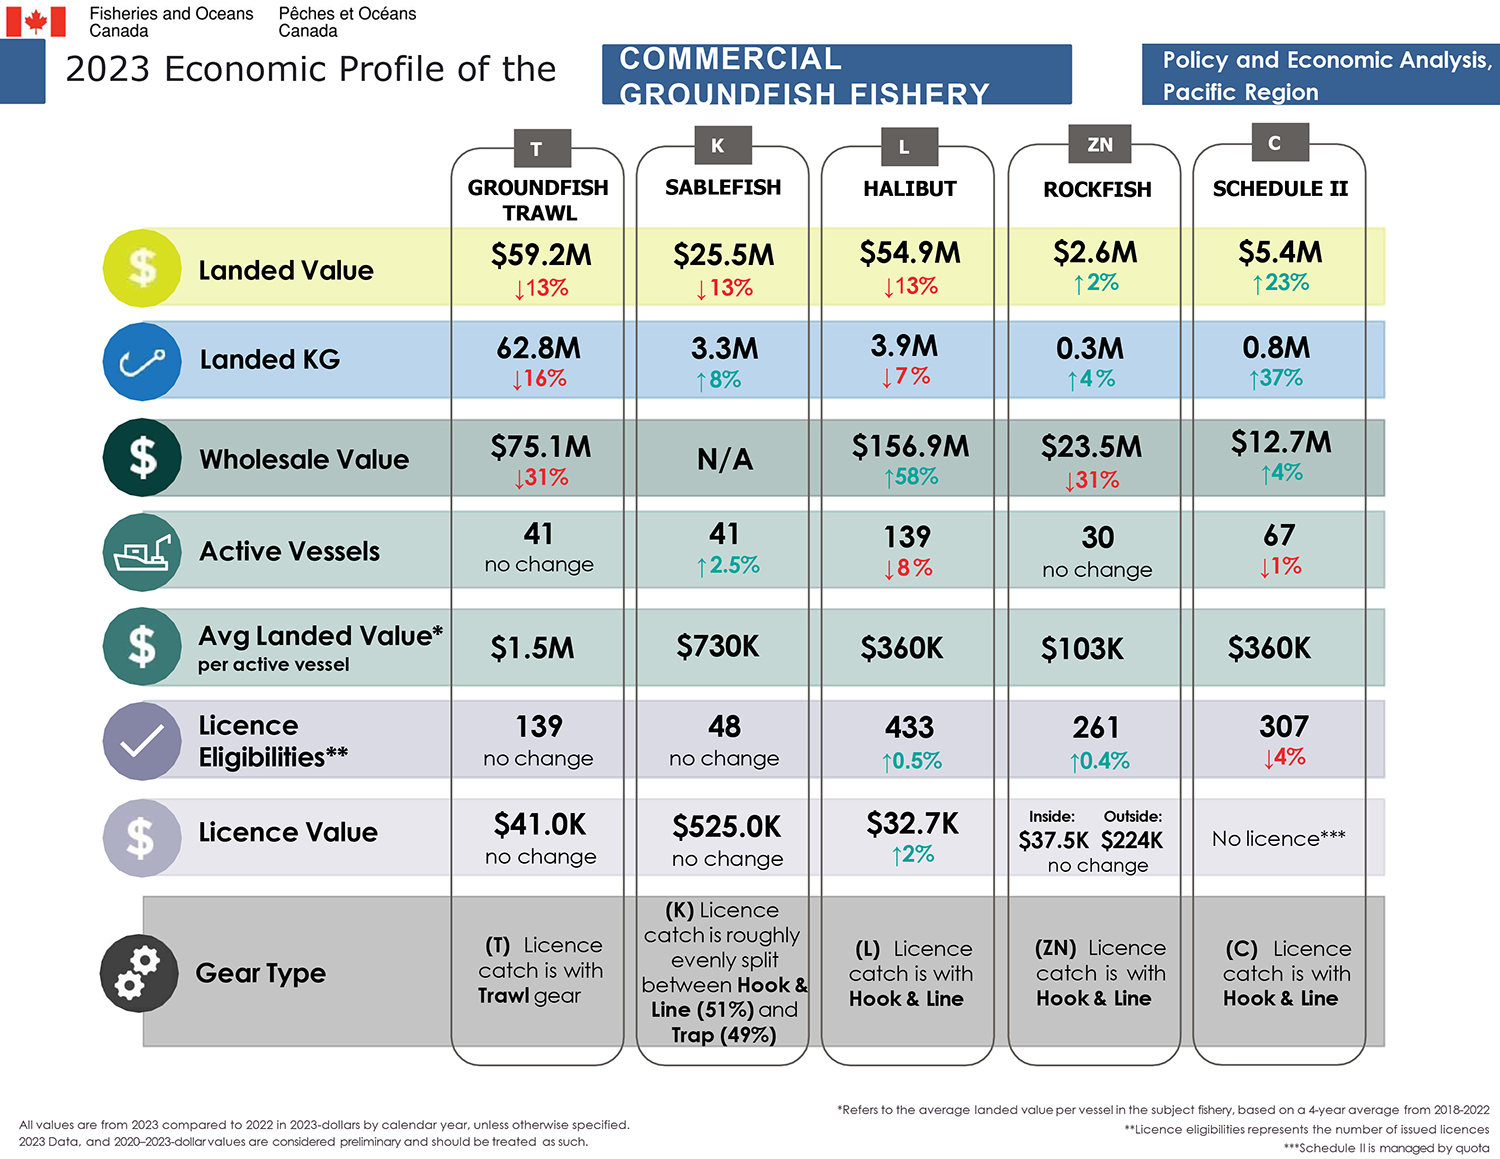
Key metrics by fishery
Groundfish trawl (licence prefix T)
- Landed value ($59.2M), decreased by 13% since 2022
- Landed kilogram (62.8M). decreased by 16% since 2022
- Wholesale value ($75.1M), decreased by 31% since 2022
- Active vessels (41), no change since 2022
- Average landed value per active vessel ($1.5M*)
- Licence eligibility (139), no change since 2022
- Licence value ($41.0K), no change since 2022
- Gear type: T licence catch is with trawl gear
Sablefish (licence prefix K)
- Landed value ($25.5M), decreased by 13% since 2022
- Landed kilogram (3.3M). increased by 8% since 2022
- Wholesale value: not available
- Active vessels (41), decreased by 2.5% since 2022
- Average landed value per active vessel ($730K)
- Licence eligibility (48), no change since 2022
- Licence value (525K), no change since 2022
- Gear type: K licence catch is roughly evenly split between hook & line (51%) and trap (49%)
Halibut (licence prefix L)
- Landed value ($54.9M), decreased by 13% since 2022
- Landed kilogram (3.9M). decreased by 7% since 2022
- Wholesale value ($156.9M), increased by 58% since 2022
- Active vessels (139), decreased by 8% since 2022
- Average landed value per active vessel ($360K*)
- Licence eligibility (433), increased by 0.5% since 2022
- Licence value ($32.7K), increased by 0.25% since 2022
- Gear type: L licence catch is with hook & line
Rockfish (licence prefix ZN)
- Landed value ($2.6M), increased by 2% since 2022
- Landed kilogram (0.3M). increased by 4% since 2022
- Wholesale value ($23.5M), decreased by 31% since 2022
- Active vessels (30), no change since 2022
- Average landed value per active vessel ($103K*)
- Licence eligibility (261), increased by 0.4% since 2022
- Licence value (inside $37.5K, outside $224K), no change since 2022
- Gear type: ZN licence catch is with hook & line
Schedule II (licence prefix C)
- Landed value ($5.4M), increased by 23% since 2022
- Landed kilogram (0.8M). increased by 37% since 2022
- Wholesale value ($12.7M), increased by 4% since 2022
- Active vessels (67), decreased by 1% since 2022
- Average landed value per active vessel ($360K*)
- Licence eligibility (307), decreased by 4% since 2022
- Licence value (no licence**)
- Gear type: C licence catch is with hook & line
Footnotes
- All values are from 2023 compared to 2022 in 2023-dollars by calendar year, unless otherwise specified.
- 2023 Data, and 2020–2023-dollar values are considered preliminary and should be treated as such.
- *Refers to the average landed value per vessel in the subject fishery, based on a 4-year average from 2018-2022.
- **Licence eligibilities represents the number of issued licences.
- ***Schedule II is managed by quota
Long text version
2023 Economic profile of the groundfish fishery
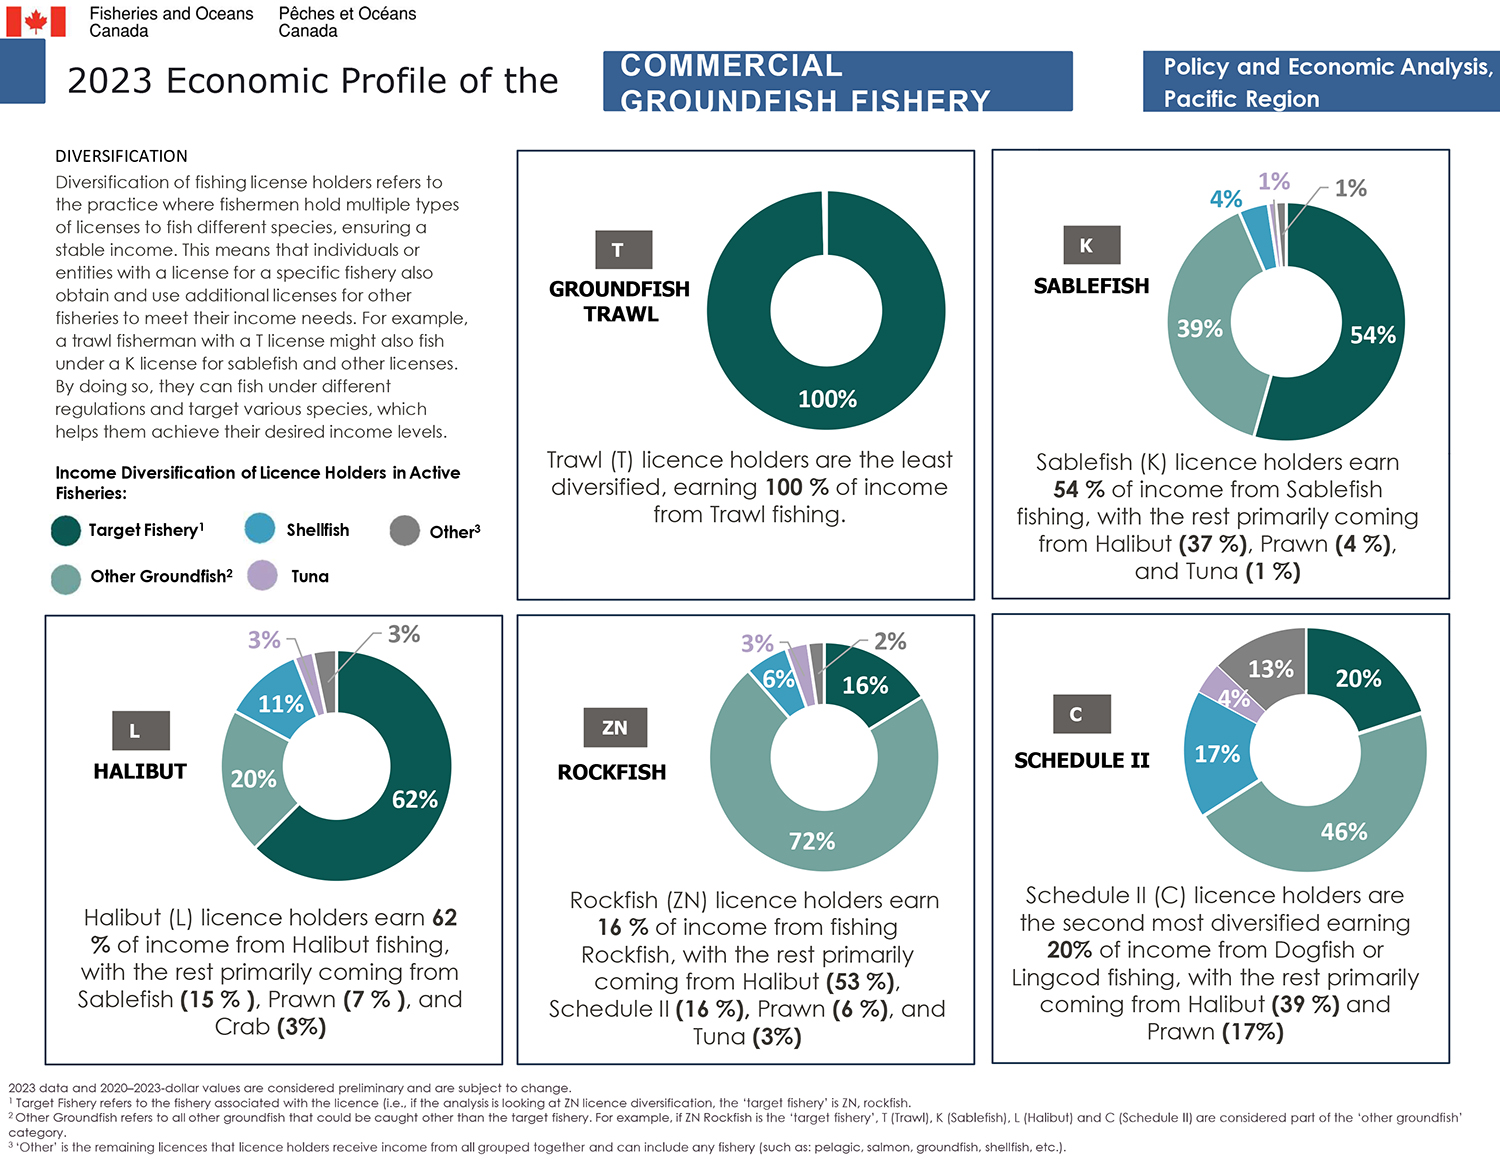
Diversification
Diversification of fishing license holders refers to the practice where fishermen hold multiple types of licenses to fish different species, ensuring a stable income. This means that individuals or entities with a license for a specific fishery also obtain and use additional licenses for other fisheries to meet their income needs. For example, a trawl fisherman with a T license might also fish under a K license for sablefish and other licenses. By doing so, they can fish under different regulations and target various species, which helps them achieve their desired income levels.
Income diversification of licence holders in active fisheries
- Target fishery Footnote 3
- Other groundfish Footnote 4
- Shellfish
- Tuna
- Other Footnote 5
Groundfish trawl
Trawl licence holders are the least diversified, earning 100% of income from trawl fishing.
- Groundfish trawl 100%
Sablefish
Sablefish licence holders earn 54% of income from sablefish fishing, with the rest primarily coming from halibut (37%), prawn (4%), and tuna (1%).
- Sablefish 54%
- Halibut 37%
- Prawn 4%
- Tuna 1%
- Other 1%
Halibut
Halibut licence holders earn 62% of income from halibut fishing, with the rest primarily coming from sablefish (15%), prawn (7%), and crab (3%).
- Halibut 62%
- Sablefish 15%
- Prawn 7%
- Crab 3%
- Other 3%
Rockfish
Rockfish licence holders earn 16% of income from fishing rockfish, with the rest primarily coming from halibut (53%), schedule II (16%), prawn (6%), and tuna (3%).
- Rockfish 16%
- Halibut 53%
- Schedule II 16%
- Prawn 6%
- Tuna 3%
- Other 2%
Schedule II
Schedule II licence holders are the second most diversified, earning 20% of income from dogfish or lingcod fishing, with the rest primarily coming from halibut (39%), and prawn (17%).
- Dogfish or lingcod 20%
- Halibut 39%
- Prawn 17%
- Tuna 4%
- Other 13%
Footnotes
- 2023 data and 2020–2023-dollar values are considered preliminary and are subject to change.
Long text version
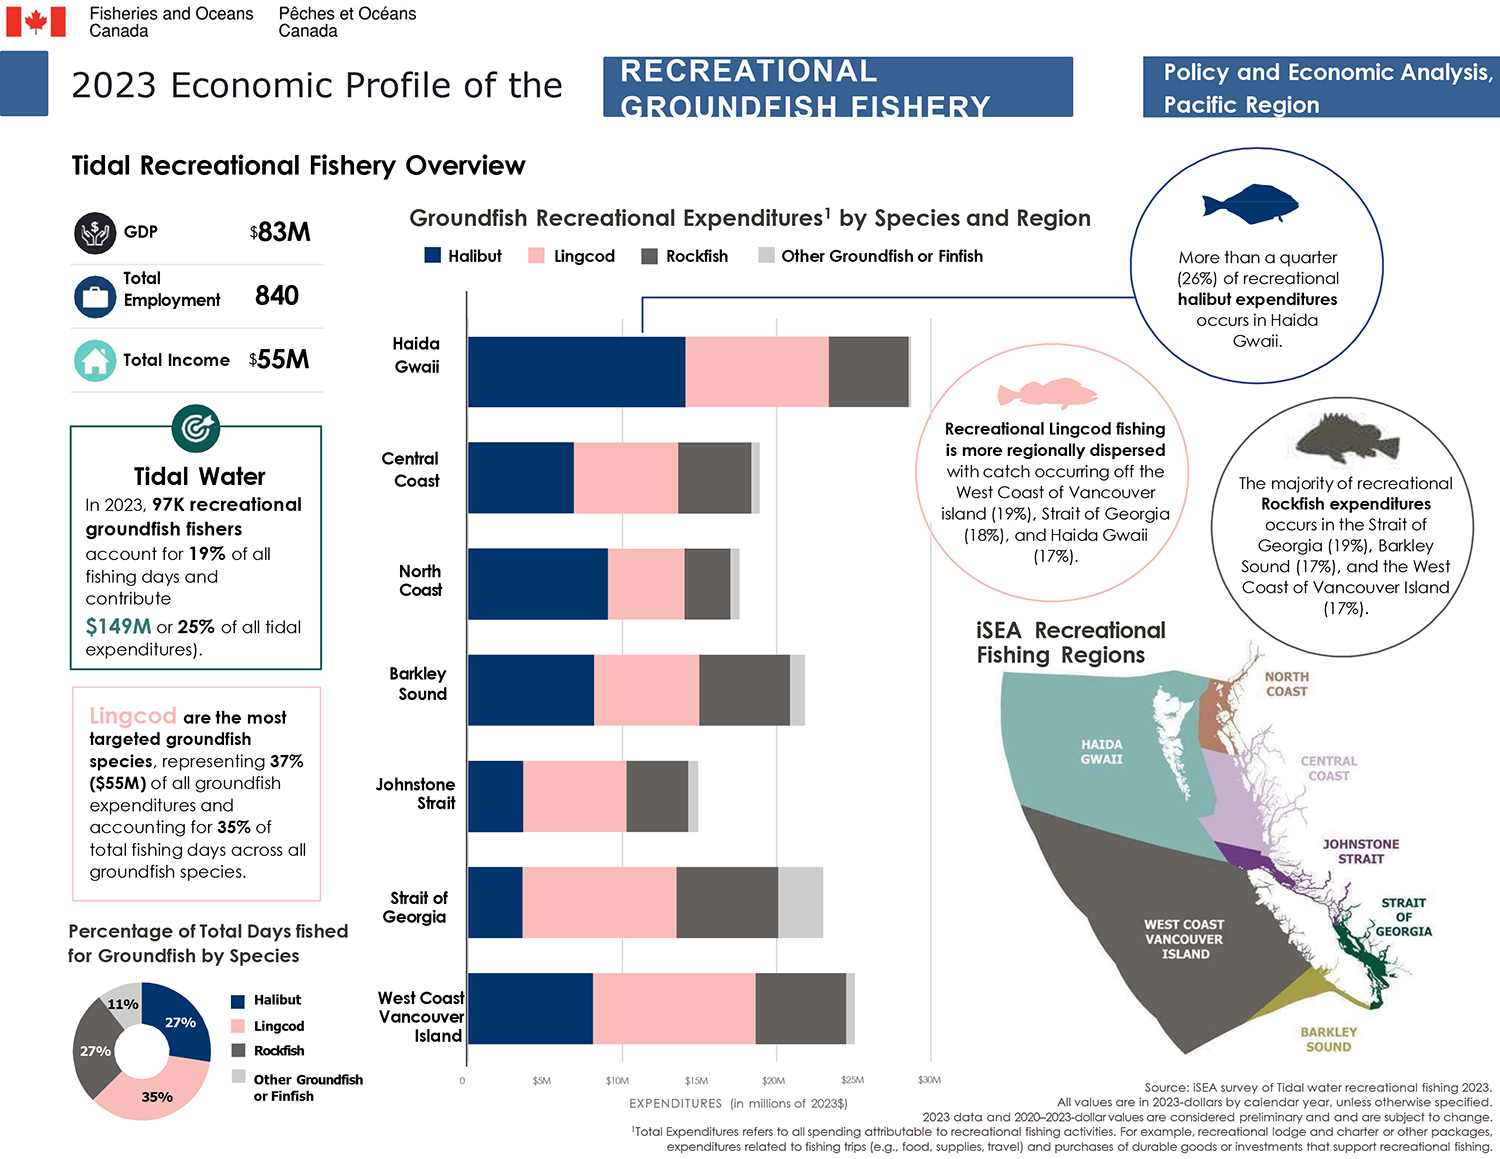
2023 Economic profile of the recreational groundfish fishery
Tidal recreational fishery overview
Key metrics
- Gross domestic product ($83M)
- Total employment (840)
- Total income ($55M)
Tidal water: in 2023, 97K recreational groundfish fishers account for 19% of all fishing days and contribute $149M or 25% of all tidal expenditures.
Lingcod are the most targeted groundfish species, representing 37% ($55M) of all groundfish expenditures and accounting for 35% of total fishing days across all species.
Percentage of total days fished for groundfish by species
- Halibut 27%
- Lingcod 35%
- Rockfish 27%
- Other groundfish or finfish 11%
Groundfish recreational expendituresFootnote 6 by species and region
Halibut
- Haida Gwaii - $14.1M
- Central Coast - $6.9M
- North Coast - $9.1M
- Barkley Sound - $8.2M
- Johnstone Strait - $3.6M
- Strait of Georgia - $3.5M
- West Coast Vancouver Island - $8.1M
Lingcod
- Haida Gwaii - $9.3M
- Central Coast - $6.6M
- North Coast - $5.0M
- Barkley Sound - $6.8M
- Johnstone Strait - $6.7M
- Strait of Georgia - $10.0M
- West Coast Vancouver Island - $10.5M
Rockfish
- Haida Gwaii - $5.2M
- Central Coast - $4.8M
- North Coast - $3.0M
- Barkley Sound - $5.9M
- Johnstone Strait - $4.0M
- Strait of Georgia - $6.6M
- West Coast Vancouver Island - $5.9M
Other groundfish or finfish
- Haida Gwaii - $0.2M
- Central Coast - $0.5M
- North Coast - $0.6M
- Barkley Sound - $0.9M
- Johnstone Strait - $0.6M
- Strait of Georgia - $2.9M
- West Coast Vancouver Island - $0.5M
More than a quarter (26%) of recreational halibut expenditures occurs in Haida Gwaii.
Recreational lingcod fishing is more regionally dispersed with catch occurring off the West Coast of Vancouver Island (19%), Strait of Georgia (18%), and Haida Gwaii (17%).
The majority of recreational rockfish expenditures occurs in the Strait of Georgia (19%), Barkley Sound (17%), and the West Coast of Vancouver Island (17%).
Footnotes
- Source: iSEA survey of Tidal water recreational fishing 2023.
- All values are in 2023-dollars by calendar year, unless otherwise specified.
- 2023 data and 2020–2023-dollar values are considered preliminary and and are subject to change.
Data
The commercial data and the recreational data that informed this work can be downloaded here.
- Date modified: