
Sea cucumber fishery
The following profile provides the socioeconomic context of the sea cucumber fishery in British Columbia. It includes an overview of the commercial sector. This overview is based on data collected from DFO commercial harvest logbooks and sale slips, public reports, and DFO surveys on harvest prices.
Long text version
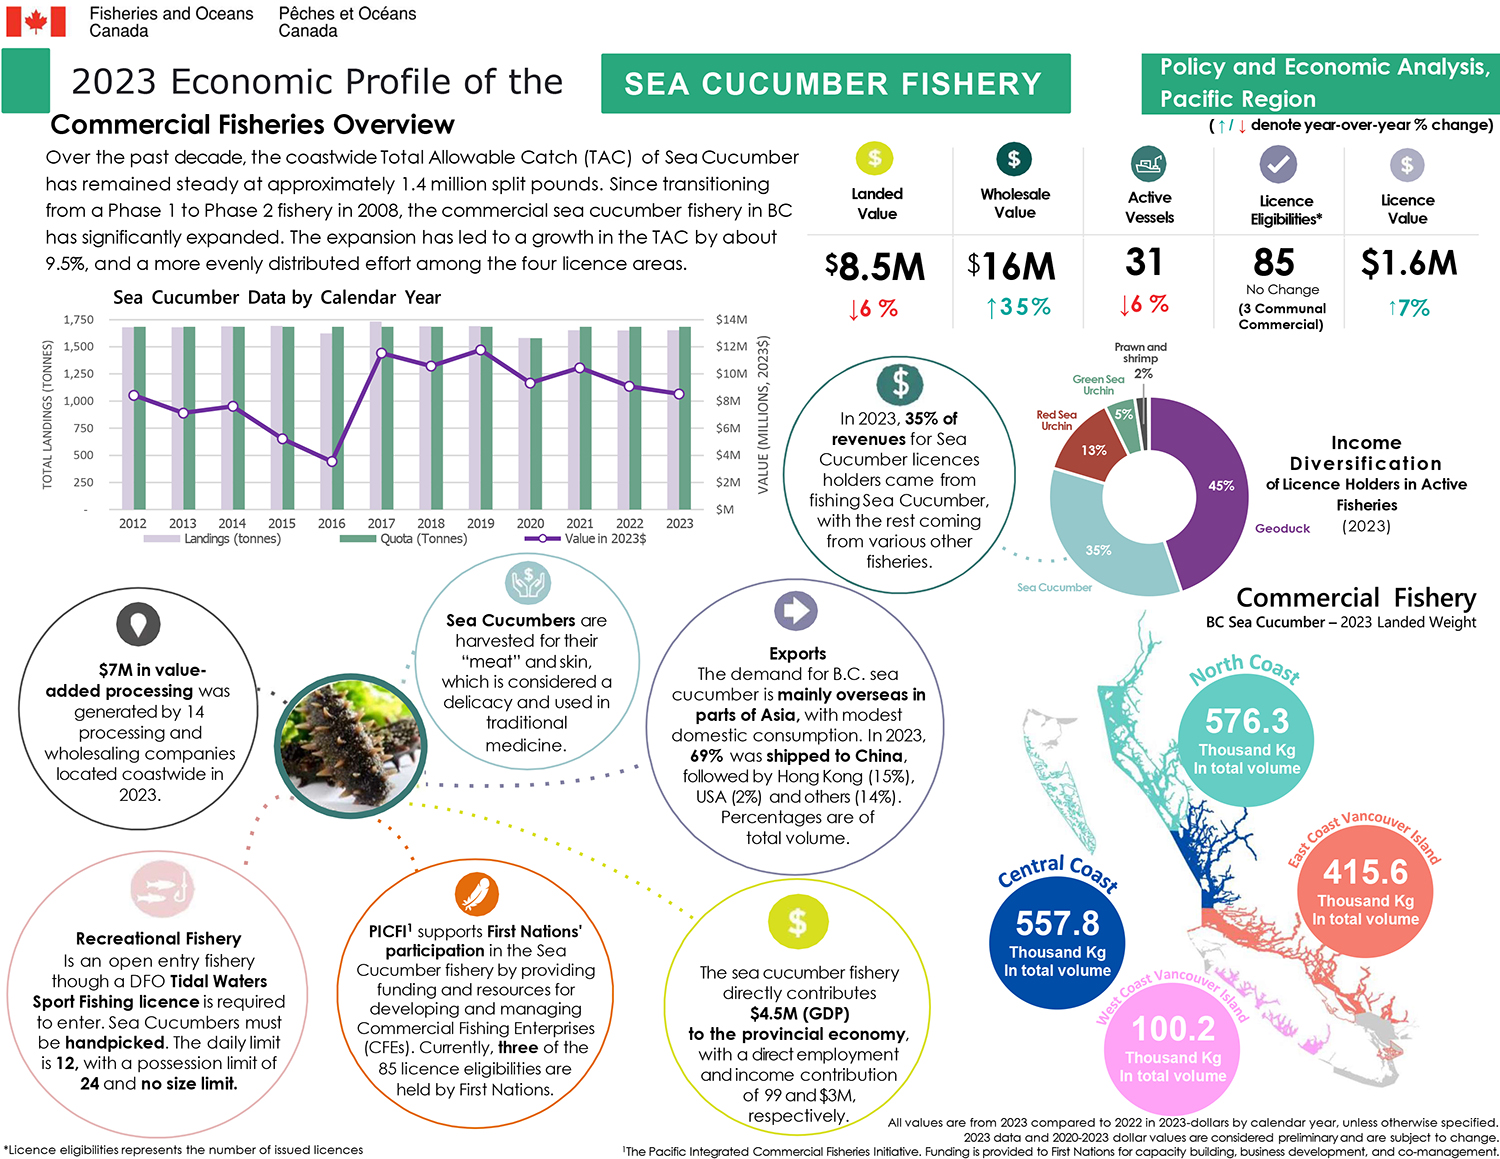
2023 Economic profile of the sea cucumber fishery
Commercial fisheries overview
Over the past decade, the coastwide Total Allowable Catch (TAC) of sea cucumber has remained steady at approximately 1.4 million split pounds. Since transitioning from a Phase 1 to Phase 2 fishery in 2008, the commercial sea cucumber fishery in BC has significantly expanded. The expansion has led to a growth in the TAC by about 9.5%, and a more evenly distributed effort among the four licence areas.
Key metrics for the sea cucumber fishery, all values are from 2023 and in 2023 dollars
- Landed value ($8.5M), decreased by 6% since 2022
- Wholesale value ($16M), increased by 35% since 2022
- Active vessels (31), decreased by 6% since 2022
- Licence eligibilities (85, 3 communal commercial licences), no change since 2022
- Licence value ($1.6M), increased by 7% since 2022
Sea cucumber landings by calendar year chart
Landings (tonnes)
- 2012 - 1,679 t
- 2013 - 1,681 t
- 2014 - 1,688 t
- 2015 - 1,692 t
- 2016 - 1,624 t
- 2017 - 1,732 t
- 2018 - 1,689 t
- 2019 - 1,691 t
- 2020 - 1,582 t
- 2021 - 1,652 t
- 2022 - 1,651 t
- 2023 - 1,652 t
Quota (tonnes)
- 2012 - 1,684 t
- 2013 - 1,684 t
- 2014 - 1,684 t
- 2015 - 1,684 t
- 2016 - 1,684 t
- 2017 - 1,684 t
- 2018 - 1,684 t
- 2019 - 1,684 t
- 2020 - 1,579 t
- 2021 - 1,684 t
- 2022 - 1,684 t
- 2023 - 1,684 t
Landed value (in 2023$)
- 2012 - $8.4M
- 2013 - $7.1M
- 2014 - $7.6M
- 2015 - $5.2M
- 2016 - $3.5M
- 2017 - $11.5M
- 2018 - $10.6M
- 2019 - $11.8M
- 2020 - $9.3M
- 2021 - $10.4M
- 2022 - $9.1M
- 2023 - $8.5M
Commercial fishery BC sea cucumber - 2023 landed weight map
- North Coast: 576.3 thousand kilograms in total volume
- Central Coast: 557.8 thousand kilograms in total volume
- East Coast Vancouver Island: 415.6 thousand kilograms in total volume
- West Coast Vancouver Island: 100.2 thousand kilograms in total volume
Income diversification of licence holders in active fisheries (2023)
In 2023, 35% of revenues for sea cucumber licence holders came from fishing sea cucumber, with the rest coming from geoduck (45%), red sea urchin (13%), green sea urchin (5%), and prawn and shrimp (2%).
Exports: The demand for B.C. sea cucumber is mainly overseas in parts of Asia, with modest domestic consumption. In 2023, 69% was shipped to China, followed by Hong Kong (15%), USA (2%) and others (14%). Percentages are of total volume.
$7M in value-added processing was generated by 14 processing and wholesaling companies located coastwide in 2023.
The sea cucumber fishery directly contributes $4.5M (GDP) to the provincial economy, with a direct employment and income contribution of 99 and $3M, respectively.
PICFIFootnote 1 supports First Nations' participation in the sea cucumber fishery by providing funding and resources for developing and managing Commercial Fishing Enterprises (CFEs). Currently, three of the 85 licence eligibilities are held by First Nations.
Sea cucumbers are harvested for their “meat” and skin, which is considered a delicacy and used in traditional medicine.
Recreational Fishery is an open entry fishery though a DFO Tidal Waters Sport Fishing licence is required to enter. Sea cucumbers must be handpicked. The daily limit is 12, with a possession limit of 24 and no size limit.
Footnote
- Licence eligibilities represents the number of issued licences.
- All values are from 2023 compared to 2022 in 2023-dollars by calendar year, unless otherwise specified.
- 2023 data and 2020-2023 dollar values are considered preliminary and are subject to change.
Data
The commercial data that informed this work can be downloaded here.
- Date modified: