
Economic contributions of commercial and recreational Pacific salmon fisheries in British Columbia 2022 - 2025
Addendum
This report is an updated version of the Economic Contributions of Commercial and Recreational Pacific Salmon Fisheries in British Columbia (2021–2024), published August 2026. The current report updates the analysis and estimates for the 2022–2025 period. The previous version of the report is available here: https://www.pac.dfo-mpo.gc.ca/analyses-econom-analysis/fisheries-peches/multi-sector-secteur/smon-rec-comm-econ-rpt/2021-2024/index-eng.html.
The 2022–2025 edition adds in test fishery catch, which was not included in the 2021–2024 report. As a result, annual catch estimates may differ between the two reports.
The 2025 catch data from the Pacific Salmon Commission (PSC) Annual Report is preliminary and subject to change. The preliminary data were provided by DFO Salmon Management and Client Services.
On this page
- 1. Summary
- 2. Background
- 3. Commercial salmon industry
- 4. Recreational fishing sector
- 5. Methodology and data
- 6. Appendix
- 7. References and data sources
1. Summary
Salmon is a significant economic contributor in British Columbia, supporting a wide range of industries and communities. The commercial and recreational salmon fisheries generate significant economic activity through harvesting, processing, tourism, and related services, sustaining jobs across coastal and inland regions, making it an important contributor to provincial and national GDP. Recreational fishery benefits reflect angler expenditures associated with participation in salmon fishing and include economic activity generated by trips that involve both retained and released fish. Commercial fishery benefits are derived from the sale of landed fish and are linked to harvested catch. Because of its broad economic reach and the livelihoods it supports, salmon remains one of the most important natural resources in BC and Canada’s economy.
Long text version
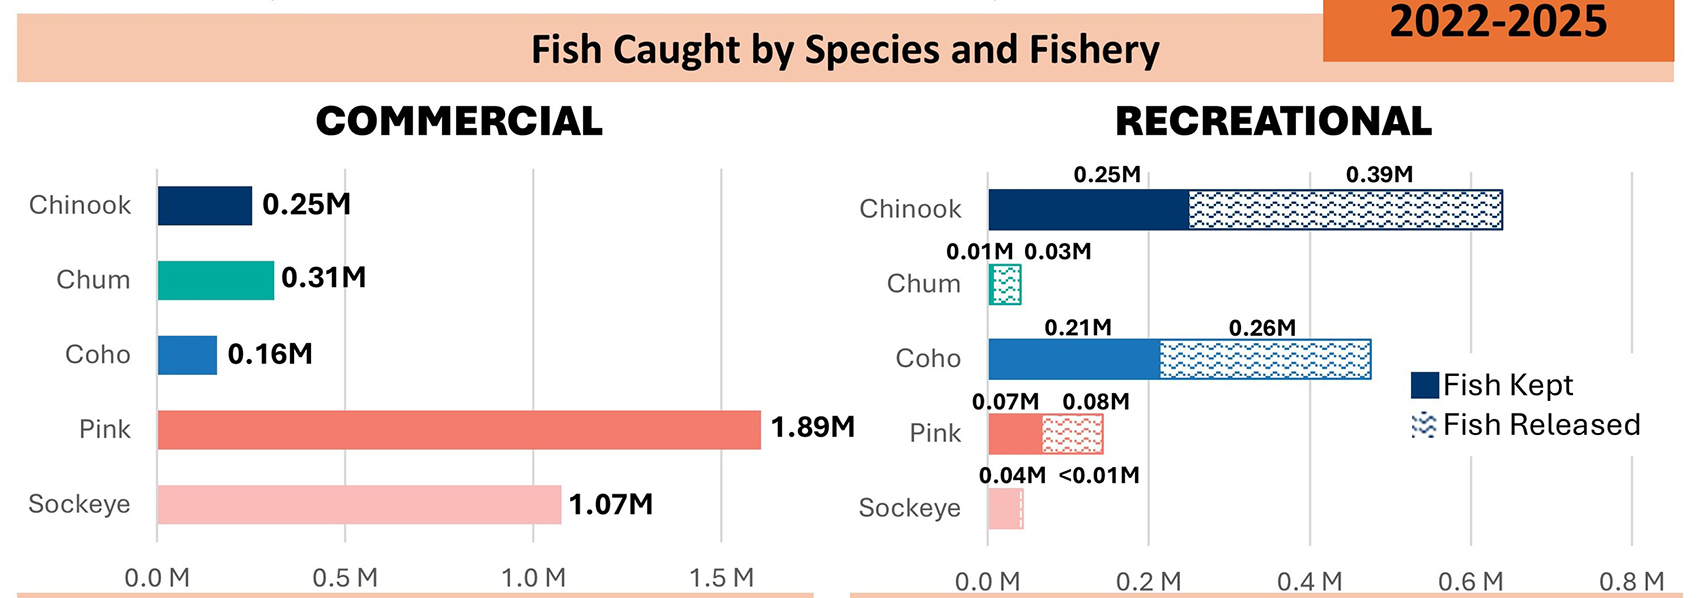
Fish caught by species and fishery 2022 - 2025
| Species | Commercial | Recreational |
|---|---|---|
| Chinook | 0.25M | 0.25M fish kept 0.39M fish released |
| Chum | 0.31M | 0.01M fish kept 0.03M fish released |
| Coho | 0.16M | 0.21M fish kept 0.26M fish released |
| Pink | 1.89M | 0.07M fish kept 0.08M fish released |
| Sockeye | 1.07M | 0.04M fish kept <0.01M fish released |
Long text version
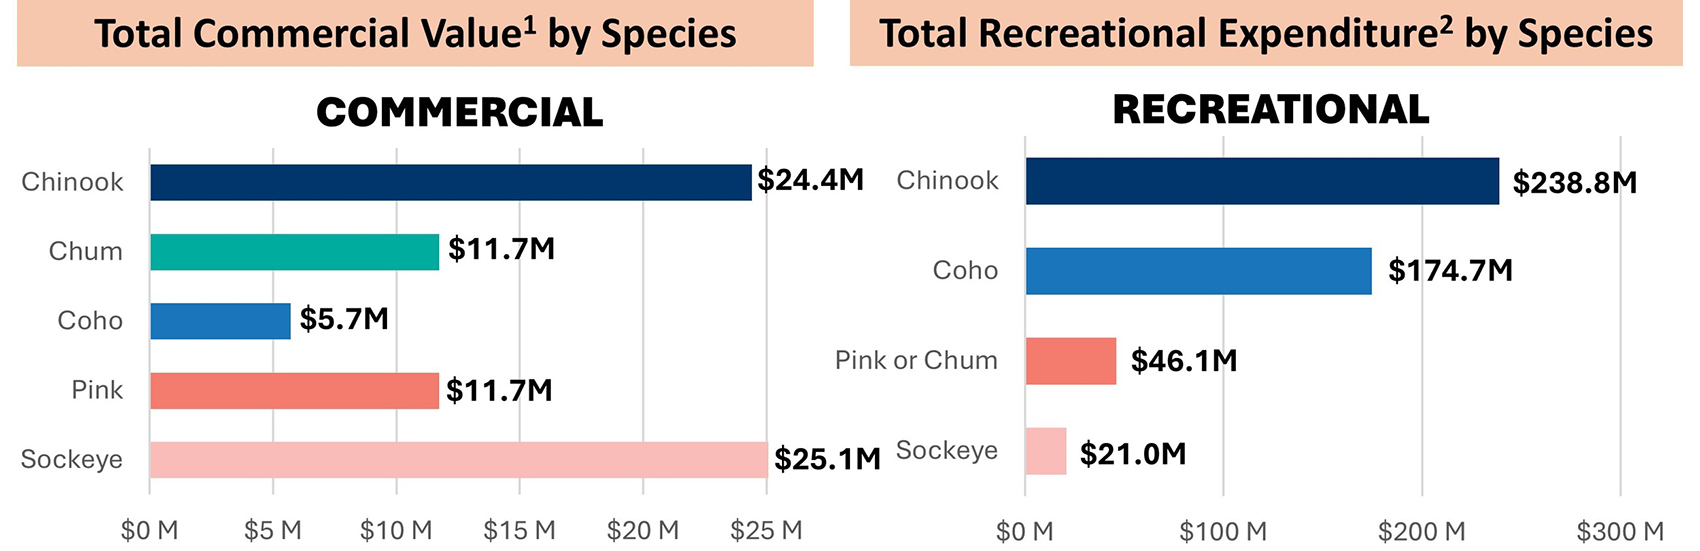
Total commercial valueFootnote 1 by species
| Species | Commercial |
|---|---|
| Chinook | $24.4M |
| Chum | $11.7M |
| Coho | $5.7M |
| Pink | $11.7M |
| Sockeye | $25.1M |
Total recreational expenditureFootnote 2 by species
| Species | Recreational |
|---|---|
| Chinook | $238.8M |
| Coho | $174.7M |
| Pink or chum | $46.1M |
| Sockeye | $21.0M |
All values are 2022–2025 averages in CAD 2025 constant dollars, unless otherwise specified.
The salmon fishery contributes a total of $323 million to provincial GDP and supports 4,180 jobs. Sockeye salmon accounts for nearly one-third (33%) of commercial fishery GDP, while Chinook salmon accounts for approximately half (50%) of recreational fishery GDP.
All values are 2022–2025 averages in CAD 2025 constant dollars, unless otherwise specified.
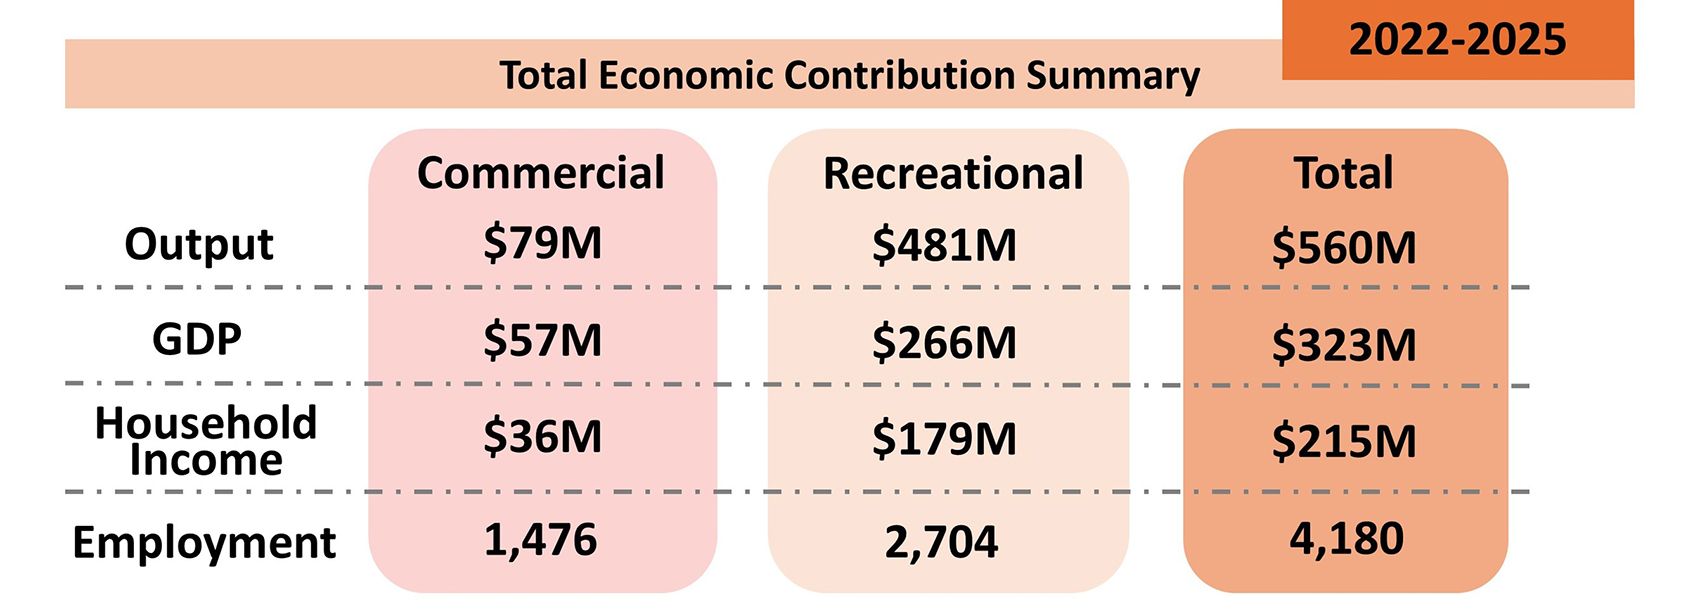
Total economic contribution summary 2022-2025
Long text version
| Commercial | Recreational | Total | |
|---|---|---|---|
| Output | $79M | $481M | $560M |
| GDP | $57M | $266M | $323M |
| Household income | $36M | $179M | $215M |
| Employment | 1,476 | 2,704 | 4,180 |
Long text version
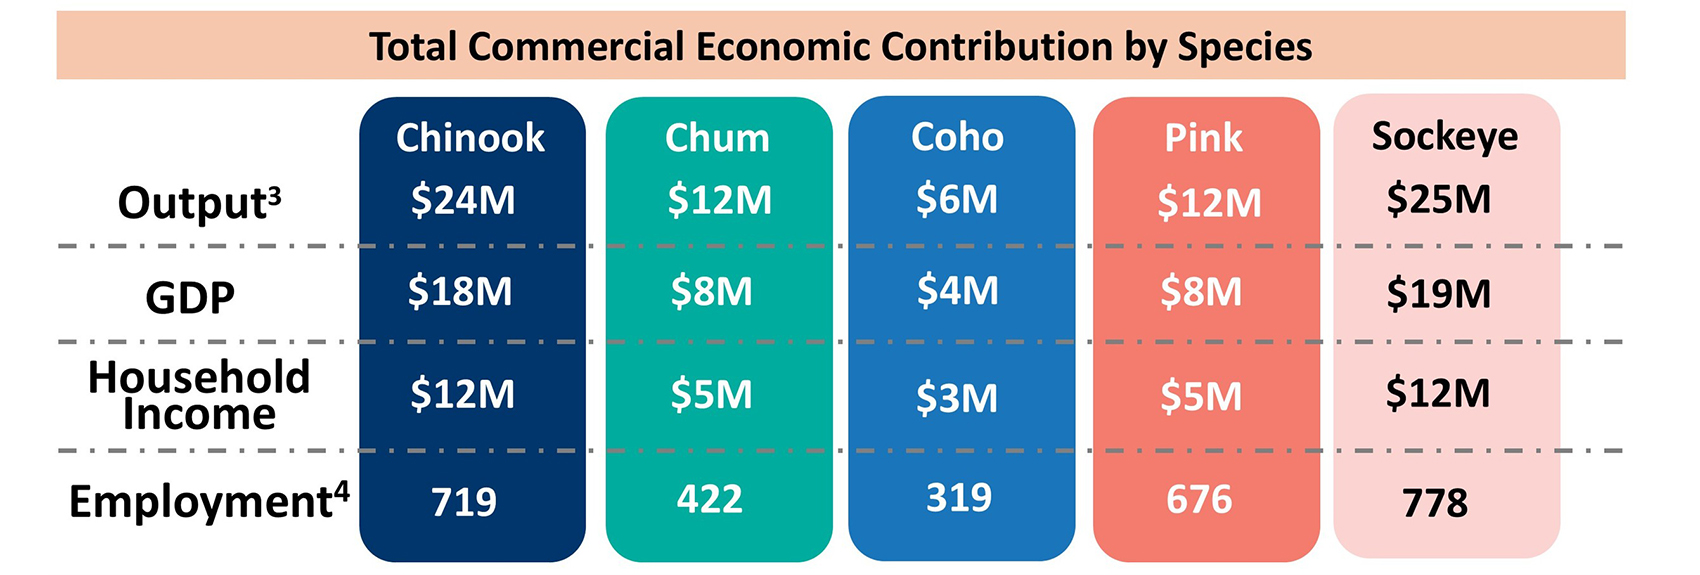
Total commercial economic contribution by species 2022-2025
| Chinook | Chum | Coho | Pink | Sockeye | |
|---|---|---|---|---|---|
| Output Footnote 3 | $24M | $12M | $6M | $12M | $25M |
| GDP | $18M | $8M | $4M | $8M | $19M |
| Household income | $12M | $5M | $3M | $5M | $12M |
| EmploymentFootnote 4 | 719 | 422 | 319 | 676 | 778 |
All values are 2022–2025 averages in CAD 2025 constant dollars, unless otherwise specified.
Please refer to Appendices A.5 and B.2 for a breakdown of the economic impacts by species.
Long text version
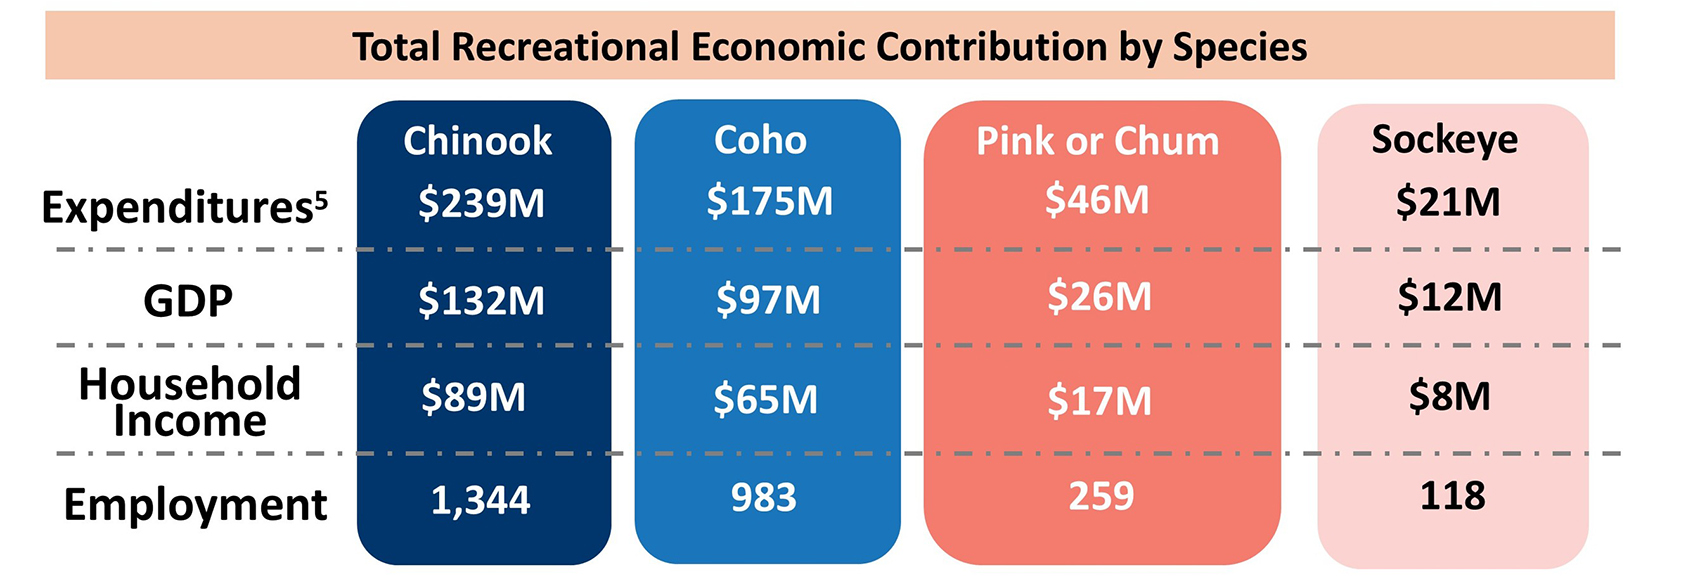
Total recreational economic contribution by species 2022-2025
| Chinook | Coho | Pink or chum | Sockeye | |
|---|---|---|---|---|
| ExpendituresFootnote 5 | $239M | $175M | $46M | $21M |
| GDP | $132M | $97M | $26M | $12M |
| Household income | $89M | $65M | $17M | $8M |
| Employment | 1,344 | 983 | 259 | 118 |
2. Background
This report presents a socio economic overview of British Columbia’s (BC) commercial and recreational salmon fisheries using currently available information.
The report summarizes the structure and economic contributions of both commercial and recreational salmon fisheries in BC. For commercial fisheries, it presents economic indicators across harvesting, processing, trade, and retail. For recreational fisheries, it highlights activity and related expenditures for freshwater and saltwater salmon fishing. Together, these data illustrate how revenues and spending move through each sector’s value chain and contribute to the provincial economy.
While the profiles aim to build a shared understanding of the socio economic dimensions of these fisheries, they only capture quantifiable information and there are social and non-market values related to recreational and commercial fishing that are not included. Further, this report does not discuss the values associated with First Nations Food, Social, and Ceremonial (FSC) fisheries. Reporting on the social, cultural, and economic values of FSC fisheries is outside the scope of this report, which only covers commercial and recreational fisheries.
Fisheries and Oceans Canada Pacific Region also contributes to salmon management in the Yukon, however salmon run sizes have not supported commercial or recreational fishing opportunities in the Yukon River system for several years, including the years covered in this report.
In the past decade, commercial efforts on the Yukon River primarily focused on Chum salmon due to their abundance. However, due to changes in ocean conditions and predation, climate change, habitat degradation, and overfishing, the population has steadily declined, and the fishery closed in 2020 to focus on restoration, conservation, and rebuilding. Similar to the commercial fishery, recreational angling has been restricted due to low abundance and for conservation.
The Alsek River originates in the Yukon and runs through Alaska, with minimal recreational salmon harvest reported for 2022 only (15 pieces), and no commercial salmon reported. Catch from the Stikine and Taku Rivers within the transboundary area has been included in the report.
Definitions and acronyms
- Accommodation and food service (AFS)
- Businesses that provide short-term lodging and related services, as well as those that prepare and serve food and beverages for immediate consumption.
- Direct economic impact
- A measure of the impact on the economy from actual expenditures made by establishments operating in the sector.
- Direct expenditures
- Expenditures on goods and services (food, camping, accommodation, transportation, supplies, etc.) incurred during fishing trips or excursions.
- Ex-vessel value
- Dollar value of commercial harvest at first purchase of seafood landings.
- Fish slip
- A commercial sales record capturing information on seafood purchases such as species, weight, and price.
- For-hire
- Hired boat with a guide/charter.
- Harvest
- Catching of fish for commercial use.
- Household food expenditure (HFE)
- Purchases of food consumed at home, such as groceries bought from retail outlets.
- Indirect economic impact
- Measures the economic activity of industries supplying goods and services used by sector operators. This is also referred to as “supplier industry impact”.
- Induced economic impact
- Measures the impact on the economy of spending by workers employed as a result of the sector’s activity.
- International export (INEX)
- Goods and services produced in one Canadian province or territory and sold to buyers in other countries.
- Interprovincial export (IPEX)
- Goods and services produced in one Canadian province or territory and sold to buyers in other provinces or territories.
- Major purchases
- Purchase of durable goods and investments in support of recreational fishing activities. These include boats, motors, special vehicles, camping gear and other durable goods, as well as land and building purchases.
- Package expenditures
- Monies paid to a lodge or outfitter for a complete range of services such as lodging, food, transportation, use of fishing equipment, etc.
- Private
- Private boat either with or without a guide.
- Processing
- Transforming fish and shellfish into market-ready products.
- Shore-based
- Land-based fishing while on the shoreline instead of a boat.
- Wholesaling
- Distribution of processed products to retailers, food service providers, or export channels.
3. Commercial salmon industry
The British Columbia commercial salmon industry is a multi-sector industry composed of harvesting, processing, wholesaling, retail, and trade-related sectors. This section provides an overview of the commercial salmon industry, including the economic contributions of each sector. It builds on previous analyses and extends to the downstream activities of retail sales and exports.
Throughout this report, ‘commercial’ data includes commercial and communal commercial harvest from marine fisheries, as well as Economic Opportunity (EO), Demonstration (DEMO), Excess Salmon to Spawning Requirement (ESSR), Five Nations Community-Based Economic Fishery (CBEF), Harvest Agreement (HA) fisheries, and transboundary fisheries. Additional detailed tables are presented in Appendix A. Tables expressed in US dollars are in Appendix C.
3.1 Commercial value chain
Table 3.1 summarizes value chain information for the five Pacific salmon species that are targeted in the commercial fishery: Chinook, chum, coho, pink, and sockeye. A typical salmon life cycle spans two to seven years, with major stocks running on a four-year cycle. This report presents the most recent four years of available data, ensuring that both high and low harvest years are included to establish an annual average for comparison, where applicable.
| 2022 | 2023 | 2024 | 2025 | Average | ||
|---|---|---|---|---|---|---|
| Fish caught (pieces) | Chinook | 237,827 | 258,616 | 232,521 | 281,187 | 252,537 |
| Chum | 173,3109 | 80,487 | 589,696 | 402,423 | 311,479 | |
| Coho | 180,444 | 189,299 | 165,143 | 100,538 | 158,856 | |
| Pink | 939,411 | 2,190,141 | 2,243,339 | 2,206,285 | 1,894,794 | |
| Sockeye | 1,917,298 | 563,198 | 820,045 | 998,975 | 1,074,879 | |
| Total | 3,448,289 | 3,281,741 | 4,050,744 | 3,989,408 | 3,692,545 | |
| Weight landed ('000 KG) | Chinook | 1,408 | 1,522 | 1,402 | 1,632 | 1,491 |
| Chum | 1,007 | 472 | 1,501 | 1,501 | 1,225 | |
| Coho | 549 | 532 | 436 | 355 | 468 | |
| Pink | 1,641 | 3,726 | 3,986 | 3,951 | 3,326 | |
| Sockeye | 3,926 | 1,206 | 1,726 | 2,029 | 2,222 | |
| Total | 8,530 | 7,458 | 9,470 | 9,467 | 8,731 | |
| Ex-vessel values $000 | Chinook | $12,619 | $13,840 | $15,464 | $18,552 | $15,119 |
| Chum | $5,018 | $1,074 | $5,737 | $4,513 | $4,085 | |
| Coho | $3,279 | $2,680 | $1,930 | $1,880 | $2,442 | |
| Pink | $1,476 | $2,145 | $3,099 | $2,900 | $2,405 | |
| Sockeye | $24,530 | $6,724 | $9,525 | $13,965 | $13,686 | |
| Total | $46,921 | $26,463 | $35,754 | $41,810 | $37,737 | |
| Wholesale value $000 | Chinook | $15,900 | $17,439 | $19,484 | $23,375 | $19,050 |
| Chum | $11,239 | $2,405 | $12,850 | $10,110 | $9,151 | |
| Coho | $6,000 | $4,9049 | $3,532 | $3,440 | $4,469 | |
| Pink | $5,623 | $8,173 | $11,806 | $11,049 | $9,163 | |
| Sockeye | $35,078 | $9,616 | $13,621 | $19,970 | $19,571 | |
| Total | $73,840 | $42,536 | $61,293 | $67,944 | $61,403 | |
| Retail value $000 | Chinook | $20,372 | $22,343 | $24,964 | $29,950 | $24,407 |
| Chum | $14,400 | $3,081 | $16,465 | $12,954 | $11,725 | |
| Coho | $7,688 | $6,2836 | $4,525 | $4,407 | $5,726 | |
| Pink | $7,204 | $10,471 | $15,126 | $14,156 | $11,739 | |
| Sockeye | $44,943 | $12,320 | $17,452 | $25,586 | $25,075 | |
| Total | $94,607 | 54,499 | $78,531 | $87,053 | $78,673 | |
Note: Handling and transportation are included in the fishing, wholesaling, and retailing parts of the value chain.
Source: Commercial logbooks and fish slips (commercial and communal commercial harvest); DFO Price Survey data; Pacific Salmon Commission (PSC) Annual Reports (ESSR, CBEF, EO, demo fisheries and Transboundary rivers), Annual Fisheries Production Schedule (wholesale value), Statistics Canada Supply Use Tables (retail value).
From 2022-2025, on average, the commercial fisheries harvested 3.7 million pieces of salmon, weighing approximately 8.7 million kg for an ex-vessel value of $38 million. Chinook and sockeye salmon account for 75% of the total ex-vessel value and are very important for the viability of the commercial fleet. While pink salmon account for the highest volume of catch, it has the lowest ex-vessel value. These fish are better suited to more processed products e.g. canning than fillets, as evidenced by their significantly higher wholesale margin. Domestically harvested salmon was processed and wholesaled for nearly $61 million. The estimated retail value of $79 million includes household and restaurant consumption in BC, as well as exports to other provinces and countries. Section 5.2 offers more details on the methods for estimating retail value.
Long text version
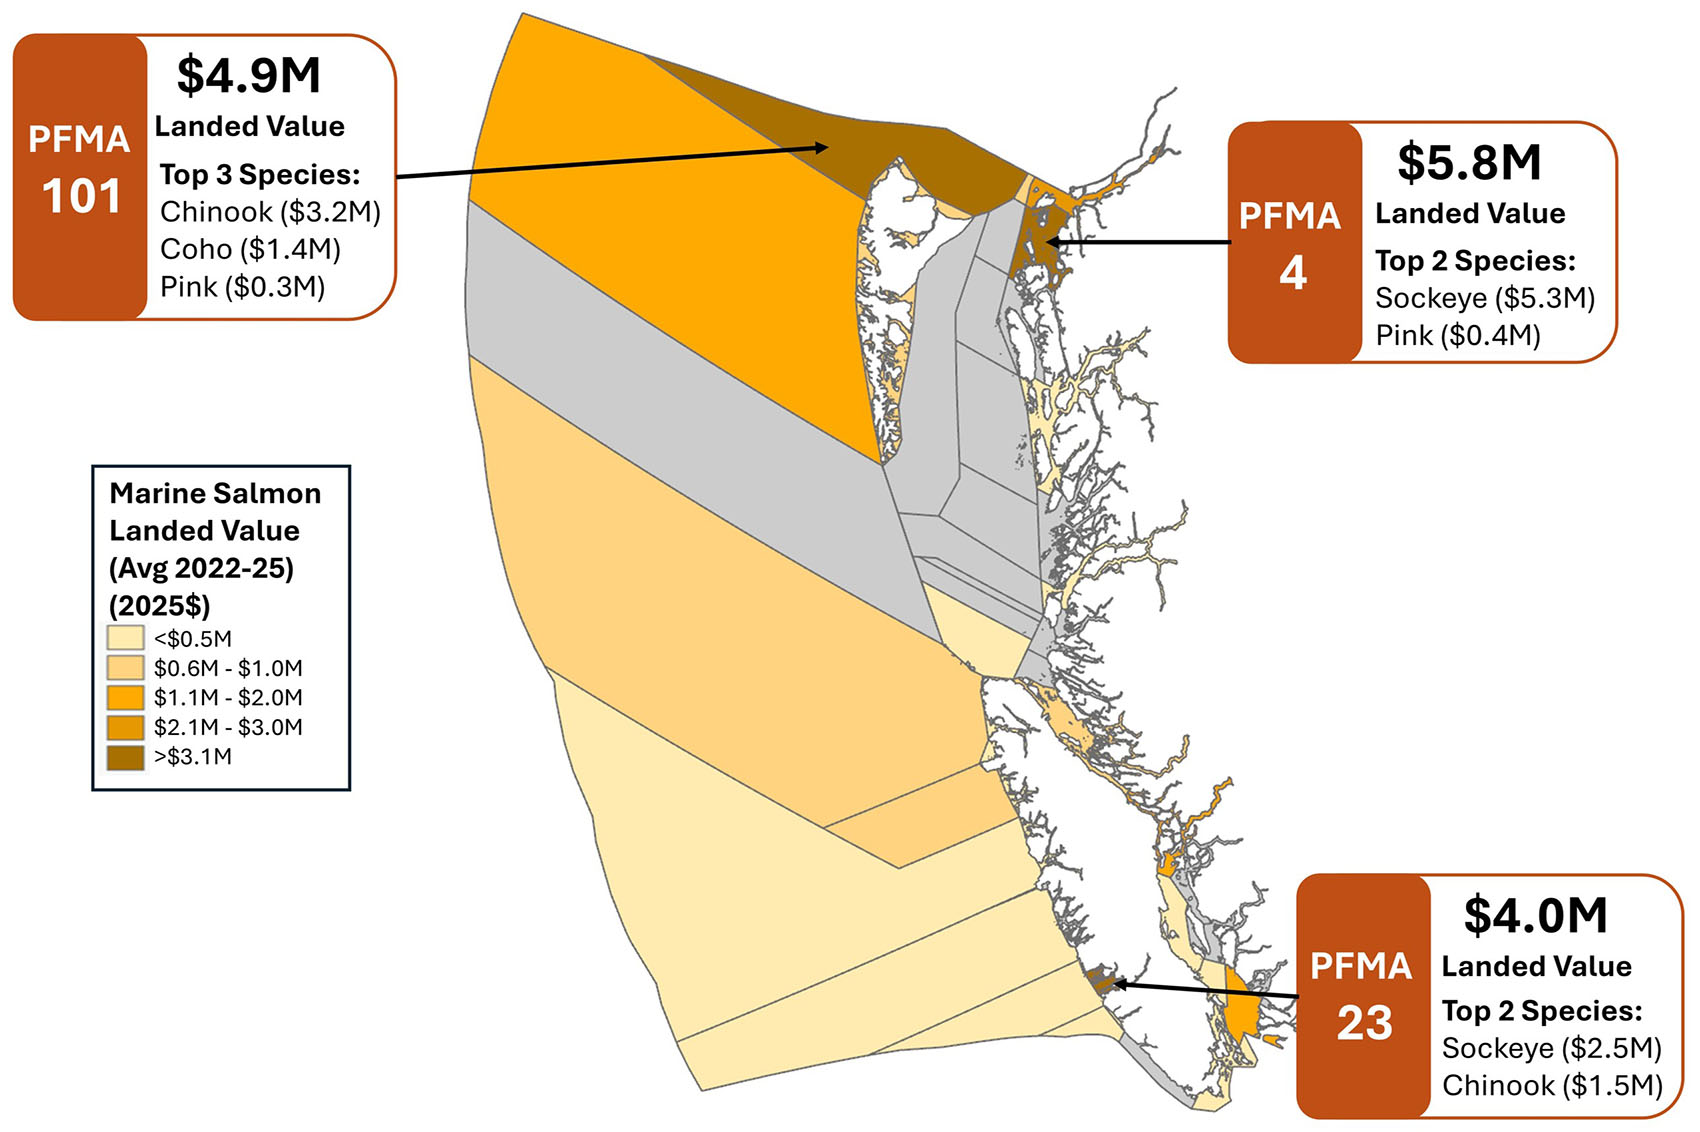
Figure 3.1: Commercial marine landed value by PFMA area, 2022 to 2025 average (all values in CAD 2025 constant dollars)
PFMA 101 - $4.9M landed value
Top 3 species:
- Chinook ($3.2M)
- Coho ($1.4M)
- Pink ($0.3M)
PFMA 4 - $5.8M landed value
Top 2 species:
- Sockeye ($5.3M)
- Pink ($0.4M)
PFMA 23 - $4.0M landed value
Top 2 species:
- Sockeye ($2.5M)
- Chinook ($1.5M)
These downstream values depend on domestic salmon harvest, which occurs across the province with landings all along the coast. In recent years, commercial harvest revenues are increasingly concentrated in a few areas. The Pacific Fisheries Management Areas (PFMAs) with the highest salmon ex-vessel values from 2022-2025 were PFMA 4 and 101 in the north and PFMA 23 in the south. Figure 3.1 shows a heatmap of the average landed values by PFMA for 2022-2025. Areas with the highest landed values correspond to locations where high-value sockeye and Chinook harvests are concentrated. Appendix A.3 shows additional harvest and active vessel information by licence area.
To support their harvest activities, commercial harvesters spend money on gear, maintenance, repairs, supplies, and sell their fish to processors who prepare and preserve the catch into marketable products, with handling, transportation, wholesaling, exporting, and retailing activities that follow. These ripples in the provincial economy are estimated in Section 3.2, Commercial Fishing Economic Contributions.
3.2 Commercial fishing economic contributions
Economic activities along the commercial fishing value chain all involve businesses spending money on wages and production inputs (i.e., suppliers), who in turn spend their earnings on other goods and services. This section estimates these contributions to the provincial economy using multipliers derived from input-output modeling of the seafood sector and the broader economy. Between 2022-2025 commercial output along the value chain averaged $79 million annually, contributing $57 million in GDP, $36 million in labour income, and over 1,400 jobs. The 2022 bump in economic contributions is mainly attributable to an increase in sockeye salmon catch, as this was a dominant Adams River sockeye year.

Long text version
Economic activities along the commercial fishing value chain
- Fishing - Catching fish
- Handling - Handling fish (e.g., packer to dock, offload fish at dock, and transport to plant)
- Processing - Processing fish at plant (e.g., fresh, frozen or canned products, roe products, by-products or others (i.e., smoked))
- Wholesaling - Distribution to wholesale
- Retailing - Distribution to consumers (e.g., restaurants, and retail stores)
- Exporting - Distribution to international / interprovincial markets
Table 3.2 summarizes the overall economic contributions of commercial salmon to regional GDP and labour income along the value chain. Estimates of direct, indirect, and induced effects shown below consider fishing, processing, retail, and trade activities. Retail activities include accommodation and food services (i.e., restaurants) as well as household food expenditures. Trade includes sales of BC salmon products to other Canadian provinces as well as international exports. Business expenditures on handling, transportation, and wholesaling are included as part of each of these activities. Note that total sector output is lower than the retail value reported in the previous section because the output estimates remove the cost of intermediate inputs from earlier stages of the value chain to eliminate double-counting of economic activity. Section 5 of this report presents additional information on data sources and methods.
| 2022 | 2023 | 2024 | 2025 | Average | ||
|---|---|---|---|---|---|---|
| Direct | Output $000 | $94,607 | $54,499 | $78,531 | $87,053 | $78,673 |
| GDP $000 | $41,869 | $23,938 | $33,733 | $38,089 | $34,407 | |
| Labour income $000 | $28,730 | $16,437 | $23,209 | $26,163 | $23,635 | |
| Employment | 1,481 | 1,175 | 1,213 | 1,368 | 1,310 | |
| Indirect | GDP $000 | $17,777 | $10,305 | $15,119 | $16,513 | $14,929 |
| Labour income $000 | $10,546 | $6,110 | $8,951 | $9,788 | $8,849 | |
| Employment | 140 | 81 | 118 | 130 | 117 | |
| Induced | GDP $000 | $9,236 | $5,318 | $7,650 | $8,492 | $7,674 |
| Labour income $000 | $4,729 | $2,722 | $3,914 | $4,347 | $3,928 | |
| Employment | 59 | 34 | 49 | 54 | 49 | |
| Total | GDP $000 | $68,883 | $39,561 | $56,503 | $63,094 | $57,010 |
| Labour income $000 | $44,006 | $25,269 | $36,074 | $40,298 | $36,412 | |
| Employment | 1,680 | 1,290 | 1,380 | 1,552 | 1,476 | |
Source: Commercial logbooks and fish slips; DFO Price Survey data; PSC Annual Reports; British Columbia’s Fisheries and Aquaculture Sector (2022 edition). Statistics Canada Provincial Supply and Use Tables (2022).
Between 2022-2025, fishing accounted for 47% of the total output in the commercial salmon industry, followed by processing (31%) and the retail and trade sectors (22%). Total GDP and labour income contributions show fishing (48%) and retail and trade (31%) making up the largest shares. Table 3.3 (next page) presents these economic contributions in more detail.
Appendix A.4 shows the total economic contribution breakdown by direct, indirect, and induced contributions.
| Direct output of the sector $000 |
Total economic contribution | ||||
|---|---|---|---|---|---|
| GDP $000 | Labour income $000 | Employment | |||
| 2022 | Fishing | $46,921 | $33,994 | $22,302 | 1,242 |
| Processing | $26,919 | $13,812 | $8,967 | 148 | |
| Retail and trade | $20,767 | $21,076 | $12,737 | 290 | |
| Total | $94,607 | $68,883 | $44,006 | 1,680 | |
| 2023 | Fishing | $26,463 | $19,172 | $12,578 | 1,035 |
| Processing | $16,073 | $8,247 | $5,354 | 88 | |
| Retail and trade | $11,963 | $12,141 | $7,337 | 167 | |
| Total | $54,499 | $39,561 | $25,269 | 1,290 | |
| 2024 | Fishing | $35,754 | $25,904 | $16,994 | 999 |
| Processing | $25,539 | $13,104 | $8,507 | 140 | |
| Retail and trade | $17,238 | $17,495 | $10,573 | 241 | |
| Total | $78,531 | $56,503 | $36,074 | 1,380 | |
| 2025 | Fishing | $41,810 | $30,291 | $19,872 | 1,142 |
| Processing | $26,134 | $13,409 | $8,705 | 144 | |
| Retail and trade | $19,109 | $19,393 | $11,720 | 267 | |
| Total | $87,053 | $63,094 | $40,298 | 1,552 | |
| Average | Fishing | $37,737 | $27,341 | $17,936 | 1,104 |
| Processing | $23,666 | $12,143 | $7,883 | 130 | |
| Retail and trade | $17,269 | $17,526 | $10,592 | 241 | |
| Total | $78,673 | $57,010 | $36,412 | 1,476 | |
Note: Handling and transportation are included in the fishing, processing, and retail & trade sectors.
Source: Commercial logbooks and fish slips; DFO Price Survey data; PSC Annual Reports; British Columbia’s Fisheries and Aquaculture Sector (2022 edition); Statistics Canada Provincial Supply and Use Tables (2022).
4. Recreational fishing sector
Recreational fishing for salmon represents both a leisure activity as well as an opportunity to catch and keep fish for personal consumption. These activities provide non-quantifiable benefits to the individual participants as well as contribute directly and indirectly to the economy through fishing-related expenditures.
Most anglers arrange their own fishing trips independently, including gear, boat, accommodation, meals, and transportation. Some anglers, especially from out-of-province, purchase fishing packages to arrange some or all of these services for them. Lodges organize all-inclusive packages that include accommodation, meals, boat and fuel, fishing equipment, as well as a guide to accompany anglers. Charters typically offer angling packages that provide only the boat, fishing equipment and a guide. Lodge experiences typically last three to five days while charter and independent trips typically last a single day.
This section focuses on both tidal (saltwater) and freshwater recreational salmon fishing-related activities, expenditures, and resulting economic contributions. Additional detailed tables are presented in Appendix B. Tables expressed in US dollars are in Appendix C.
4.1 Recreational catch
Catch in the recreational sector is made up of two components, with anglers able to release and/or keep the fish they catch. Between 2022-2025, releases accounted for a larger component of overall catch for all salmon species except sockeye. The relative number of kept and released salmon depends on a number of factors, including angler preferences, bag limits, and other management factors like clipped or tagged hatchery fish. Table 4.1 provides a summary of the number of fish kept and released in the recreational salmon fishery.
On average, Chinook and coho salmon account for approximately 83% of total fish caught (kept + released). Pink (11%), chum (3%), and sockeye (3%) salmon account for the remaining catch. The proportions for fish kept follow a similar trend for most species. In recent years, there has been a gradual increase in catch in the recreational fishing sector.
| Number of fish kept and released (pieces) | 2022 | 2023 | 2024 | 2025 | Average | |
|---|---|---|---|---|---|---|
| Chinook | Kept | 232,969 | 236,616 | 285,462 | 239,445 | 248,623 |
| Released | 419,160 | 363,768 | 408,741 | 368,990 | 390,165 | |
| Chum | Kept | 11,133 | 2,513 | 9,000 | 1,314 | 5,990 |
| Released | 87,408 | 14,399 | 37,330 | 262 | 34,850 | |
| Coho | Kept | 172,772 | 220,445 | 224,137 | 235,437 | 213,198 |
| Released | 128,564 | 266,106 | 337,171 | 316,627 | 262,117 | |
| Pink | Kept | 15,630 | 129,961 | 17,608 | 105,126 | 67,081 |
| Released | 9,738 | 143,719 | 26,541 | 122,183 | 75,545 | |
| Sockeye | Kept | 23,534 | 39,906 | 42,625 | 49,354 | 38,855 |
| Released | 4,659 | 3,748 | 3,840 | 6,323 | 4,643 | |
Source: PSC Annual Reports, multiple years.
4.2 Recreational activity and expenditures
There are a variety of methods by which anglers can enjoy recreational fishing, including, but not limited to:
- For hire: hired boat with a guide or charter
- Private: fishing from your own boat with or without a hired guide
- Shore-based: land-based fishing while on the shoreline instead of a boat
Expenditures for these trips include monies paid to a lodge or outfitter for accommodation and food, purchase of durable goods and investments, and expenditure on goods and services incurred during the fishing trip. Table 4.2 provides a summary of salmon-related expenditures by trip type and year, for both freshwater and tidal fisheries.
| Salmon angling expenditures $000 | 2022 | 2023 | 2024* | 2025 | Average | |
|---|---|---|---|---|---|---|
| Freshwater | For hire | $9,747 | $8,796 | $6,537 | $8,531 | $8,403 |
| Private | $24,136 | $23,475 | $17,774 | $30,013 | $23,849 | |
| Shore-based | $38,993 | $36,686 | $36,409 | $66,891 | $44,745 | |
| All | $72,875 | $68,956 | $60,720 | $105,435 | $76,997 | |
| Tidal water | For hire | $108,442 | $106,098 | $107,635 | $108,366 | $107,635 |
| Private | $277,977 | $271,440 | $284,022 | $302,648 | $284,022 | |
| Shore-based | $12,502 | $11,714 | $11,856 | $11,351 | $11,856 | |
| All | $398,921 | $389,253 | $403,513 | $422,365 | $403,513 | |
| Total | For hire | $118,188 | $114,894 | $114,172 | $116,897 | $116,038 |
| Private | $302,113 | $294,915 | $301,796 | $332,661 | $307,871 | |
| Shore-based | $51,495 | $48,400 | $48,265 | $78,242 | $56,600 | |
| All | $471,796 | $458,209 | $464,233 | $527,800 | $480,510 | |
*Tidal water survey results are available for 2022–2023 and 2025. The 2024 tidal water expenditure is estimated using the average of the 2022, 2023, and 2025 figures.
Source: DFO Internet Socioeconomic Analysis (iSEA) Recreational Surveys, multiple years.
Expenditures in the recreational fishing sector overall have been consistent year to year, averaging nearly $481 million, with tidal salmon fishing accounting for 84% of total expenses and freshwater salmon fishing accounting for 16%. In the freshwater recreational fishing sector, the majority (58%) of expenditures are attributable to shore-based fishing, while in the tidal recreational sector, fishers spend the most (70%) on private boat fishing (i.e., fishing from their own boats).
In terms of species, the majority of total recreational expenses on average were attributable to fishing for Chinook (50%), followed by coho (36%), pink or chum (10%), and sockeye (4%). The small percentage of expenses on sockeye is due to the number of openings rather than a lack of interest in catching sockeye. Chinook and coho account for 90% of expenses in tidal water fishing and nearly two-thirds (63%) in freshwater fishing, while pink, chum and sockeye make up a larger share of expenditures in freshwater than in tidal water fishing.
| Salmon angling expenditures $000 | 2022 | 2023 | 2024* | 2025 | Average | |
|---|---|---|---|---|---|---|
| Freshwater | Chinook | $20,410 | $16,846 | $14,993 | $22,004 | $18,563 |
| Coho | $28,029 | $26,548 | $25,101 | $40,317 | $29,998 | |
| Pink or chum | $13,452 | $17,380 | $13,389 | $26,916 | $17,784 | |
| Sockeye | $10,9841 | $8,183 | $7,237 | $16,198 | $10,651 | |
| All | $72,875 | $68,956 | $60,720 | $105,435 | $76,997 | |
| Tidal water | Chinook | $227,588 | $210,482 | $220,213 | $222,569 | $220,213 |
| Coho | $136,912 | $135,702 | $144,653 | $161,346 | $144,653 | |
| Pink or chum | $23,132 | $33,258 | $28,266 | $28,409 | $28,266 | |
| Sockeye | $11,289 | $9,811 | $10,380 | $10,041 | $10,380 | |
| All | $398,921 | $389,253 | $403,513 | $422,365 | $403,513 | |
| Total | Chinook | $247,997 | $227,328 | $235,207 | $244,573 | $238,776 |
| Coho | $164,941 | $162,249 | $169,754 | $201,662 | $174,652 | |
| Pink or chum | $36,584 | $50,638 | $41,655 | $55,325 | $46,051 | |
| Sockeye | $22,273 | $17,993 | $17,618 | $26,239 | $21,031 | |
| All | $471,796 | $458,209 | $464,233 | $527,800 | $480,510 | |
*Tidal water survey results are available for 2022–2023 and 2025. The 2024 tidal water expenditure is estimated using the average of the 2022, 2023, and 2025 figures.
Source: DFO iSEA Recreational Surveys, multiple years.
Recreational fishing is less dependent on the availability of salmon year to year compared to the commercial fishing industry. Anglers can enjoy the overall experience that recreational fishing provides, including travel, lodging, chartering, and other fishery and non-fishery related expenditures. This is evident as expenditures not only remain consistent year to year overall, but also consistent across species, for both freshwater and tidal fishing.
4.3 Recreational economic contributions
Table 4.4 summarizes economic contributions to regional GDP, labour income, and employment for the recreational salmon sector, including both tidal and freshwater activities. On average, roughly two-thirds of total expenditures by recreational fishers are attributed to private trip (64%), followed by hired boat (24%) and shore-based (12%) fishing. Economic contributions from these expenditures to regional GDP, labour income, and employment followed the same trend.
| Total economic impact | |||||
|---|---|---|---|---|---|
| Year | Total expenditure by recreational fishers $000 |
GDP $000 | Labour income $000 | Employment | |
| 2022 | For hire | $118,188 | $65,500 | $43,942 | 665 |
| Private | $302,113 | $167,431 | $112,326 | 1,700 | |
| Shore-based | $51,495 | $28,539 | $19,146 | 290 | |
| All | $471,796 | $261,470 | $175,414 | 2,655 | |
| 2023 | For hire | $114,894 | $63,674 | $42,718 | 647 |
| Private | $294,915 | $163,442 | $109,649 | 1,660 | |
| Shore-based | $48,400 | $26,823 | $17,995 | 272 | |
| All | $458,209 | $253,939 | $170,362 | 2,579 | |
| 2024* | For hire | $114,172 | $63,274 | $42,449 | 643 |
| Private | $301,796 | $167,255 | $112,208 | 1,699 | |
| Shore-based | $48,265 | $26,748 | $17,945 | 272 | |
| All | $464,233 | $257,278 | $172,602 | 2,613 | |
| 2025 | For hire | $116,897 | $64,785 | $43,462 | 658 |
| Private | $332,661 | $184,361 | $123,683 | 1,872 | |
| Shore-based | $78,242 | $43,361 | $29,090 | 440 | |
| All | $527,800 | $292,507 | $196,236 | 2,970 | |
| Average | For hire | $116,038 | $64,308 | $43,143 | 653 |
| Private | $307,871 | $170,622 | $114,467 | 1,733 | |
| Shore-based | $56,600 | $31,368 | $21,044 | 319 | |
| All | $480,510 | $266,298 | $178,653 | 2,704 | |
Source: DFO iSEA Recreational Surveys, multiple years; British Columbia’s Fisheries and Aquaculture Sector (2022 edition).
Please refer to Appendix B.1 for the total economic contribution breakdown by direct, indirect, and induced contributions.
5. Methodology and data
This report analyzes the domestic total commercial value and total expenditures associated with recreational fishing, accounting for all spending incurred along the value chain. Commercial fishing activity includes harvesting, processing, handling, wholesaling, retailing, restaurants & export industries. Recreational fishing activity includes fishing and any related expenditures such as accommodation, meals, boat and fuel, equipment, transportation, and guides. This approach includes all expenditure and activity in both industries to the end consumer.
5.1 Data sources
Commercial marine harvest data is sourced from logbooks submitted by commercial harvesters as a requirement of the Fisheries Act. Additional commercial harvest data is sourced from the Pacific Salmon Commission (PSC) Annual Reports (e.g. economic opportunity (EO), demonstration (DEMO), excess salmon to spawning requirement (ESSR), Five Nations Community Based Economic Fisheries, Harvest Agreement (HA) fisheries, Transboundary Rivers). Sale slips are used to convert fish caught (pieces) into a standardized weight (pounds) and assign a price (dollars per pound) estimate by matching several key variables between the logbook and sale slip data. The prices are supplemented and adjusted using results from the DFO Price Survey. The DFO Price Survey improves upon the price information for commercial seafood harvest by collecting price data from BC-based processors and buyers which includes bonus and other payments missing from sale slips.
The Annual Fisheries Production Schedule (AFPS) is administered by the Province of British Columbia and collects data from seafood buyers, processors, and exporters on the wholesale value of seafood by species. Data on imports and exports are from Statistics Canada EXIM data.
Recreational catch data is sourced from aggregated results as presented in the Annual Reports commissioned by the PSC. Expenditure information is sourced from the Internet Socioeconomic Analysis (iSEA) Surveys that are administered by DFO Pacific Region and collect socioeconomic information on both tidal and freshwater recreational fishing activity in British Columbia. Throughout this report, recreational fishing expenditures refer to the sum of direct expenditures, major purchases attributable to fishing, and package expenditures. Additional information on the survey data and methods is available online.
Provincial Supply and Use Tables are generated by Statistics Canada and show the relationship between different sectors of the economy, for example, harvesting, processing, transportation, and retailing. They show the mix of inputs used by each sector, allowing for the creation of multipliers to understand the economic contributions of various activities to the provincial economy.
Unless otherwise noted, all dollar-values are reported in CAD 2025 constant dollars. For US dollar (USD) estimates presented in the appendices, annual average exchange rates from the Bank of Canada were applied to the nominal annual estimates to convert from Canadian to US dollars. US Bureau of Economic Analysis Price Index for GDP was used to convert these nominal USD estimates into USD 2025 constant dollars.
Data quick guide
- Commercial logbooks - Marine commercial harvest piece count
- Fish slips - Average weight per piece by species, average dollar per pound by species
- DFO price survey - Price adjustments including bonus payments
- Annual fisheries production schedule - Wholesale value by species
- Internet socio-economic analysis (iSEA) - Recreational fishing (freshwater and tidal) expenditure data by salmon species
5.2 Final-use methodology
This report extends analysis beyond wholesale value (WSV) to capture additional value added within British Columbia, to better reflect the full domestic commercial value of BC’s wild harvested salmon. A species-specific wholesale value is estimated by applying a wholesale value margin to the landed value, which is derived from logbooks, sales slips, and the DFO Price Survey. Wholesale value margins for each species are estimated by dividing the total provincial WSV (from the BC Annual Fish Production Schedule (AFPS)) by the sum of domestic landed value and unprocessed imports. From there, the method allocates WSV to final-use sectors—Household Food Expenditures (HFE), Accommodation and Food Services (AFS), International Exports (INEX), and Interprovincial Exports (IPEX). International export shares are calculated by comparing WSV to detailed trade data adjusted for margins, while the remaining portion of WSV is assigned to domestic sectors using relative shares from Provincial Supply and Use Tables.
For each final-use sector, value-added margins from the Supply and Use Tables are applied to estimate economic indicators occurring beyond the wholesale stage (e.g., GDP, income, employment).
Once each sector’s output is estimated, the results are aggregated to determine the total provincial value added from BC’s salmon harvest, including domestic consumption and the BC-based components of export activity. The incremental value above WSV is then paired with the relevant economic multipliers to estimate resulting GDP, labour income, and employment contributions. This framework provides a repeatable approach for estimating provincial final use value. Limitations include that it relies on simplified sector shares and relatively imprecise export classifications (HS codes can combine different species and/or processing levels).
Retail / domestic consumer use / export comprises
- Accommodation and food service (AFS)
- Businesses that provide short-term lodging and related services, as well as those that prepare and serve food and beverages for immediate consumption.
- Household food expenditure (HFE)
- Purchases of food consumed at home, such as groceries bought from retail outlets.
- Interprovinicial export (IPEX)
- The goods and services produced in one Canadian province or territory and sold to buyers in other provinces or territories.
- International export (INEX)
- The goods and services produced in one Canadian province or territory and sold to buyers in other countries.
5.3 Economic contribution measures
Expenditures in commercial and recreational fisheries have various impacts throughout the economy. There are impacts as a result of the initial expenditures, as well as effects felt downstream in other industries. An economic contribution analysis captures these effects using the initial expenditures/revenues that occur in the respective industry. These contributions include:
- Direct economic impact: measures the impact of the actual expenditures made by establishments operating in the sector.
- Indirect economic impact: measures the economic activity of industries supplying goods and services used by the sector (commercial and recreational). This is also referred to as “supplier industry impact.”
- Induced economic impact: measures the impact on the economy of spending by workers employed as a result of the sector’s activity.
The sum of the direct, indirect, and induced economic impacts is the total contribution of the activity to the economy.
5.4 Input-output (IO) multipliers
An Input-Output (IO) model is used to estimate economic contributions of a sector and generate multipliers. This report uses multipliers from British Columbia’s Fisheries and Aquaculture Sector 2022 Edition, developed by Lillian Hallin Consulting. The economic indicators in this report include:
- Output: total value of all goods and services produced in a specific time period.
- Gross Domestic Product (GDP): value added to the economy by labour and capital used in current productive activities.
- Income: wages, salaries, and benefits earned from productive activities.
- Employment: count of full-time equivalent jobs generated as a result of output in a particular sector.
Output multipliers were used to estimate the indirect and induced contributions of commercial and recreational salmon fishing. Direct output estimates come from primary data sources (commercial landings and sales data, AFPS data net of commercial harvest revenues, surveys of recreational fishing expenditures). Direct, indirect, and induced GDP, income, and employment contributions are the result of applying these multipliers.
For commercial fishing, multipliers are taken from the “Capture Fishery” table on p.71, BC Stats. (2022). “British Columbia’s Fisheries and Aquaculture Sector, 2022 Edition”, with the exception of the direct employment estimates, which are based on an average number of 2.3 crew per troll vessel, 4.5 crew per seine vessel, and 1.5 crew per gill net vessel. The number of crew per type of vessel was taken from the results of DFO’s 2024 Costs and Earnings survey which includes commercial and communal commercial vessels. For commercial seafood processing, multipliers are taken from the “Fish and Seafood Processing” table on p.71, BC Stats. (2022). “British Columbia’s Fisheries and Aquaculture Sector, 2022 Edition”.
For recreational fishing, multipliers are taken from the Sport fishing impacts table on p.72, BC Stats. (2022). “British Columbia’s Fisheries and Aquaculture Sector, 2022 Edition”.
More information about the multipliers used in this report can be found here: British Columbia’s fisheries and aquaculture sector 2022 Edition.
5.5 Additional resources
More information on the commercial and recreational fishing industries can be found on DFO’s Pacific Region economics website: Fisheries economic analyses, reports and profiles. This webpage contains reports, infographics, and summary documents providing detailed information on the different industries for both commercial and recreational fishing.
6. Appendix
A. Commercial salmon sector
Appendix A.1: Commercial sector catch and value - British Columbia salmon fishery (all values in CAD 2025 constant dollars)
| Chinook | Chum | Coho | Pink | Sockeye | ||
|---|---|---|---|---|---|---|
| 2022 | ||||||
| Fish caught (pieces) | Seine (Area A, B) | 13,450 | 88,918 | x | 376,390 | 566,310 |
| Gillnet (Area C,D,E) | 16,984 | 6,573 | 573 | 106,644 | 691,949 | |
| Troll (Area F,G,H) | 84,298 | 4,505 | 105,269 | 88,594 | 15,838 | |
| Other* | 123,095 | 73,314 | 74,558 | 367,783 | 643,201 | |
| Total | 237,827 | 173,310 | 180,400 | 939,411 | 1,917,298 | |
| Weight landed ('000 KG) | 1,408 | 1,007 | 549 | 3,926 | 3,926 | |
| Value | Ex-Vessel $000 | $12,619 | $5,018 | $3,279 | $1,476 | $24,530 |
| Wholesale $000 | $15,900 | $11,239 | $6,000 | $5,623 | $35,078 | |
| Retail $000 | $20,372 | $14,400 | $7,688 | $7,204 | $44,943 | |
| 2023 | ||||||
| Fish caught (pieces) | Seine (Area A, B) | 12,005 | 46,075 | x | 1,224,522 | 167,962 |
| Gillnet (Area C,D,E) | 16,227 | 3,027 | 59 | 149,241 | 286,379 | |
| Troll (Area F,G,H) | 74,087 | x | 120,262 | 172,161 | 645 | |
| Other* | 156,297 | 31,371 | 68,730 | 644,217 | 108,212 | |
| Total | 258,616 | 80,473 | 189,051 | 2,190,141 | 563,198 | |
| Weight landed ('000 KG) | 1,522 | 472 | 532 | 3,726 | 1,206 | |
| Value | Ex-Vessel $000 | $13,840 | $1,074 | $2,680 | $2,145 | $6,724 |
| Wholesale $000 | $17,439 | $2,405 | $4,904 | $8,173 | $9,616 | |
| Retail $000 | $22,343 | $3,081 | $6,283 | $10,471 | $12,320 | |
| 2024 | ||||||
| Fish caught (pieces) | Seine (Area A, B) | 7,927 | 330,531 | x | 1,317,805 | 175,011 |
| Gillnet (Area C,D,E) | 22,147 | 122,919 | 68 | 90,690 | 264,580 | |
| Troll (Area F,G,H) | 100,430 | 37,565 | 90,797 | 87,912 | 359 | |
| Other* | 102,017 | 98,681 | 74,122 | 746,932 | 380,095 | |
| Total | 232,521 | 589,696 | 164,987 | 2,243,339 | 820,045 | |
| Weight landed ('000 KG) | 1,402 | 1,920 | 436 | 1,726 | 1,726 | |
| Value | Ex-Vessel $000 | $15,464 | $5,737 | $1,930 | $3,099 | $9,525 |
| Wholesale $000 | $19,484 | $12,850 | $3,532 | $11,806 | $13,621 | |
| Retail $000 | $24,964 | $16,465 | $4,525 | $15,126 | $17,452 | |
| 2025 | ||||||
| Fish caught (pieces) | Seine (Area A, B) | 11,436 | 266,306 | x | 1,804,869 | 262,617 |
| Gillnet (Area C,D,E) | 24,270 | 77,225 | x | 189,628 | 298,259 | |
| Troll (Area F,G,H) | 100,447 | 4,606 | 52,421 | 38,825 | 4,237 | |
| Other* | 145,034 | 54,286 | 48,101 | 172,963 | 433,862 | |
| Total | 281,187 | 402,423 | 100,522 | 2,206,285 | 998,975 | |
| Weight landed ('000 KG) | 1,632 | 1,501 | 355 | 3,951 | 2,029 | |
| Value | Ex-Vessel $000 | $18,552 | $4,513 | $1,880 | $2,900 | $13,965 |
| Wholesale $000 | $23,375 | $10,110 | $3,4400 | $11,049 | $19,970 | |
| Retail $000 | $29,950 | $12,954 | $4,407 | $14,156 | $25,586 | |
| Average | ||||||
| Fish caught (pieces) | Seine (Area A, B) | 11,205 | 182,958 | 113 | 1,180,897 | 292,975 |
| Gillnet (Area C,D,E) | 19,907 | 52,436 | 178 | 134,051 | 385,292 | |
| Troll (Area F,G,H) | 89,815 | 11,673 | 92,187 | 96,873 | 5,270 | |
| Other* | 131,611 | 64,413 | 66,378 | 482,974 | 391,343 | |
| Total | 252,537 | 311,479 | 158,856 | 1,894,794 | 1,074,879 | |
| Weight landed ('000 KG) | 1,491 | 1,2252 | 468 | 3,326 | 2,222 | |
| Value | Ex-vessel $000 | $15,119 | $4,085 | $2,442 | $2,405 | $13,686 |
| Wholesale $000 | $19,050 | $9,151 | $4,469 | $9,163 | $19,571 | |
| Retail $000 | $24,407 | $11,725 | $5,726 | $11,739 | $25,075 | |
Note: “x” means data is suppressed due to fewer than 5 vessels reporting
*Other includes commercial harvest in fisheries other than Licence Areas A-H: Five Nations CBEF, economic opportunity (EO), demonstration (DEMO), excess salmon to spawning requirement (ESSR), Harvest Agreement (HA) fisheries, and transboundary rivers.
Source: Commercial logbooks and fish slips; DFO Price Survey data; PSC Annual Reports (ESSR, CBEF, EO, demo fisheries, transboundary rivers).
Appendix A.2 Commercial and communal-commercial (“F”) landed volume and value, average 2022 to 2025 (all values in CAD 2025 constant dollars)
Communal commercial licences (“F”) are party-based licences held by First Nations and issued through the ATP/PICFI programs (Allocation Transfer Program/Pacific Integrated Commercial Fisheries Initiative).
| 2022-2025 Annual average | |||||||
|---|---|---|---|---|---|---|---|
| Licence type | Chinook | Chum | Coho | Pink | Sockeye | ||
| Weight landed ('000 KG) | Seine (Area A, B) | F | 2 | 97 | <1 | 256 | 33 |
| Non-F | 58 | 606 | <1 | 1,809 | 538 | ||
| Gillnet (Area C,D,E) | F | 31 | 53 | <1 | 65 | 172 | |
| Non-F | 77 | 148 | 1 | 159 | 650 | ||
| Troll (Area F,G,H) | F | 50 | 6 | 20 | 7 | 2 | |
| Non-F | 526 | 33 | 236 | 177 | 14 | ||
| Other* | 747 | 284 | 210 | 852 | 811 | ||
| Total | 1,492 | 1,227 | 467 | 3,326 | 2,222 | ||
| Ex-Vessel Value $000 | Seine (Area A, B) | F | $21 | $355 | $<1 | $216 | $227 |
| Non-F | $520 | $1,853 | $2 | $1,323 | $3,956 | ||
| Gillnet (Area C,D,E) | F | $298 | $113 | $<1 | $25 | $1,237 | |
| Non-F | $769 | $357 | $6 | $90 | $4,699 | ||
| Troll (Area F,G,H) | F | $715 | $41 | $154 | $21 | $23 | |
| Non-F | $7,395 | $186 | $1,831 | $451 | $120 | ||
| Other* | $5,406 | $1,191 | $450 | $278 | $3,423 | ||
| Total | $15,124 | $4,096 | $2,442 | $2,405 | $13,686 | ||
Note: Marine harvest from License Areas A-H can be labelled as "F" - communal commercial, and "non-F".
Communal commercial licences (“F”) are party-based licences held by First Nations and issued through the ATP/PICFI programs (Allocation Transfer Program/Pacific Integrated Commercial Fisheries Initiative). There are other fisheries that occur outside licence areas A-H. These are listed under "Other" and include: economic opportunity (EO), demonstration (DEMO), excess salmon to spawning requirement (ESSR), Five Nations CBEF, Harvest Agreement (HA), test fisheries, and transboundary rivers.
Note: data in Table A.2 may not equal data in Table A.1 due to licence matching and rounding.
Source: Commercial logbooks and fish slips; DFO Licence data; DFO Price Survey data; PSC Annual Reports (ESSR, CBEF, EO, demo, test fisheries and transboundary rivers).
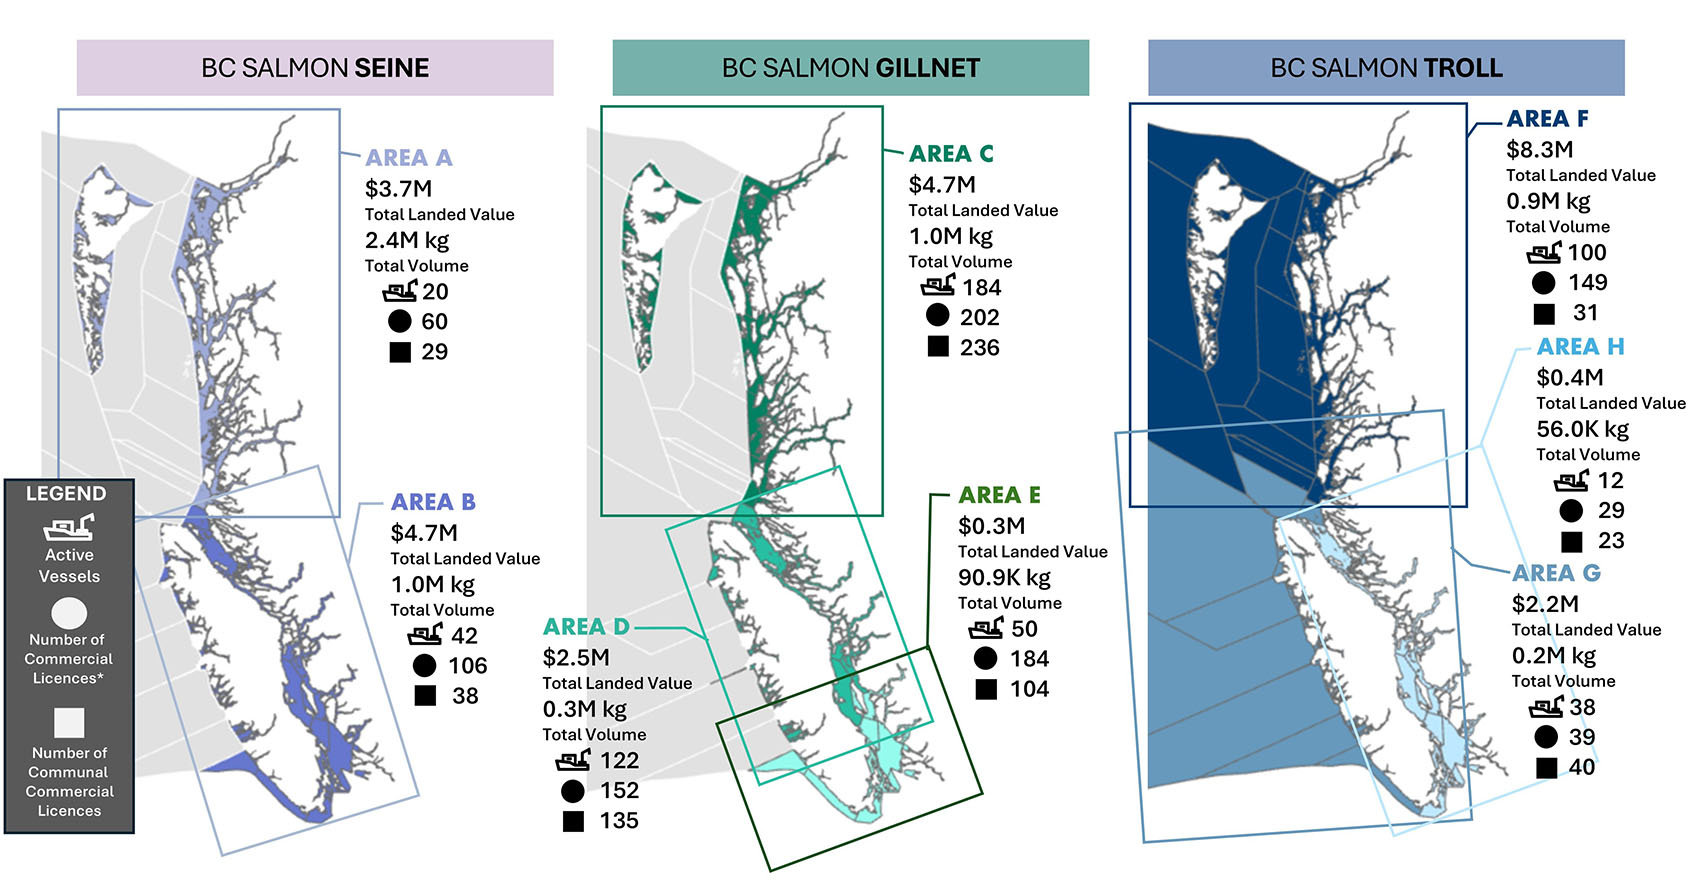
Appendix A.3 British Columbia salmon, commercial marine landed value and volume by gear type and licence area, 2022 to 2025 average (all values in CAD 2025 constant dollars)
Long text version
| Area A | Area B | |
|---|---|---|
| Total landed value | $3.7M | $4.7M |
| Total volume | 2.4M kg | 1.0M kg |
| Active vessels | 20 | 42 |
| Number of commercial licences | 60 | 106 |
| Number of communal commercial licences | 29 | 38 |
| Area C | Area D | Area E | |
|---|---|---|---|
| Total landed value | $4.7M | $2.5M | $0.3M |
| Total volume | 1.0M kg | 0.3M kg | 90.9K kg |
| Active vessels | 184 | 122 | 50 |
| Number of commercial licences | 202 | 152 | 184 |
| Number of communal commercial licences | 236 | 135 | 104 |
| Area F | Area H | Area G | |
|---|---|---|---|
| Total landed value | $8.3M | $2.2M | $0.4M |
| Total volume | 0.9M kg | 0.2M kg | 56.0K kg |
| Active vessels | 100 | 38 | 12 |
| Number of commercial licences | 149 | 39 | 29 |
| Number of communal commercial licences | 31 | 40 | 23 |
Appendix A.4 Commercial salmon economic contribution by sector – British Columbia (all values in CAD 2025 constant dollars)
| Direct output of the sector $000 | Direct | Indirect | Induced | Total | |||||||||
|---|---|---|---|---|---|---|---|---|---|---|---|---|---|
| GDP $000 | Labour income $000 | Employ- ment |
GDP $000 | Labour income $000 | Employ- ment |
GDP $000 | Labour income $000 | Employ- ment |
GDP $000 | Labour income $000 | Employ- ment |
||
| 2022 | |||||||||||||
| Fishing | $46,921 | $25,028 | $16,314 | 1,171 | $6,353 | $4,077 | 54 | $2,614 | $1,910 | 17 | $33,994 | $22,302 | 1,242 |
| Processing | $26,919 | $5,747 | $3,968 | 88 | $6,703 | $4,003 | 51 | $1,362 | $996 | 9 | $13,812 | $8,967 | 148 |
| Retail and trade | $20,767 | $11,094 | $8,448 | 222 | $4,721 | $2,466 | 34 | $5,261 | $1,824 | 33 | $21,076 | $12,737 | 290 |
| Total | $94,607 | $41,869 | $28,730 | 1,481 | $17,777 | $10,546 | 140 | $9,236 | $4,729 | 59 | $68,883 | $44,006 | 1,680 |
| 2023 | |||||||||||||
| Fishing | $26,463 | $14,115 | $9,201 | 995 | $3,583 | $2,300 | 30 | $1,474 | $1,077 | 9 | $19,172 | $12,578 | 1,035 |
| Processing | $16,073 | $3,432 | $2,369 | 52 | $4,002 | $2,390 | 31 | $813 | $595 | 5 | $8,247 | $5,354 | 88 |
| Retail and trade | $11,963 | $6,391 | $4,867 | 128 | $2,720 | $1,420 | 20 | $3,030 | $1,050 | 19 | $12,141 | $7,337 | 167 |
| Total | $54,499 | $23,938 | $16,437 | 1,175 | $10,305 | $6,110 | 81 | $5,318 | $2,722 | 34 | $39,561 | $25,269 | 1,290 |
| 2024 | |||||||||||||
| Fishing | $35,754 | $19,071 | $12,432 | 945 | $4,841 | $3,107 | 41 | $1,992 | $1,455 | 13 | $25,904 | $16,994 | 999 |
| Processing | $25,539 | $5,453 | $3,764 | 83 | $6,359 | $3,798 | 49 | $1,292 | $945 | 8 | $13,104 | $8,507 | 140 |
| Retail and trade | $17,238 | $9,209 | $7,012 | 184 | $3,919 | $2,047 | 29 | $4,367 | $1,514 | 28 | $17,495 | $10,573 | 241 |
| Total | $78,531 | $33,733 | $23,209 | 1,213 | $15,119 | $8,951 | 118 | $7,650 | $3,914 | 49 | $56,503 | $36,074 | 1,380 |
| 2025 | |||||||||||||
| Fishing | $41,810 | $22,301 | $14,537 | 1,079 | $5,661 | $3,633 | 48 | $2,329 | $1,702 | 15 | $30,291 | $19,872 | 1,142 |
| Processing | $26,134 | $5,580 | $3,852 | 85 | $6,507 | $3,886 | 50 | $1,322 | $967 | 8 | $13,409 | $8,705 | 144 |
| Retail and trade | $19,109 | $10,208 | $7,773 | 204 | $4,344 | $2,269 | 32 | $4,841 | $1,678 | 31 | $19,393 | $11,720 | 267 |
| Total | $87,053 | $38,089 | $26,163 | 1,368 | $16,513 | $9,788 | 130 | $8,492 | $4,347 | 54 | $63,094 | $40,298 | 1,552 |
| Average | |||||||||||||
| Fishing | $37,737 | $20,129 | $13,121 | 1,048 | $5,110 | $3,279 | 43 | $2,102 | $1,536 | 13 | $27,341 | $17,936 | 1,104 |
| Processing | $23,666 | $5,053 | $3,488 | 77 | $5,893 | $3,519 | 45 | $1,198 | $876 | 8 | $12,143 | $7,883 | 130 |
| Retail and trade | $17,269 | $9,226 | $7,025 | 185 | $3,926 | $2,050 | 29 | $4,375 | $1,516 | 28 | $17,526 | $10,592 | 241 |
| Total | $78,673 | $34,407 | $23,635 | 1,310 | $14,929 | $8,849 | 117 | $7,674 | $3,928 | 49 | $57,010 | $36,412 | 1,476 |
Source: Commercial logbooks and fish slips; DFO Price Survey data; British Columbia’s Fisheries and Aquaculture Sector (2022 edition); Statistics Canada Provincial Supply and Use tables (2022).
Appendix A.5 Commercial salmon economic contribution by species in British Columbia all values in CAD 2025 constant dollars
| Commercial fishing contributions (2022-2025 Avg) | Total output $000 | Direct output by sector $000 | Direct | Indirect | Induced | Total | ||||||||
|---|---|---|---|---|---|---|---|---|---|---|---|---|---|---|
| GDP $000 | Labour income $000 | Employ- ment |
GDP $000 | Labour income $000 | Employ- ment |
GDP $000 | Labour income $000 | Employ- ment |
GDP $000 | Labour income $000 | Employ- ment |
|||
| Chinook | ||||||||||||||
| Fishing | $15,119 | $8,064 | $5,257 | 600 | $2,047 | $1,314 | 17 | $842 | $615 | 5 | $10,954 | $7,186 | 623 | |
| Processing | $3,931 | $839 | $579 | 13 | $979 | $585 | 8 | $199 | $145 | 1 | $2,017 | $1,309 | 22 | |
| Retail | $3,382 | $2,182 | $1,792 | 52 | $637 | $334 | 5 | $1,025 | $354 | 7 | $3,845 | $2,480 | 63 | |
| Trade | $1,976 | $680 | $387 | 6 | $581 | $302 | 4 | $332 | $117 | 2 | $1,593 | $806 | 12 | |
| Total | $24,407 | $24,407 | $11,7669 | $8,016 | 670 | $4,244 | $2,534 | 34 | $2,398 | $1,231 | 15 | $18,408 | $11,781 | 719 |
| Chum | ||||||||||||||
| Fishing | $4,085 | $2,179 | $1,420 | 352 | $553 | $355 | 5 | $228 | $166 | 1 | $2,960 | $1,942 | 358 | |
| Processing | $5,066 | $1,082 | $747 | 17 | $1,261 | $753 | 10 | $256 | $187 | 2 | $2,599 | $1,687 | 28 | |
| Retail | $1,624 | $1,048 | $861 | 25 | $306 | $160 | 2 | $492 | $170 | 3 | $1,847 | $1,191 | 30 | |
| Trade | $949 | $327 | $186 | 3 | $279 | $145 | 2 | $159 | $56 | 1 | $765 | $387 | 6 | |
| Total | $11,725 | $11,725 | $4,636 | $3,214 | 396 | $2,400 | $1,414 | 19 | $1,136 | $580 | 7 | $8,171 | $5,208 | 422 |
| Coho | ||||||||||||||
| Fishing | $2,442 | $1,303 | $849 | 287 | $331 | $212 | 3 | $136 | $99 | 1 | $1,769 | $1,161 | 291 | |
| Processing | $2,027 | $433 | $299 | 7 | $505 | $301 | 4 | $103 | $75 | 1 | $1,040 | $675 | 11 | |
| Retail | $793 | $512 | $420 | 12 | $149 | $78 | 1 | $241 | $83 | 2 | $902 | $582 | 15 | |
| Trade | $464 | $159 | $91 | 1 | $136 | $71 | 1 | $78 | $27 | 0 | $374 | $189 | 3 | |
| Total | $5,726 | $5,726 | $2,407 | $1,659 | 307 | $1,121 | $663 | 9 | $557 | $285 | 4 | $4,085 | $2,607 | 319 |
| Pink | ||||||||||||||
| Fishing | $2,405 | $1,283 | $836 | 599 | $326 | $209 | 3 | $134 | $98 | 1 | $1,742 | $1,143 | 603 | |
| Processing | $6,758 | $1,443 | $996 | 22 | $1,683 | $1,005 | 13 | $342 | $250 | 2 | $3,467 | $2,251 | 37 | |
| Retail | $1,627 | $1,050 | $862 | 25 | $306 | $161 | 2 | $493 | $170 | 3 | $1,849 | $1,193 | 30 | |
| Trade | $950 | $327 | $186 | 3 | $279 | $145 | 2 | $160 | $56 | 1 | $766 | $388 | 6 | |
| Total | $11,739 | $11,739 | $4,102 | $2,881 | 649 | $2,594 | $1,520 | 20 | $1,129 | $574 | 7 | $7,825 | $4,975 | 676 |
| Sockeye | ||||||||||||||
| Fishing | $13,686 | $7,300 | $4,759 | 648 | $1,853 | $1,189 | 16 | $762 | $557 | 5 | $9,916 | $6,505 | 669 | |
| Processing | $5,885 | $1,256 | $867 | 19 | $1,465 | $875 | 11 | $298 | $218 | 2 | $3,020 | $1,960 | 32 | |
| Retail | $3,474 | $2,242 | $1,841 | 53 | $655 | $343 | 5 | $1,053 | $364 | 7 | $3,950 | $2,548 | 65 | |
| Trade | $2,030 | $698 | $398 | 6 | $597 | $311 | 4 | $341 | $120 | 2 | $1,636 | $828 | 12 | |
| Sockeye total | $25,075 | $25,075 | $11,497 | $7,865 | 726 | $4,570 | $2,718 | 36 | $2,454 | $1,258 | 16 | $18,521 | $11,841 | 778 |
| All species | ||||||||||||||
| Combined total | $78,673 | $78,673 | $34,407 | $23,635 | 1,310 | $14,929 | $8,849 | 117 | $7,674 | $3,928 | 49 | $57,010 | $36,412 | 1,476 |
Note: Table shows 2022 to 2025 average. Direct fishing employment for the commercial sector is calculated using active vessels by gear type and average crew per vessel for each species. Since a vessel can fish multiple species, there will be some double counting of employment at the species level.
Source: Commercial logbooks and fish slips; DFO Price Survey data; British Columbia’s Fisheries and Aquaculture Sector (2022 edition); Statistics Canada Provincial Supply and Use tables (2022).
Recreational salmon fishing
Appendix B.1 Recreational salmon economic contribution by trip type, freshwater and tidal - British Columbia (All values in CAD 2025 constant dollars)
| Total expenditure by recreational fishers $000 | Direct | Indirect | Induced | Total | |||||||||
|---|---|---|---|---|---|---|---|---|---|---|---|---|---|
| GDP $000 | Labour income $000 | Employ- ment |
GDP $000 | Labour income $000 | Employ- ment |
GDP $000 | Labour income $000 | Employ- ment |
GDP $000 | Labour income $000 | Employ- ment |
||
| 2022 | |||||||||||||
| For hire | $118,188 | $41,484 | $27,561 | 482 | $15,955 | $10,495 | 132 | $8,060 | $5,886 | 52 | $65,500 | $43,942 | 665 |
| Private | $302,113 | $106,042 | $70,453 | 1,232 | $40,785 | $26,828 | 337 | $20,604 | $15,045 | 132 | $167,431 | $112,326 | 1,700 |
| Shore-based | $51,495 | $18,075 | $12,009 | 210 | $6,952 | $4,573 | 57 | $3,512 | $2,564 | 22 | $28,539 | $19,146 | 290 |
| All | $471,796 | $165,601 | $110,023 | 1,924 | $63,693 | $41,896 | 526 | $32,177 | $23,495 | 206 | $261,470 | $175,414 | 2,655 |
| 2023 | |||||||||||||
| For hire | $114,894 | $40,328 | $26,793 | 468 | $15,511 | $10,203 | 128 | $7,836 | $5,722 | 50 | $63,674 | $42,718 | 647 |
| Private | $294,915 | $103,515 | $68,774 | 1,202 | $39,814 | $26,188 | 329 | $20,113 | $14,687 | 129 | $163,442 | $109,649 | 1,660 |
| Shore-based | $48,400 | $16,988 | $11,287 | 197 | $6,534 | $4,298 | 54 | $3,301 | $2,410 | 21 | $26,823 | $17,995 | 272 |
| All | $458,209 | $160,831 | $106,854 | 1,868 | $61,858 | $40,689 | 510 | $31,250 | $22,819 | 200 | $253,939 | $170,362 | 2,579 |
| 2024 | |||||||||||||
| For hire | $114,172 | $40,074 | $26,625 | 466 | $15,413 | $10,138 | 127 | $7,787 | $5,686 | 50 | $63,274 | $42,449 | 643 |
| Private | $301,796 | $105,930 | $70,379 | 1,231 | $40,742 | $26,800 | 336 | $20,583 | $15,029 | 132 | $167,255 | $112,208 | 1,699 |
| Shore-based | $48,265 | $16,941 | $11,255 | 197 | $6,516 | $4,286 | 54 | $3,292 | $2,404 | 21 | $26,748 | $17,945 | 272 |
| All | $464,233 | $162,946 | $108,259 | 1,893 | $62,671 | $41,224 | 517 | $31,661 | $23,119 | 203 | $257,278 | $172,602 | 2,613 |
| 2025 | |||||||||||||
| For hire | $116,897 | $41,031 | $27,260 | 477 | $15,781 | $10,380 | 130 | $7,972 | $5,821 | 51 | $64,785 | $43,462 | 658 |
| Private | $332,661 | $116,764 | $77,577 | 1,356 | $44,909 | $29,540 | 371 | $22,687 | $16,567 | 145 | $184,361 | $123,683 | 1,872 |
| Shore-based | $78,242 | $27,463 | $18,246 | 319 | $10,563 | $6,948 | 87 | $5,336 | $3,896 | 34 | $43,361 | $29,090 | 440 |
| All | $527,800 | $185,258 | $123,083 | 2,152 | $71,253 | $46,869 | 588 | $35,996 | 26,284 | 230 | $292,507 | $196,236 | 2,970 |
| Average | |||||||||||||
| For hire | $116,038 | $40,729 | $27,060 | 473 | $15,665 | $10,304 | 129 | $7,914 | $5,779 | 51 | $64,308 | $43,143 | 653 |
| Private | $307,871 | $108,063 | $71,796 | 1,255 | $41,563 | $27,339 | 343 | $20,997 | $15,332 | 134 | $170,622 | $114,467 | 1,733 |
| Shore-based | $56,600 | $19,867 | $13,199 | 231 | $7,641 | $5,026 | 63 | $3,860 | $2,819 | 25 | $31,368 | $21,044 | 319 |
| All | $480,510 | $168,659 | $112,055 | 1,959 | $64,869 | $42,669 | 535 | $32,771 | $23,929 | 210 | $266,298 | $178,653 | 2,704 |
*Tidal water survey results are available for 2022–2023 and 2025. The 2024 tidal water expenditure is estimated using the average of the 2022, 2023, and 2025 figures.
Source: DFO iSEA Recreational Surveys, multiple years; British Columbia’s Fisheries and Aquaculture Sector (2022 edition).
Appendix B.2 Recreational salmon economic contribution by species - British Columbia (All values in CAD 2025 constant dollars)
| Recreational fishing contributions (2022-2025 Avg) | Total expenditure by recreational fishers $000 | Direct | Indirect | Induced | Total | ||||||||
|---|---|---|---|---|---|---|---|---|---|---|---|---|---|
| GDP $000 | Labour income $000 | Employ- ment |
GDP $000 | Labour income $000 | Employ- ment |
GDP $000 | Labour income $000 | Employ- ment |
GDP $000 | Labour income $000 | Employ- ment |
||
| Freshwater | |||||||||||||
| Chinook | $18,563 | $6,516 | $4,329 | 76 | $2,506 | $1,648 | 21 | $1,266 | $924 | 8 | $10,288 | $6,902 | 104 |
| Coho | $29,998 | $10,529 | $6,996 | 122 | $4,050 | $2,664 | 33 | $2,046 | $1,494 | 13 | $16,625 | $11,153 | 169 |
| Pink or chum | $17,784 | $6,242 | $4,147 | 73 | $2,401 | $1,579 | 20 | $1,213 | $886 | 8 | $9,856 | $6,612 | 100 |
| Sockeye | $10,651 | $3,738 | $2,484 | 43 | $1,438 | $9460 | 12 | $726 | $530 | 5 | $5,903 | $3,960 | 60 |
| Total | $76,997 | $27,026 | $17,956 | 314 | $10,395 | $6,837 | 86 | $5,251 | $3,834 | 34 | $42,672 | $28,627 | 433 |
| Tidal water | |||||||||||||
| Chinook | $220,213 | $77,295 | $51,354 | 898 | $29,729 | $19,555 | 245 | $15,019 | $10,967 | 96 | $122,042 | $81,875 | 1,239 |
| Coho | $144,653 | 50,773 | $33,733 | 590 | $19,528 | $12,845 | 161 | $9,865 | $7,204 | 634 | $80,167 | $53,782 | 814 |
| Pink or chum | $28,266 | $9,921 | $6,592 | 115 | $3,816 | $2,510 | 31 | $1,928 | $1,408 | 12 | $15,665 | $10,509 | 159 |
| Sockeye | $10,380 | $3,644 | $2,421 | 42 | $1,401 | $922 | 12 | $708 | $517 | 5 | $5,753 | $3,859 | 58 |
| Total | $403,513 | $141,633 | $94,099 | 1,645 | $54,474 | $35,832 | 450 | $27,520 | $20,095 | 176 | $223,627 | $150,026 | 2,271 |
| Total | |||||||||||||
| Chinook | $238,776 | $83,810 | $55,683 | 974 | $32,235 | $21,203 | 266 | $16,285 | $11,891 | 104 | $132,330 | $88,777 | 1,344 |
| Coho | $174,652 | $61,303 | $40,729 | 712 | $23,578 | $15,509 | 195 | $11,911 | $8,698 | 76 | $96,792 | $64,936 | 983 |
| Pink or chum | $46,051 | $16,164 | $10,739 | 188 | $6,217 | $4,089 | 51 | $3,141 | $2,293 | 20 | $25,521 | $17,122 | 259 |
| Sockeye | $21,031 | $7,382 | $4,904 | 86 | $2,839 | $1,868 | 23 | $1,434 | $1,047 | 9 | $11,655 | $7,819 | 118 |
| Total | $480,510 | $168,659 | $112,055 | 1,959 | $64,869 | $42,669 | 535 | $32,771 | $23,929 | 210 | $266,298 | $178,653 | 2,704 |
*Tidal water survey results are available for 2022–2023 and 2025. The 2024 tidal water expenditure is estimated using the average of the 2022, 2023, and 2025 figures.
Source: DFO iSEA Recreational Surveys, multiple years; British Columbia’s Fisheries and Aquaculture Sector (2022 edition).
Figure B.1: Top water bodies for freshwater salmon fishing, 2025 (all values in CAD 2025 constant dollars)
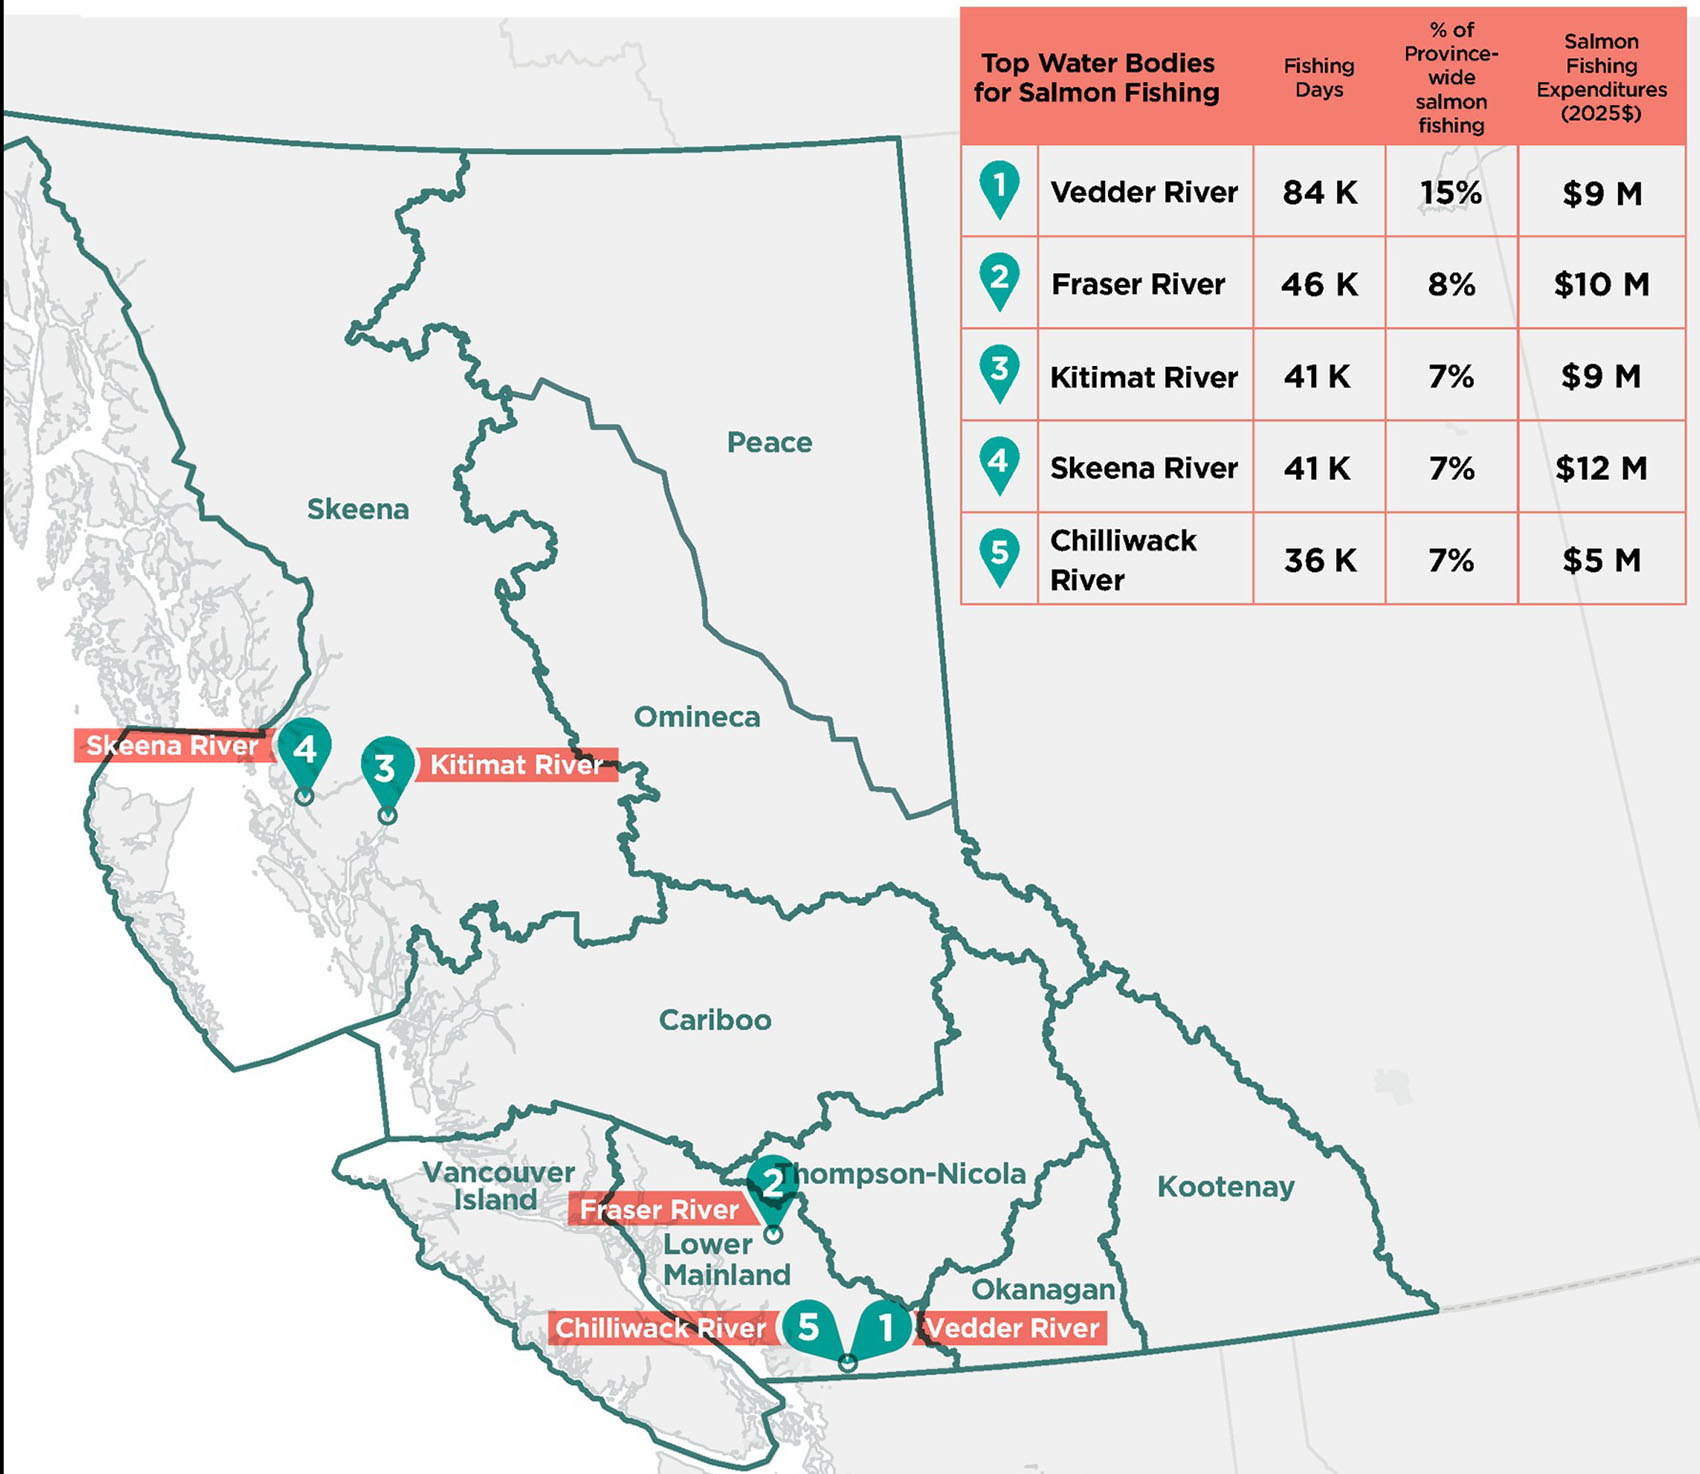
Source: iSEA freshwater recreational fishing survey, 2025.
Long text version
Top water bodies for freshwater salmon fishing, 2025
(All values in CAD 2025 constant dollars)
In 2025, the top waterbodies for freshwater salmon fishing, as well as their fishing days and expenditures were as follows:
Vedder River (Lower Mainland)
- Salmon fishing days: 84 K
- % of province-wide salmon fishing: 15%
- Salmon expenditures: $9 M
Fraser River (Lower Mainland)
- Salmon fishing days: 46 K
- % of province-wide salmon fishing: 8%
- Salmon expenditures: $10 M
Kitimat River
- Salmon fishing days: 41 K
- % of province-wide salmon fishing: 7%
- Salmon expenditures: $9 M
Skeena River (Skeena):
- Salmon fishing days: 41 K
- % of province-wide salmon fishing: 7%
- Salmon expenditures: $12 M
Chilliwack River (Lower Mainland)
- Salmon fishing days: 36 K
- % of province-wide salmon fishing: 7%
- Salmon expenditures: $5 M
Figure B.2: Salmon expenditures by PFMA for tidal water fishing (average 2022-2025)
All values are in CAD 2025 constant dollars
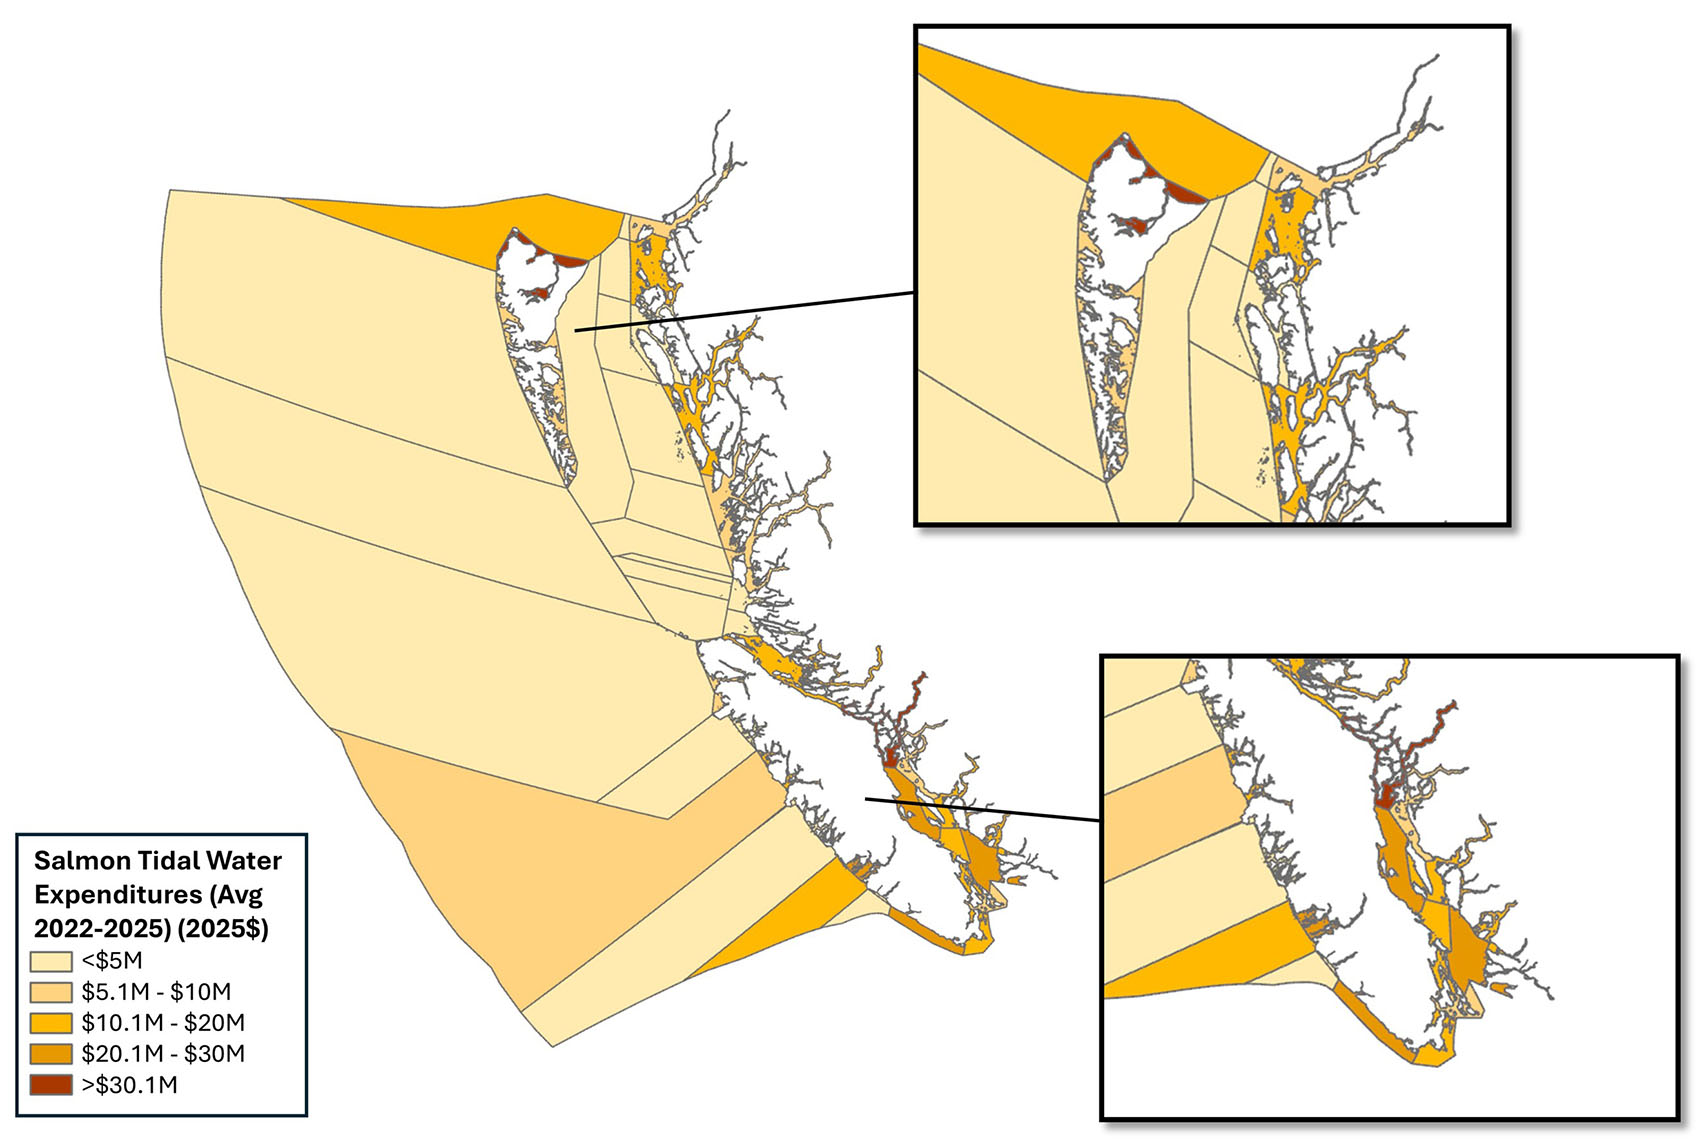
Source: iSEA Tidal Recreational Fishing Survey, 2022, 2023 and 2025. 2024 annual expenditures estimated as average of 2022, 2023 and 2025.
Long text version
Salmon expenditures by PFMA for tidal water fishing (average 2022-2025)
(All values in CAD 2025 constant dollars)
Less than $5 million: PFMA 5, PFMA 10, PFMA 11, PFMA 21, PFMA 22, PFMA 24, PFMA 26, PFMA 102, PFMA 103, PFMA 104, PFMA 105, PFMA 106, PFMA 107, PFMA 108, PFMA 109, PFMA 110, PFMA 111, PFMA 121, PFMA 124, PFMA 126, PFMA 127, PFMA 130, PFMA 142
$5.1 million to $10 million: PFMA 2, PFMA 3, PFMA 7, PFMA 8, PFMA 9, PFMA 15, PFMA 18, PFMA 27, PFMA 125
$10.1 million to $20 million: PFMA 4, PFMA 6, PFMA 12, PFMA 16, PFMA 17, PFMA 19, PFMA 25, PFMA 28, PFMA 101, PFMA 123
$20.1 million to $30 million: PFMA 14, PFMA 20, PFMA 23, PFMA 29
More than $30.1 million: PFMA 1, PFMA 13
C: Tables expressed in USD 2025 constant dollars
Appendix C.1: Commercial sector catch and value chain - British Columbia salmon fishery
All values in US 2025 constant dollars
| 2022 | 2023 | 2024 | 2025 | Average | ||
|---|---|---|---|---|---|---|
| Fish caught (pieces) | Chinook | 237,827 | 258,616 | 232,521 | 281,187 | 252,537 |
| Chum | 173,310 | 80,487 | 589,696 | 402,423 | 311,479 | |
| Coho | 180,444 | 189,299 | 165,143 | 100,538 | 158,856 | |
| Pink | 939,411 | 2,190,141 | 2,243,339 | 2,206,285 | 1,894,794 | |
| Sockeye | 1,917,298 | 563,198 | 820,045 | 998,975 | 1,074,879 | |
| Total | 3,448,289 | 3,281,741 | 4,050,744 | 3,989,408 | 3,692,545 | |
| Weight Landed ('000 KG) | Chinook | 1,408 | 1,522 | 1,402 | 1,632 | 1,491 |
| Chum | 1,007 | 472 | 1,920 | 1,501 | 1,225 | |
| Coho | 549 | 532 | 436 | 355 | 468 | |
| Pink | 1,641 | 3,726 | 3,986 | 3,951 | 3,326 | |
| Sockeye | 3,926 | 1,206 | 1,726 | 2,029 | 2,222 | |
| Total | 8,530 | 7,458 | 9,470 | 9,467 | 8,731 | |
| Ex-vessel values $000 | Chinook | $9,903 | $10,258 | $11,323 | $13,272 | $11,189 |
| Chum | $3,938 | $796 | $4,201 | $3,229 | $3,041 | |
| Coho | $2,573 | $1,986 | $1,413 | $1,345 | $1,829 | |
| Pink | $1,158 | $1,590 | $2,269 | $1,773 | $1,773 | |
| Sockeye | $19,251 | $4,984 | $6,975 | $9,991 | $10,300 | |
| Total | $36,823 | $19,613 | $26,181 | $29,911 | $28,132 | |
| Wholesale value $000 | Chinook | $12,478 | $12,925 | $14,267 | $16,723 | $14,098 |
| Chum | $8,821 | $1,782 | $9,410 | $7,233 | $6,811 | |
| Coho | $4,709 | $3,635 | $2,586 | $2,461 | $3,348 | |
| Pink | $4,413 | $6,057 | $8,645 | $7,905 | $6,755 | |
| Sockeye | $27,528 | $7,127 | $9,974 | $14,287 | $14,729 | |
| Total | $57,949 | $31,526 | $44,881 | $48,608 | $45,741 | |
| Retail value $000 | Chinook | $15,988 | $16,560 | $18,280 | $21,426 | $18,063 |
| Chum | $8,727 | $2,284 | $12,056 | $9,267 | $8,727 | |
| Coho | $6,033 | $4,657 | $3,314 | $3,153 | $4,289 | |
| Pink | $5,654 | $7,761 | $11,076 | $10,128 | $8,655 | |
| Sockeye | $35,270 | $9,131 | $12,779 | $18,305 | $18,871 | |
| Total | $74,246 | $40,392 | $57,504 | $62,279 | $58,605 | |
Note: The corresponding table expressed in CAD 2025 constant dollars is presented in Table 3.1 (page 8).
Source: Commercial logbooks and fish slips (commercial and communal commercial harvest); DFO Price Survey data; Pacific Salmon Commission (PSC) Annual Reports (ESSR, CBEF, EO, demo fisheries, and transboundary rivers), Annual Fisheries Production Schedule (wholesale value), Statistics Canada Supply Use Tables (retail value).
Appendix C.2: Commercial salmon economic contributions
All values in USD 2025 constant dollars
| 2022 | 2023 | 2024 | 2025 | Average | ||
|---|---|---|---|---|---|---|
| Direct | Output $000 | $74,246 | $40,392 | $57,504 | $62,279 | $58,605 |
| GDP $000 | $32,858 | $17,742 | $24,701 | $27,250 | $25,638 | |
| Labour income $000 | $22,547 | $12,182 | $16,994 | $18,717 | $17,610 | |
| Employment | 1,481 | 1,175 | 1,213 | 1,368 | 1,310 | |
| Indirect | GDP $000 | $13,951 | $7,638 | $11,071 | $11,814 | $11,118 |
| Labour income $000 | $8,276 | $4,529 | $6,555 | $7,003 | $6,590 | |
| Employment | 140 | 81 | 118 | 130 | 117 | |
| Induced | GDP $000 | $7,248 | $3,941 | $5,602 | $6,075 | $5,717 |
| Labour income $000 | $3,711 | $2,018 | $2,866 | $3,110 | $2,926 | |
| Employment | 59 | 34 | 49 | 54 | 49 | |
| Total | GDP $000 | $54,058 | $29,321 | $41,374 | $45,138 | $42,473 |
| Labour income $000 | $34,535 | $18,728 | $26,415 | $28,829 | $27,127 | |
| Employment | 1,680 | 1,290 | 1,380 | 1,552 | 1,476 | |
Note: The corresponding table expressed in CAD 2025 constant dollars is presented in Table 3.2 (page 11)
Source: Commercial logbooks and fish slips; DFO Price Survey data; PSC Annual Reports; British Columbia’s Fisheries and Aquaculture Sector (2022 edition).
Appendix C.3: Commercial salmon economic contributions by sector
All values in USD 2025 constant dollars
| Direct output of the sector $000 | Total economic contribution | ||||
|---|---|---|---|---|---|
| GDP $000 | Labour income $000 | Employment | |||
| 2022 | Fishing | $36,823 | $26,678 | $17,502 | 1,242 |
| Processing | $21,126 | $10,840 | $7,037 | 148 | |
| Retail and trade | $16,298 | $16,540 | $9,996 | 290 | |
| Total | $74,246 | $54,058 | $34,535 | 1,680 | |
| 2023 | Fishing | $19,613 | $14,210 | $9,322 | 1,035 |
| Processing | $11,913 | $6,112 | $3,968 | 88 | |
| Retail and trade | $8,866 | $8,998 | $5,438 | 167 | |
| Total | $40,392 | $29,321 | $18,728 | 1,290 | |
| 2024 | Fishing | $26,181 | $18,968 | $12,444 | 999 |
| Processing | $18,701 | $9,595 | $6,229 | 140 | |
| Retail and trade | $12,622 | $12,810 | $7,742 | 241 | |
| Total | $57,504 | $41,374 | $26,415 | 1,380 | |
| 2025 | Fishing | $29,911 | $21,671 | $14,217 | 1,142 |
| Processing | $18,697 | $9,593 | $6,228 | 144 | |
| Retail and trade | $13,671 | $13,874 | $8,385 | 267 | |
| Total | $62,279 | $45,138 | $28,829 | 1,552 | |
| Average | Fishing | $28,132 | $20,382 | $13,371 | 1,104 |
| Processing | $17,609 | $9,035 | $5,866 | 130 | |
| Retail and trade | $12,864 | $13,056 | $7,890 | 241 | |
| Total | $58,605 | $42,473 | $27,127 | 1,476 | |
Note: The corresponding table expressed in CAD 2025 constant dollars is presented in Table 3.3 (page 13).
Source: Commercial logbooks and fish slips; DFO Price Survey data; PSC Annual Reports; British Columbia’s Fisheries and Aquaculture Sector (2022 edition); Statistics Canada Provincial Supply and Use Tables (2022).
Appendix C.4: Recreational sector expenditures by trip type, 2022-2025
All values in USD 2025 constant dollars
| Salmon angling expenditures $000 (2024$) | 2022 | 2023 | 2024* | 2025 | Average | |
|---|---|---|---|---|---|---|
| Freshwater | For hire | $7,649 | $6,519 | $4,786 | $6,103 | $6,264 |
| Private | $18,941 | $17,398 | $13,015 | $21,471 | $17,707 | |
| Shore-based | $30,601 | $27,190 | $26,660 | $47,854 | $33,076 | |
| All | $57,191 | $51,107 | $44,462 | $75,429 | $57,047 | |
| Tidal water | For hire | $85,103 | $78,635 | $78,815 | $77,526 | $80,020 |
| Private | $218,152 | $201,179 | $207,972 | $216,518 | $210,955 | |
| Shore-based | $9,811 | $8,682 | $8,681 | $8,120 | $8,824 | |
| All | $313,067 | $288,497 | $295,468 | $302,164 | $299,799 | |
| Total | For hire | $92,752 | $85,154 | $83,601 | $83,630 | $86,284 |
| Private | $237,094 | $218,578 | $220,987 | $237,989 | $228,662 | |
| Shore-based | $40,413 | $35,872 | $35,341 | $55,975 | $41,900 | |
| All | $370,259 | $339,604 | $339,930 | $377,593 | $356,846 | |
Note: The corresponding table expressed in CAD 2025 constant dollars is presented in Table 4.2 (page 15).
*Tidal water survey results are available for 2022–2023 and 2025. The 2024 tidal water expenditure is estimated using the average of the 2022, 2023, and 2025 figures.
Source: DFO Internet Socioeconomic Analysis (iSEA) Recreational Surveys, multiple years.
Appendix C.5: Recreational expenditures by species, 2022-2025
All values in USD 2025 constant dollars
| Salmon angling expenditures $000 | 2022 | 2023 | 2024* | 2025 | Average | |
|---|---|---|---|---|---|---|
| Freshwater | Chinook | $16,017 | $12,485 | $10,979 | $15,742 | $13,806 |
| Coho | $21,997 | $19,676 | $18,380 | $28,843 | $22,224 | |
| Pink or chum | $10,557 | $12,881 | $9,804 | $19,256 | $13,125 | |
| Sockeye | $8,620 | $6,065 | $5,299 | $11,588 | $7,893 | |
| All | $57,191 | $51,107 | $44,462 | $75,429 | $57,047 | |
| Tidal water | Chinook | $178,607 | $156,000 | $161,249 | $159,228 | $163,771 |
| Coho | $107,447 | $100,576 | $105,921 | $115,428 | $107,343 | |
| Pink or chum | $18,154 | $24,650 | $20,698 | $20,324 | $20,956 | |
| Sockeye | $8,859 | $7,271 | $7,6019 | $7,184 | $7,729 | |
| All | $313,067 | $288,497 | $295,468 | $302,164 | $299,799 | |
| Total | Chinook | $194,624 | $168,485 | $172,227 | $174,970 | $177,577 |
| Coho | $129,443 | $120,252 | $124,300 | $144,271 | $129,567 | |
| Pink or chum | $28,711 | $37,531 | $30,502 | $39,580 | $34,081 | |
| Sockeye | $17,480 | $13,336 | $12,900 | $18,772 | $15,622 | |
| All | $370,259 | $339,604 | $339,930 | $377,593 | $356,846 | |
Note: The corresponding table expressed in CAD 2025 constant dollars is presented in Table 4.3 (page 16).
*Tidal water survey results are available from 2021 to 2023, and freshwater survey results are available from 2022 to 2024. The 2021 freshwater expenditure is estimated using the average of the 2022 to 2024 figures. The 2024 tidal water expenditure is estimated using the average of the 2021 to 2023 figures.
Source: DFO iSEA Recreational Surveys, multiple years.
Appendix C.6: Recreational salmon sector economic contributions, 2022-2025
All values in USD 2025 constant dollars
| Direct expenditure by recreational fishers $000 |
Total economic impact | ||||
|---|---|---|---|---|---|
| GDP $000 | Labour income $000 | Employment | |||
| 2022 | For hire | $92,752 | $51,403 | $34,485 | 665 |
| Private | $237,094 | $131,397 | $88,151 | 1,700 | |
| Shore based | $40,413 | $22,397 | $15,025 | 290 | |
| All | $370,259 | $205,197 | $137,662 | 2,655 | |
| 2023 | For hire | $85,154 | $47,192 | $31,660 | 647 |
| Private | $218,578 | $121,136 | $81,267 | 1,660 | |
| Shore based | $35,872 | $19,880 | $13,337 | 272 | |
| All | $339,604 | $188,208 | $126,265 | 2,579 | |
| 2024 | For hire | $83,601 | $46,332 | $31,083 | 643 |
| Private | $220,987 | $122,471 | $82,163 | 1,699 | |
| Shore based | $35,341 | $19,586 | $13,140 | 272 | |
| All | $339,930 | $188,389 | $126,386 | 2,613 | |
| 2025 | For hire | $83,630 | $46,347 | $31,093 | 658 |
| Private | $237,989 | $131,893 | $88,484 | 1,872 | |
| Shore based | $55,975 | $31,021 | $20,811 | 440 | |
| All | $377,593 | $209,262 | $140,389 | 2,970 | |
| Average | For hire | $86,284 | $47,819 | $32,081 | 653 |
| Private | $228,662 | $126,724 | $85,016 | 1,733 | |
| Shore based | $41,900 | $23,221 | $15,578 | 319 | |
| All | $356,846 | $197,764 | $132,675 | 2,704 | |
Note: The corresponding table expressed in CAD 2025 constant dollars is presented in Table 4.4 (page 17).
*Tidal water survey results are available for 2022–2023 and 2025. The 2024 tidal water expenditure is estimated using the average of the 2022, 2023, and 2025 figures.
Source: DFO iSEA Recreational Surveys, multiple years; British Columbia’s Fisheries and Aquaculture Sector (2022 edition)
Appendix C.7: Commercial sector catch and value - British Columbia salmon fishery
All values in USD 2025 constant dollars
| Chinook | Chum | Coho | Pink | Sockeye | ||
|---|---|---|---|---|---|---|
| 2022 | ||||||
| Fish caught (pieces) | Seine (Area A, B) | 13,450 | 88,918 | x | 376,390 | 566,310 |
| Gillnet (Area C,D,E) | 16,984 | 6,573 | 573 | 106,644 | 691,949 | |
| Troll (Area F,G,H) | 84,298 | 4,505 | 105,269 | 88,594 | 15,838 | |
| Other* | 123,095 | 73,314 | 74,558 | 367,783 | 643,201 | |
| Total | 237,827 | 173,310 | 180,400 | 939,411 | 1,917,298 | |
| Weight landed ('000 KG) | 1,408 | 1,007 | 549 | 1,641 | 3,926 | |
| Value | Ex-vessel $000 | $9,903 | $3,938 | $2,573 | $1,158 | $19,251 |
| Wholesale $000 | $12,478 | $8,821 | $4,709 | $4,413 | $27,528 | |
| Retail $000 | $15,988 | $11,301 | $6,033 | $5,654 | $35,270 | |
| 2023 | ||||||
| Fish caught (pieces) | Seine (Area A, B) | 12,005 | 46,075 | x | 1,224,522 | 167,962 |
| Gillnet (Area C,D,E) | 16,227 | 3,027 | 59 | 149,241 | 286,379 | |
| Troll (Area F,G,H) | 74,087 | x | 120,262 | 172,161 | 645 | |
| Other* | 156,297 | 31,371 | 68,730 | 644,217 | 108,212 | |
| Total | 258,616 | 80,473 | 189,051 | 2,190,141 | 563,198 | |
| Weight landed ('000 KG) | 1,522 | 472 | 532 | 3,726 | 1,206 | |
| Value | Ex-Vessel $000 | $10,258 | $796 | $1,986 | $1,590 | $4,984 |
| Wholesale $000 | $12,925 | $1,782 | $3,635 | $6,057 | $7,127 | |
| Retail $000 | $16,560 | $2,284 | $4,657 | $7,761 | $9,131 | |
| 2024 | ||||||
| Fish caught (pieces) | Seine (Area A, B) | 7,927 | 330,531 | x | 1,317,805 | 175,011 |
| Gillnet (Area C,D,E) | 22,147 | 122,919 | 68 | 90,690 | 264,580 | |
| Troll (Area F,G,H) | 100,430 | 37,565 | 90,797 | 87,912 | 359 | |
| Other* | 102,017 | 98,681 | 74,122 | 746,932 | 380,095 | |
| Total | 232,521 | 589,696 | 164,987 | 2,243,339 | 820,045 | |
| Weight landed ('000 KG) | 1,402 | 1,920 | 436 | 3,986 | 1,726 | |
| Value | Ex-Vessel $000 | $11,323 | $4,201 | $1,413 | $2,269 | $6,975 |
| Wholesale $000 | $14,267 | $9,410 | $2,586 | $8,645 | $9,974 | |
| Retail $000 | $18,280 | $12,056 | $3,314 | $11,076 | $12,779 | |
| 2025 | ||||||
| Fish caught (pieces) | Seine (Area A, B) | 11,436 | 266,306 | x | 1,804,869 | 262,617 |
| Gillnet (Area C,D,E) | 24,270 | 77,225 | x | 189,628 | 298,259 | |
| Troll (Area F,G,H) | 100,447 | 4,606 | 52,421 | 38,825 | 4,237 | |
| Other* | 145,034 | 54,286 | 48,101 | 172,963 | 433,862 | |
| Total | 281,187 | 402,423 | 100,522 | 2,206,285 | 998,975 | |
| Weight landed ('000 KG) | 1,632 | 1,501 | 355 | 3,951 | 2,029 | |
| Value | Ex-Vessel $000 | $13,272 | $3,229 | $1,345 | $2,075 | $9,991 |
| Wholesale $000 | $16,723 | $7,233 | $2,461 | $7,905 | $14,287 | |
| Retail $000 | $21,426 | $9,267 | $3,153 | $10,128 | $18,305 | |
| Average | ||||||
| Fish caught (pieces) | Seine (Area A, B) | 11,205 | 182,958 | 113 | 1,180,897 | 292,975 |
| Gillnet (Area C,D,E) | 19,907 | 52,436 | 178 | 134,051 | 385,292 | |
| Troll (Area F,G,H) | 89,815 | 11,673 | 92,187 | 96,873 | 5,270 | |
| Other* | 131,611 | 64,413 | 66,378 | 482,974 | 391,343 | |
| Total | 252,537 | 311,479 | 158,856 | 1,894,794 | 1,074,879 | |
| Weight landed ('000 KG) | 1,491 | 1,225 | 468 | 3,326 | 2,222 | |
| Value | Ex-Vessel $000 | $11,189 | $3,041 | $1,829 | $1,773 | $10,300 |
| Wholesale $000 | $14,098 | $6,811 | $3,348 | $6,755 | $14,729 | |
| Retail $000 | $18,063 | $8,727 | $4,289 | $8,655 | $18,871 | |
Note: “x” means data is suppressed due to fewer than 5 vessels reporting. The corresponding table expressed in CAD 2025 constant dollars is presented in Appendix A.1 (page 23).
*Other includes First Nations commercial harvest in fisheries other than communal commercial fisheries, specifically Five Nations CBEF, economic opportunity (EO), demonstration (DEMO), excess salmon to spawning requirement (ESSR), Harvest Agreement (HA), test fisheries and transboundary rivers.
Source: Commercial logbooks and fish slips; DFO Price Survey data; PSC Annual Reports (ESSR, CBEF, EO, demo, test fisheries, and transboundary rivers).
Appendix C.8: Commercial and communal-commercial (“f”) landed volume and value, average 2022-2025
All values in USD 2025 constant dollars
Communal commercial licences (“F”) are party-based licences held by First Nations and issued through the ATP/PICFI programs (Allocation Transfer Program/Pacific Integrated Commercial Fisheries Initiative).
| 2022-2025 Annual average | |||||||
|---|---|---|---|---|---|---|---|
| Licence type | Chinook | Chum | Coho | Pink | Sockeye | ||
| Weight landed ('000 KG) | Seine (Area A, B) | F | 2 | 97 | <1 | 256 | 33 |
| Non-F | 58 | 606 | <1 | 1,809 | 538 | ||
| Gillnet (Area C,D,E) | F | 31 | 53 | <1 | 65 | 172 | |
| Non-F | 77 | 148 | 1 | 159 | 650 | ||
| Troll (Area F,G,H) | F | 50 | 6 | 20 | 7 | 2 | |
| Non-F | 526 | 33 | 236 | 177 | 14 | ||
| Other* | 747 | 284 | 210 | 852 | 811 | ||
| Total | 1,492 | 1,227 | 467 | 3,326 | 2,222 | ||
| Ex-vessel value $000 | Seine (Area A, B) | F | $16 | $268 | $0 | $157 | $170 |
| Non-F | $388 | $1,374 | $2 | $970 | $2,989 | ||
| Gillnet (Area C,D,E) | F | $218 | $81 | $0 | $19 | $910 | |
| Non-F | $570 | $261 | $4 | $67 | $3,556 | ||
| Troll (Area F,G,H) | F | $525 | $30 | $113 | $15 | $17 | |
| Non-F | $5,476 | $137 | $1,375 | $339 | $9 | ||
| Other* | $3,999 | $897 | $335 | $206 | $2,564 | ||
| Total | $11,193 | $3,048 | $1,830 | $1,773 | $10,300 | ||
Note: The corresponding table expressed in CAD 2025 constant dollars is presented in Appendix A.2 (page 25).
Marine harvest from License Areas A-H can be labelled as "F" - communal commercial, and "non-F". Communal commercial licences (“F”) are party-based licences held by First Nations and issued through the ATP/PICFI programs (Allocation Transfer Program/Pacific Integrated Commercial Fisheries Initiative). There are other fisheries that occur outside licence areas A-H. These are listed under "Other" and include: economic opportunity (EO), demonstration (DEMO), excess salmon to spawning requirement (ESSR), Five Nations CBEF, Harvest Agreement (HA), test fisheries, and transboundary rivers.
Data in A.2 may not equal data in A.1 due to licence matching and rounding.
Source: Commercial logbooks and fish slips; DFO Licence data; DFO Price Survey data; PSC Annual Reports (ESSR, CBEF, EO, demo, test fisheries and transboundary rivers).
Appendix C.9: Commercial salmon economic contribution by sector – British Columbia
All values in USD 2025 constant dollars
| Direct output of the sector $000 | Direct | Indirect | Induced | Total | |||||||||
|---|---|---|---|---|---|---|---|---|---|---|---|---|---|
| GDP $000 | Labour income $000 | Employ- ment |
GDP $000 | Labour income $000 | Employ- ment |
GDP $000 | Labour income $000 | Employ- ment |
GDP $000 | Labour income $000 | Employ- ment |
||
| 2022 | |||||||||||||
| Fishing | $36,823 | $19,641 | $12,803 | 1,171 | $4,986 | $3,200 | 54 | $2,051 | $1,499 | 17 | $26,678 | $17,502 | 1,242 |
| Processing | $21,126 | $4,510 | $3,114 | 88 | $5,260 | $3,141 | 51 | $1,0698 | $782 | 9 | $10,840 | $7,037 | 148 |
| Retail and trade | $16,298 | $8,707 | $6,630 | 222 | $3,705 | $1,935 | 34 | $4,128 | $1,431 | 33 | $16,540 | $9,996 | 290 |
| Total | $74,246 | $32,858 | $22,547 | 1,481 | $13,951 | $8,276 | 140 | $7,248 | $3,711 | 59 | $54,058 | $34,535 | 1,680 |
| 2023 | |||||||||||||
| Fishing | $19,613 | $10,462 | $6,820 | 995 | $2,656 | $1,704 | 30 | $1,092 | $798 | 9 | $14,210 | $9,322 | 1,035 |
| Processing | $11,913 | $2,543 | $1,756 | 52 | $2,966 | $1,7718 | 31 | $603 | $441 | 5 | $6,112 | $3,968 | 88 |
| Retail and trade | $8,866 | $4,737 | $3,607 | 128 | $2,016 | $1,053 | 20 | $2,246 | $779 | 19 | $8,998 | $5,438 | 167 |
| Total | $40,392 | $17,742 | $12,182 | 1,175 | $7,638 | $4,529 | 81 | $3,9410 | $2,018 | 34 | $29,321 | $18,728 | 1,290 |
| 2024 | |||||||||||||
| Fishing | $26,181 | $13,965 | $9,103 | 9459 | $3,545 | $2,275 | 41 | $1,458 | $1,066 | 13 | $18,968 | $12,444 | 999 |
| Processing | $18,701 | $3,993 | $2,756 | 83 | $4,656 | $2,781 | 49 | $946 | $692 | 8 | $9,595 | $6,229 | 140 |
| Retail and trade | $12,622 | $6,743 | $5,135 | 184 | $2,870 | $1,499 | 29 | $3,197 | $1,108 | 28 | $12,810 | $7,742 | 241 |
| Total | $57,504 | $24,701 | $16,994 | 1,213 | $11,071 | $6,555 | 118 | $5,602 | $2,866 | 49 | $41,374 | $26,415 | 1,380 |
| 2025 | |||||||||||||
| Fishing | $29,911 | $15,955 | $10,400 | 1,079 | $4,050 | $2,599 | 48 | $1,666 | $1,217 | 15 | $21,671 | $14,217 | 1,142 |
| Processing | $18,697 | $3,992 | $2,756 | 85 | $4,655 | $2,7804 | 50 | $946 | $692 | 8 | $9,593 | $6,228 | 144 |
| Retail and trade | $13,671 | $7,303 | $5,561 | 204 | $3,108 | $1,623 | 32 | $3,463 | $1,200 | 31 | $13,874 | $8,385 | 267 |
| Total | $62,279 | $27,250 | $18,717 | 1,368 | $11,814 | $7,003 | 130 | $6,075 | $3,110 | 54 | $45,138 | $28,829 | 1,552 |
| Average | |||||||||||||
| Fishing | $28,132 | $15,006 | $9,782 | 1,048 | $3,809 | $2,445 | 43 | $1,567 | $1,145 | 13 | $20,382 | $13,371 | 1,104 |
| Processing | $17,609 | $3,760 | $2,596 | 77 | $4,385 | $2,618 | 45 | $891 | $652 | 8 | $9,035 | $5,866 | 130 |
| Retail and trade | $12,864 | $6,872 | $5,233 | 185 | $2,925 | $1,527 | 29 | $3,259 | $1,130 | 28 | $13,056 | $7,890 | 241 |
| Total | $58,605 | $25,638 | $17,610 | 1,310 | $11,118 | $6,590 | 117 | $5,717 | $2,926 | 49 | $42,473 | $27,127 | 1,476 |
Note: The corresponding table expressed in CAD 2025 constant dollars is presented in Appendix A.4 (page 27).
Source: Commercial logbooks and fish slips; DFO Price Survey data; British Columbia’s Fisheries and Aquaculture Sector (2022 edition); Statistics Canada Provincial Supply and use tables (2022).
Appendix C.10: Commercial salmon economic contribution by species – British Columbia
All values in USD 2025 constant dollars
| Commercial fishing contributions (2022-2025 Avg) | Total output $000 | Direct output by Sector $000 | Direct | Indirect | Induced | Total | ||||||||
|---|---|---|---|---|---|---|---|---|---|---|---|---|---|---|
| GDP $000 | Labour income $000 | Employ- ment |
GDP $000 | Labour income $000 | Employ- ment |
GDP $000 | Labour income $000 | Employ- ment |
GDP $000 | Labour income $000 | Employ- ment |
|||
| Chinook | ||||||||||||||
| Fishing | $11,189 | $5,968 | $3,890 | 600 | $1,515 | $972 | 17 | $623 | $455 | 5 | $8,106 | $5,318 | 623 | |
| Processing | $2,909 | $621 | $429 | 13 | $724 | $433 | 8 | $147 | $108 | 1 | $1,493 | $969 | 22 | |
| Retail | $2,503 | $1,615 | $1,326 | 52 | $472 | $247 | 5 | $759 | $262 | 7 | $2,845 | 1,835 | 63 | |
| Trade | $1,462 | $503 | $287 | 6 | $430 | $224 | 4 | $246 | $86 | 2 | $1,179 | $597 | 12 | |
| Total | $18,063 | $18,063 | $8,708 | $5,932 | 670 | $3,141 | $1,876 | 34 | $1,775 | $911 | 15 | $13,623 | $8,719 | 719 |
| Chum | ||||||||||||||
| Fishing | $3,041 | $1,622 | $1,057 | 352 | $412 | $264 | 5 | $169 | $124 | 1 | $2,203 | $1,445 | 358 | |
| Processing | $3,771 | $805 | $556 | 17 | $939 | $561 | 10 | $191 | $140 | 2 | $1,935 | $1,256 | 28 | |
| Retail | $1,209 | $780 | $641 | 25 | $228 | $119 | 2 | $367 | $127 | 3 | $1,375 | $887 | 30 | |
| Trade | $707 | $243 | $138 | 3 | $208 | $108 | 2 | $119 | $42 | 1 | $569 | $288 | 6 | |
| Total | $8,727 | $8,727 | $3,450 | $2,392 | 396 | $1,786 | $1,052 | 19 | $845 | $431 | 7 | $6,082 | $3,876 | 422 |
| Coho | ||||||||||||||
| Fishing | $1,829 | $976 | $636 | 287 | $248 | $159 | 3 | $102 | $74 | 1 | $1,325 | $869 | 291 | |
| Processing | $1,518 | $324 | $224 | 7 | $378 | $$226 | 4 | $77 | $56 | 1 | $779 | $506 | 11 | |
| Retail | $594 | $384 | $315 | 12 | $112 | $59 | 1 | $180 | $62 | 2 | $676 | $436 | 15 | |
| Trade | $347 | $119 | $68 | 1 | $102 | $53 | 1 | $58 | $20 | 0 | $280 | $142 | 3 | |
| Coho total | $4,289 | $4,289 | $1,803 | $1,243 | 307 | $840 | $497 | 9 | $417 | $213 | 4 | $3,060 | $1,953 | 319 |
| Pink | ||||||||||||||
| Fishing | $1,773 | $946 | $616 | 599 | $240 | $154 | 3 | $99 | $72 | 1 | $1,284 | $843 | 603 | |
| Processing | $4,982 | $1,064 | $734 | 22 | $1,240 | $741 | 13 | $252 | $184 | 2 | $2,556 | $1,659 | 37 | |
| Retail | $1,199 | $774 | $635 | 25 | $226 | $118 | 2 | $364 | $125 | 3 | $1,363 | $879 | 30 | |
| Trade | $701 | $241 | $137 | 3 | $206 | $107 | 2 | $118 | $41 | 1 | $565 | $286 | 6 | |
| Total | $8,655 | $8,655 | $3,024 | $2,124 | 649 | $1,912 | $1,120 | 20 | $832 | $423 | 7 | $5,769 | $3,667 | 676 |
| Sockeye | ||||||||||||||
| $10,300 | $5,494 | $3,581 | 648 | $1,395 | $895 | 16 | $574 | $419 | 5 | $7,462 | $4,896 | 669 | ||
| Processing | $4,429 | $946 | $653 | 19 | $1,103 | $659 | 11 | $224 | $164 | 2 | $2,273 | $1,475 | 32 | |
| Retail | $2,615 | $1,687 | $1,386 | 53 | $493 | $258 | 5 | $793 | $274 | 7 | $2,973 | $1,917 | 65 | |
| Trade | $1,528 | $526 | $299 | 6 | $449 | $234 | 4 | $257 | $90 | 2 | $1,231 | $623 | 12 | |
| Total | $18,871 | $18,871 | $8,653 | $5,919 | 726 | $3,439 | $2,045 | 36 | $1,847 | $947 | 16 | $13,939 | $8,912 | 778 |
| All species | ||||||||||||||
| All species Total | $58,605 | $58,605 | $25,638 | $17,610 | 1,310 | $11,1186 | $6,590 | 117 | $5,717 | $2,926 | 49 | $42,473 | $27,127 | 1,476 |
Note: The corresponding table expressed in CAD 2025 constant dollars is presented in Appendix A.5 (page 28). Table shows 2022-2025 average. Direct fishing employment for the commercial sector is calculated using active vessels by gear type and average crew per vessel for each species. Since a vessel can fish multiple species, there will be some double counting of employment at the species level.
Source: Commercial logbooks and fish slips; DFO Price Survey data; British Columbia’s Fisheries and Aquaculture Sector (2022 edition); Statistics Canada Provincial Supply and Use tables (2022).
Appendix C.11: Recreational salmon economic contribution by trip type, freshwater and tidal
All values in USD 2025 constant dollars
| Recreational fishing contributions (2022-2025 avg) | Total expenditures by recreational fishers $000 | Direct | Indirect | Induced | Total | ||||||||
|---|---|---|---|---|---|---|---|---|---|---|---|---|---|
| GDP $000 | Labour income $000 | Employ- ment |
GDP $000 | Labour income $000 | Employ- ment |
GDP $000 | Labour income $000 | Employ- ment |
GDP $000 | Labour income $000 | Employ- ment |
||
| 2022 | |||||||||||||
| For hire | $92,752 | $32,556 | $21,630 | 482 | $12,522 | $8,236 | 132 | $6,326 | $4,619 | 52 | 51,403 | $34,485 | 665 |
| Private | $237,094 | $83,220 | $55,290 | 1,232 | $32,008 | $21,054 | 337 | $16,170 | $11,807 | 132 | $131,397 | $21,054 | 1,700 |
| Shore-based | $40,413 | $14,185 | $9,424 | 210 | $5,456 | $3,589 | 57 | $2,756 | $2,013 | 22 | $22,397 | $15,025 | 290 |
| All | $370,259 | $129,961 | $86,344 | 1,924 | $49,985 | $32,879 | 526 | $25,252 | $18,439 | 206 | $205,197 | $137,662 | 2,655 |
| 2023 | |||||||||||||
| For hire | $85,154 | $29,889 | $19,858 | 468 | $11,496 | $7,562 | 128 | $5,808 | $4,241 | 50 | $47,192 | $31,660 | 647 |
| Private | $218,578 | $76,721 | $50,972 | 1,202 | $29,508 | $19,410 | 329 | $14,907 | $10,885 | 129 | $121,136 | $81,267 | 1,660 |
| Shore-based | $35,872 | $12,591 | $8,365 | 197 | $4,843 | $3,185 | 54 | $2,446 | $1,786 | 21 | $19,880 | $13,337 | 272 |
| All | $339,604 | $119,201 | $79,196 | 1,868 | $45,847 | $30,157 | 510 | $23,161 | $16,912 | 200 | $188,208 | $126,265 | 2,579 |
| 2024 | |||||||||||||
| For hire | $83,601 | $29,344 | $19,496 | 466 | $11,286 | $7,424 | 127 | $5,702 | $4,163 | 50 | $46,332 | $31,083 | 643 |
| Private | $220,987 | $77,566 | $51,534 | 1,231 | $29,833 | $19,624 | 336 | $15,071 | $11,005 | 132 | $122,471 | $82,163 | 1,699 |
| Shore based | $35,341 | $12,405 | $8,242 | 197 | $4,771 | $3,138 | 54 | $2,410 | $1,760 | 21 | $19,586 | $13,140 | 272 |
| All | $339,930 | $119,315 | $79,272 | 1,893 | $45,891 | $30,186 | 517 | $23,183 | $16,928 | 203 | $188,389 | $126,386 | 2,613 |
| 2025 | |||||||||||||
| For hire | $83,630 | $29,354 | $19,502 | 477 | $11,290 | $7,426 | 130 | $5,704 | $4,165 | 51 | $46,347 | $31,093 | 658 |
| Private | $237,989 | $83,534 | $55,499 | 1,356 | $32,129 | $21,133 | 371 | $16,231 | $11,8522 | 145 | $131,893 | $88,484 | 1,872 |
| Shore based | $55,975 | $19,647 | $13,053 | 319 | $7,557 | $4,971 | 87 | $3,817 | $2,788 | 34 | $31,021 | $20,811 | 440 |
| All | $377,593 | $132,535 | $88,055 | 2,152 | $50,975 | $33,530 | 588 | $25,752 | $18,8040 | 230 | $209,262 | $140,389 | 2,970 |
| Average | |||||||||||||
| For hire | $86,284 | $30,286 | $20,122 | 4733 | $11,648 | $7,662 | 129 | $5,885 | $4,297 | 51 | $47,819 | $32,081 | 653 |
| Private | $228,662 | $80,260 | $53,324 | 1,255 | $30,869 | $20,305 | 343 | $15,595 | $11,387 | 134 | $126,724 | $85,016 | 1,733 |
| Shore based | $41,900 | $14,707 | $9,771 | 231 | $5,657 | $3,721 | 63 | $2,858 | $2,087 | 25 | $23,221 | $15,578 | 319 |
| All | $356,846 | $125,253 | $83,217 | 1,959 | $48,174 | $31,688 | 535 | $24,337 | $17,771 | 210 | $197,764 | $132,675 | 2,704 |
Note: The corresponding table expressed in CAD 2025 constant dollars is presented in Appendix B.1 (page 30).
Source: DFO iSEA Recreational Surveys, multiple years; British Columbia’s Fisheries and Aquaculture Sector (2022 edition).
Appendix C.12: Recreational salmon economic contribution by species - British Columbia
All values in USD 2025 constant dollars
| Recreational fishing contributions (2022-2025 avg) | Total expenditures by recreational fishers $000 | Direct | Indirect | Induced | Total | ||||||||
|---|---|---|---|---|---|---|---|---|---|---|---|---|---|
| GDP $000 | Labour income $000 | Employ- ment |
GDP $000 | Labour income $000 | Employ- ment |
GDP $000 | Labour income $000 | Employ- ment |
GDP $000 | Labour income $000 | Employ- ment |
||
| Freshwater | |||||||||||||
| Chinook | $13,806 | $4,846 | $3,220 | 76 | $1,864 | $1,226 | 21 | $942 | $688 | 8 | $7,651 | $5,133 | 104 |
| Coho | $22,224 | $7,801 | $5,183 | 122 | $3,000 | $1,973 | 33 | $1,516 | $1,107 | 13 | $12,316 | $8,263 | 169 |
| Pink or chum | $13,125 | $4,607 | $3,061 | 73 | $1,772 | $1,165 | 20 | $895 | $654 | 8 | $7,274 | $4,880 | 100 |
| Sockeye | $7,893 | $2,770 | $1,841 | 43 | $1,066 | $701 | 12 | $538 | $393 | 5 | $4,374 | $2,935 | 60 |
| Total | $57,047 | $20,024 | $13,303 | 314 | $7,701 | $5,066 | 86 | $3,891 | $2,841 | 34 | $31,616 | $21,210 | 433 |
| Tidal water | |||||||||||||
| Chinook | $163,771 | $57,484 | $38,191 | 898 | $22,109 | $14,543 | 245 | $11,169 | $8,156 | 96 | $90,762 | $60,890 | 1,239 |
| Coho | $107,343 | $37,677 | $25,032 | 590 | $14,491 | $9,532 | 161 | $7,321 | $5,346 | 63 | $59,489 | $39,910 | 814 |
| Pink or chum | $20,956 | $7,356 | $4,887 | 115 | $2,829 | $1,861 | 31 | $1,429 | $1,044 | 12 | $11,614 | $7,792 | 159 |
| Sockeye | $7,729 | $2,713 | $1,802 | 42 | $1,043 | $686 | 12 | $527 | $385 | 5 | $4,283 | $2,874 | 58 |
| Total | $299,799 | $105,229 | $69,913 | 1,645 | $40,473 | $26,622 | 450 | $20,446 | $14,930 | 176 | $166,149 | $111,465 | 2,271 |
| Total | |||||||||||||
| Chinook | $177,577 | $62,329 | $41,411 | 974 | $23,973 | $15,769 | 266 | $12,111 | $8,843 | 104 | $98,413 | $66,023 | 1,344 |
| Coho | $129,567 | $45,478 | $30,215 | 712 | $17,492 | $$11,506 | 195 | $8,836 | $6,452 | 76 | $71,806 | $48,173 | 983 |
| Pink or chum | $34,081 | $11,962 | $7,948 | 188 | $4,601 | $3,026 | 51 | $2,324 | $1,697 | 20 | $18,888 | $12,671 | 259 |
| Sockeye | $15,622 | $5,483 | $3,643 | 86 | $2,109 | $1,387 | 23 | $1,065 | $778 | 9 | $8,658 | $5,808 | 118 |
| Total | $356,846 | $125,253 | $83,217 | 1,959 | $48,174 | $31,688 | 535 | $24,337 | $17,771 | 210 | $197,764 | $132,675 | 2,704 |
Note: The corresponding table expressed in CAD 2025 constant dollars is presented in Appendix B.2 (page 31).
Source: DFO iSEA Recreational Surveys, multiple years; British Columbia’s Fisheries and Aquaculture Sector (2022 edition).
7. References and data sources
BC Ministry of Agriculture and Food (2021-2024), Annual Fisheries Production Schedule. https://open.canada.ca/data/en/dataset/e591a756-6b99-4986-b8ce-f341bd47228f (accessed September 4, 2026)
Bank of Canada (website), Annual Exchange Rates. https://www.bankofcanada.ca/rates/exchange/annual-average-exchange-rates/ (accessed September 4, 2026)
Fisheries and Oceans Canada (2024), EXIM [database], Ottawa. Adapted from Statistics Canada, International Trade Data. No endorsement of this product by Statistics Canada is implied.
Fisheries and Oceans Canada (multiple years), Internet Socio-Economic Analysis (iSEA) Survey of Recreational Fishing
- Tidal water survey: https://www.pac.dfo-mpo.gc.ca/analyses-econom-analysis/report-program-rapport/rec-tidal-maree-eng.html (accessed September 4, 2026)
- Freshwater: https://www.pac.dfo-mpo.gc.ca/analyses-econom-analysis/report-program-rapport/rec-fresh-douce-eng.html (accessed September 4, 2026)
GS Gislason & Associates Ltd. & Institute of Social and Economic Research, University of Alaska (2017). Economic Impacts of Pacific Salmon Fisheries. https://www.psc.org/wpfd_file/economic-impacts-of-pacific-salmon-fisheries/ (accessed September 15, 2026)
Lillian Hallin Consulting (2024). British Columbia’s fisheries and aquaculture sector: 2022 edition. https://www2.gov.bc.ca/assets/gov/farming-natural-resources-and-industry/agriculture-and-seafood/statistics/industry-and-sector-profiles/sector-reports/four_sector_report_2022_edition.pdf. (accessed September 16, 2026)
Pacific Salmon Commission (2021-2024). Pacific Salmon Commission Annual Report. https://www.psc.org/publications/annual-reports/commission/ (accessed June 16, 2026)
Statistics Canada (2022). Table 36-10-0478-01. Supply and use tables, detail level. https://doi.org/10.25318/3610047801-eng (accessed September 4, 2026)
Statistics Canada (2022). Table 36-10-0594-01. Input-output multipliers, detail level. https://doi.org/10.25318/3610059401-eng (accessed September 4, 2026)
U.S. Bureau of Economic Analysis, "Table 1.1.4. Price Indexes for Gross Domestic Product" (accessed September 4, 2026).
Footnotes
Page details
- Date modified: