
Results of the British Columbia freshwater recreational fishing survey, 2025
On this page
- British Columbia freshwater recreational fishing 2025, fast facts
- BC freshwater fishing spatial and temporal patterns, 2025
- BC freshwater fishing regional patterns in 2025
- BC freshwater fishing 2025, target species
- BC freshwater fishing 2025, salmon
- BC freshwater fishing 2025, Fraser River white sturgeon
- BC freshwater fishing 2025, steelhead
- BC freshwater recreational fishing, 2000 to 2025 trends
- BC freshwater fishing expenditures, 2025
- BC freshwater fishing package deals, 2025
- Notes and methodology
British Columbia freshwater recreational fishing 2025, fast facts
Long text version
Key metrics for the BC freshwater recreational fishing industry
(All values reflect the average from 2000 to 2025. Dollar amounts are in 2025 dollars.)
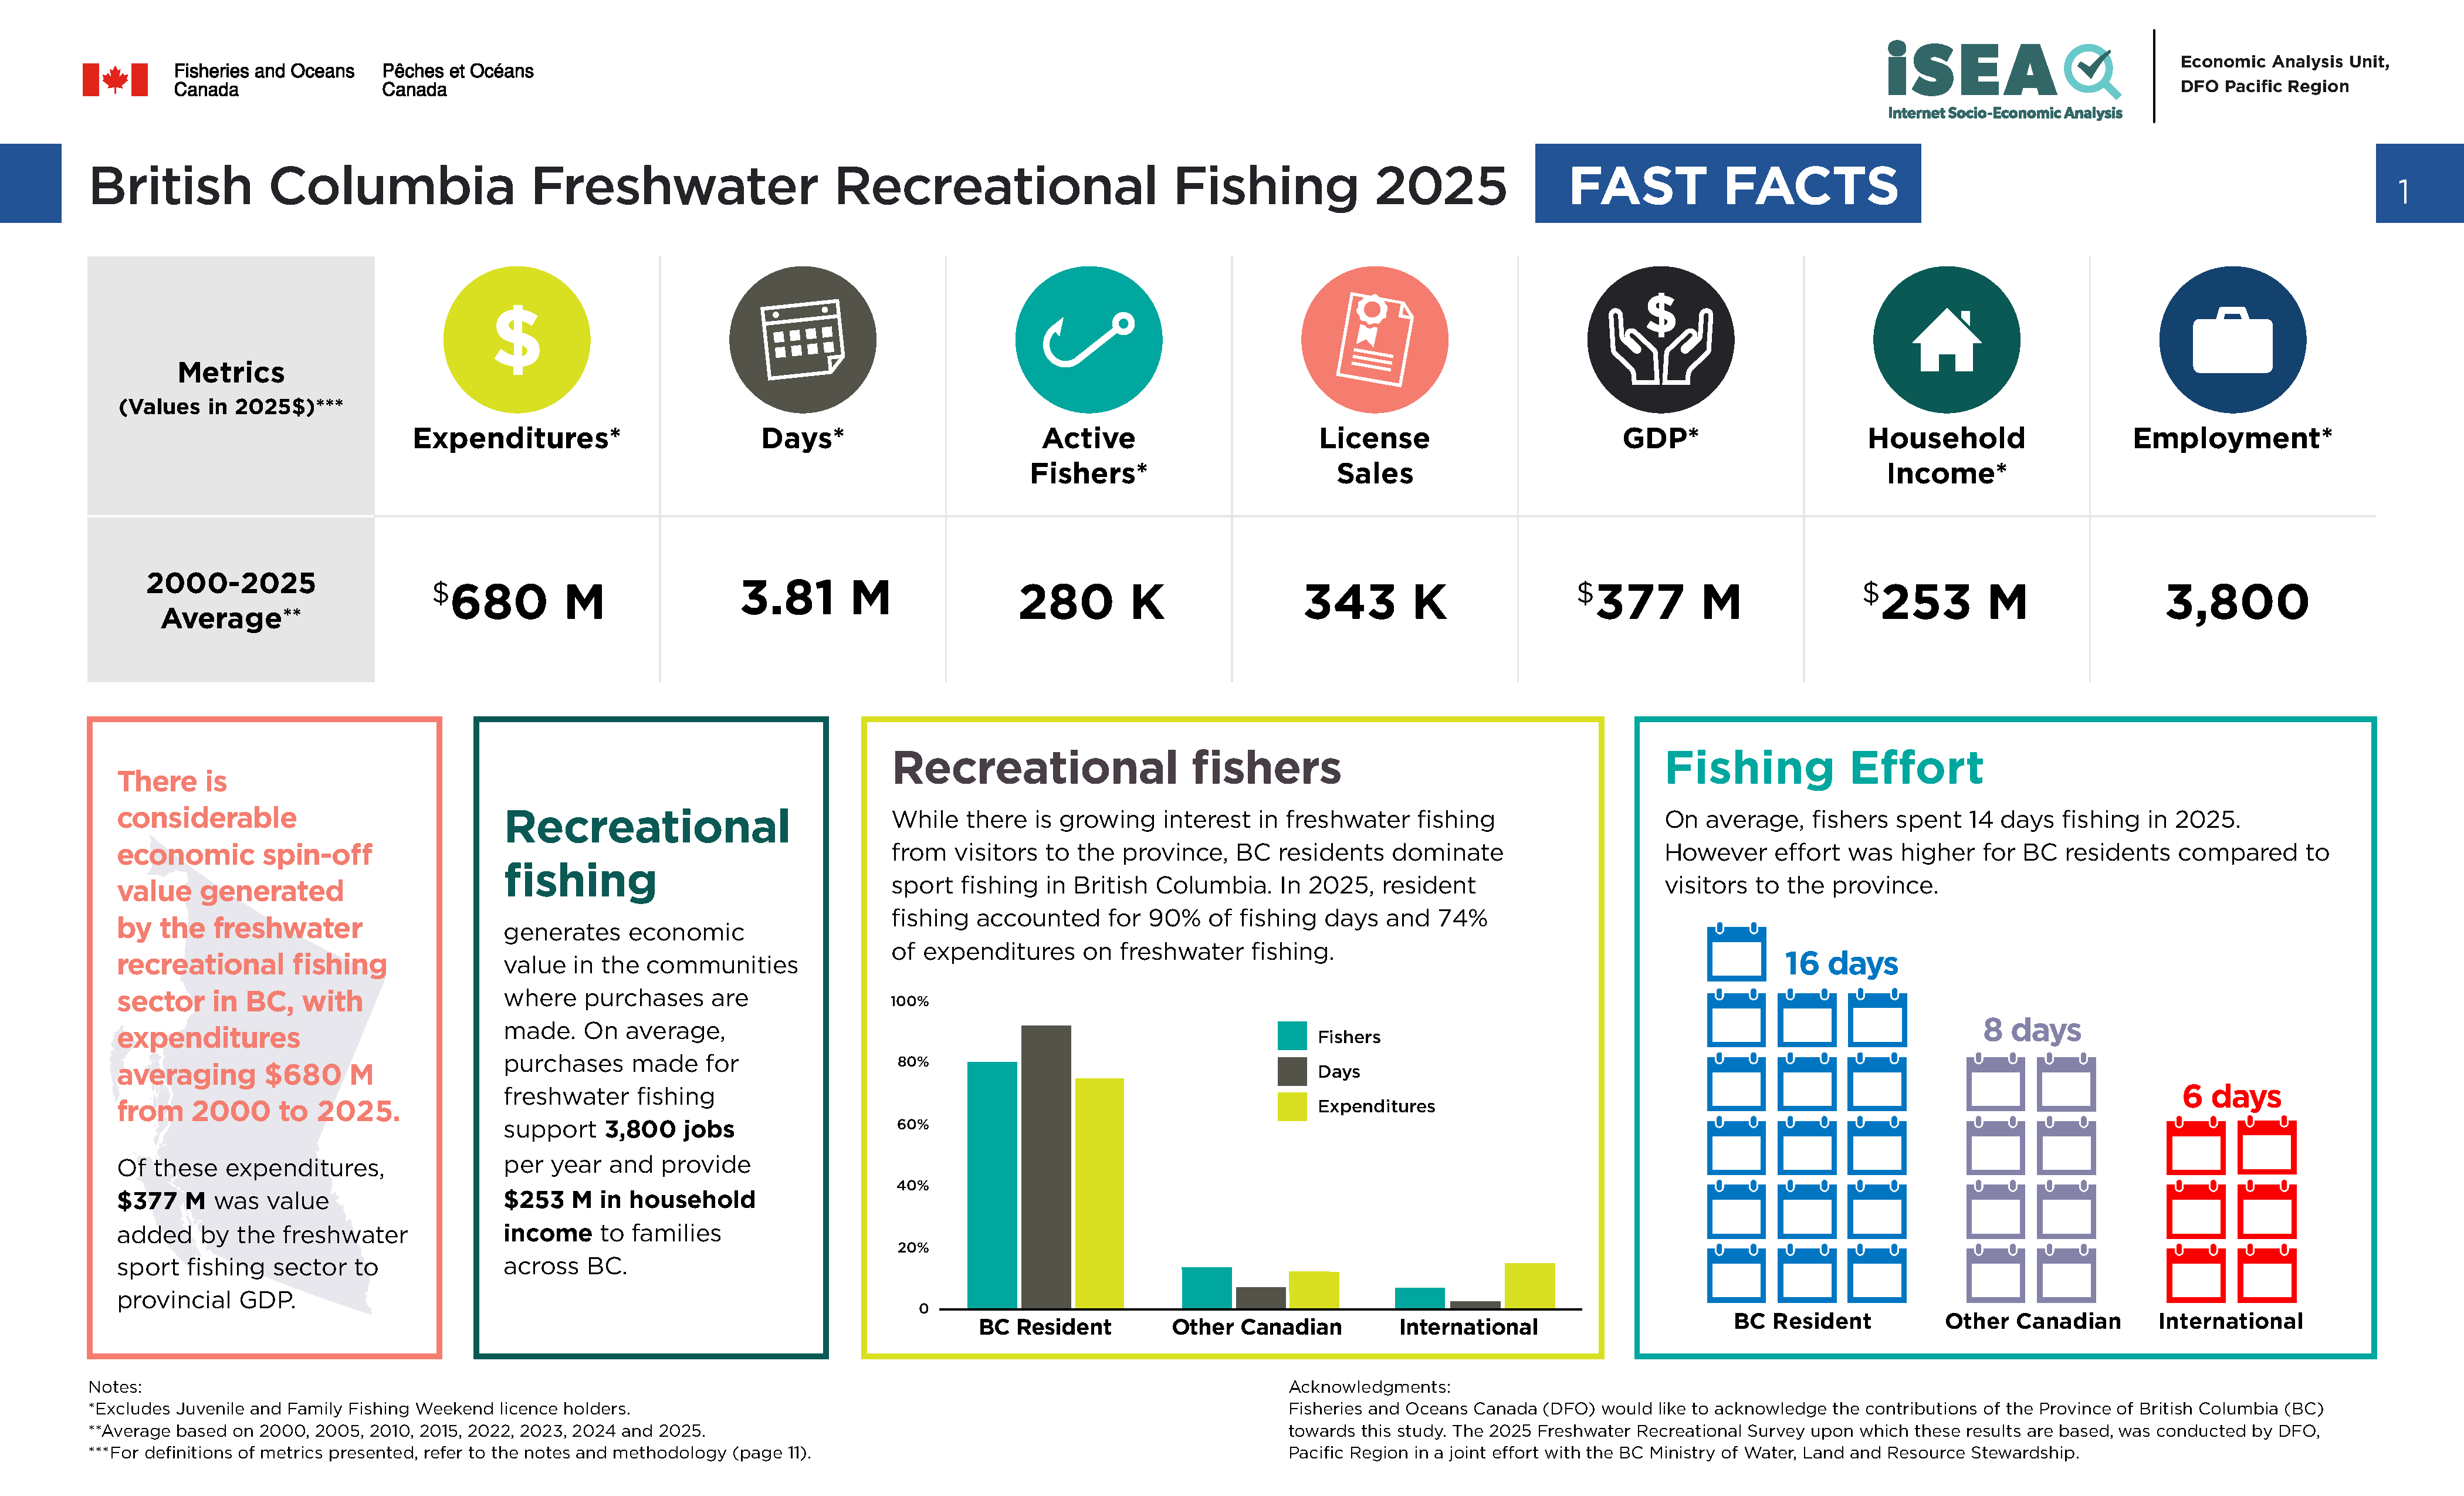
- Average expenditures: $680 million
- Average number of fishing days: 3.81 million
- Average number of active fishers: 280,000
- Average license sales: 343,000
- Average GDP contribution: $377 million
- Average household income: $253 million
- Average employment: 3,800
Key survey findings
- There is considerable economic spin-off value generated by the freshwater recreational fishing sector in BC, with expenditures averaging $680 million from 2000 to 2025. Of these expenditures, $377 million was value added by the freshwater sport fishing sector to provincial GDP
- Recreational fishing generates economic value in the communities where purchases are made. On average, purchases made for freshwater fishing support 3,800 jobs per year and provide $253 million in household income to families across BC
While there is growing interest in freshwater fishing from visitors to the province, BC residents dominate sport fishing in British Columbia
In 2025, British Columbia residents made up:
- 79% of fishers
- 90% of days
- 74% of expenditures
Other Canadians in 2025 accounted for:
- 14% of fishers
- 7% of days
- 14% of expenditures
International participants in 2025 comprised:
- 7% of fishers
- 3% of days
- 12% of expenditures
On average, fishers spent 14 days per year fishing. However, effort was higher for BC residents compared to visitors to the province
- In 2025, BC residents fished an average of 16 days in the year.
- Other Canadian residents fished an average of 8 days in the year.
- International participants fished an average of 6 days in the year.
BC freshwater fishing spatial and temporal patterns, 2025
Long text version
Key takeaways
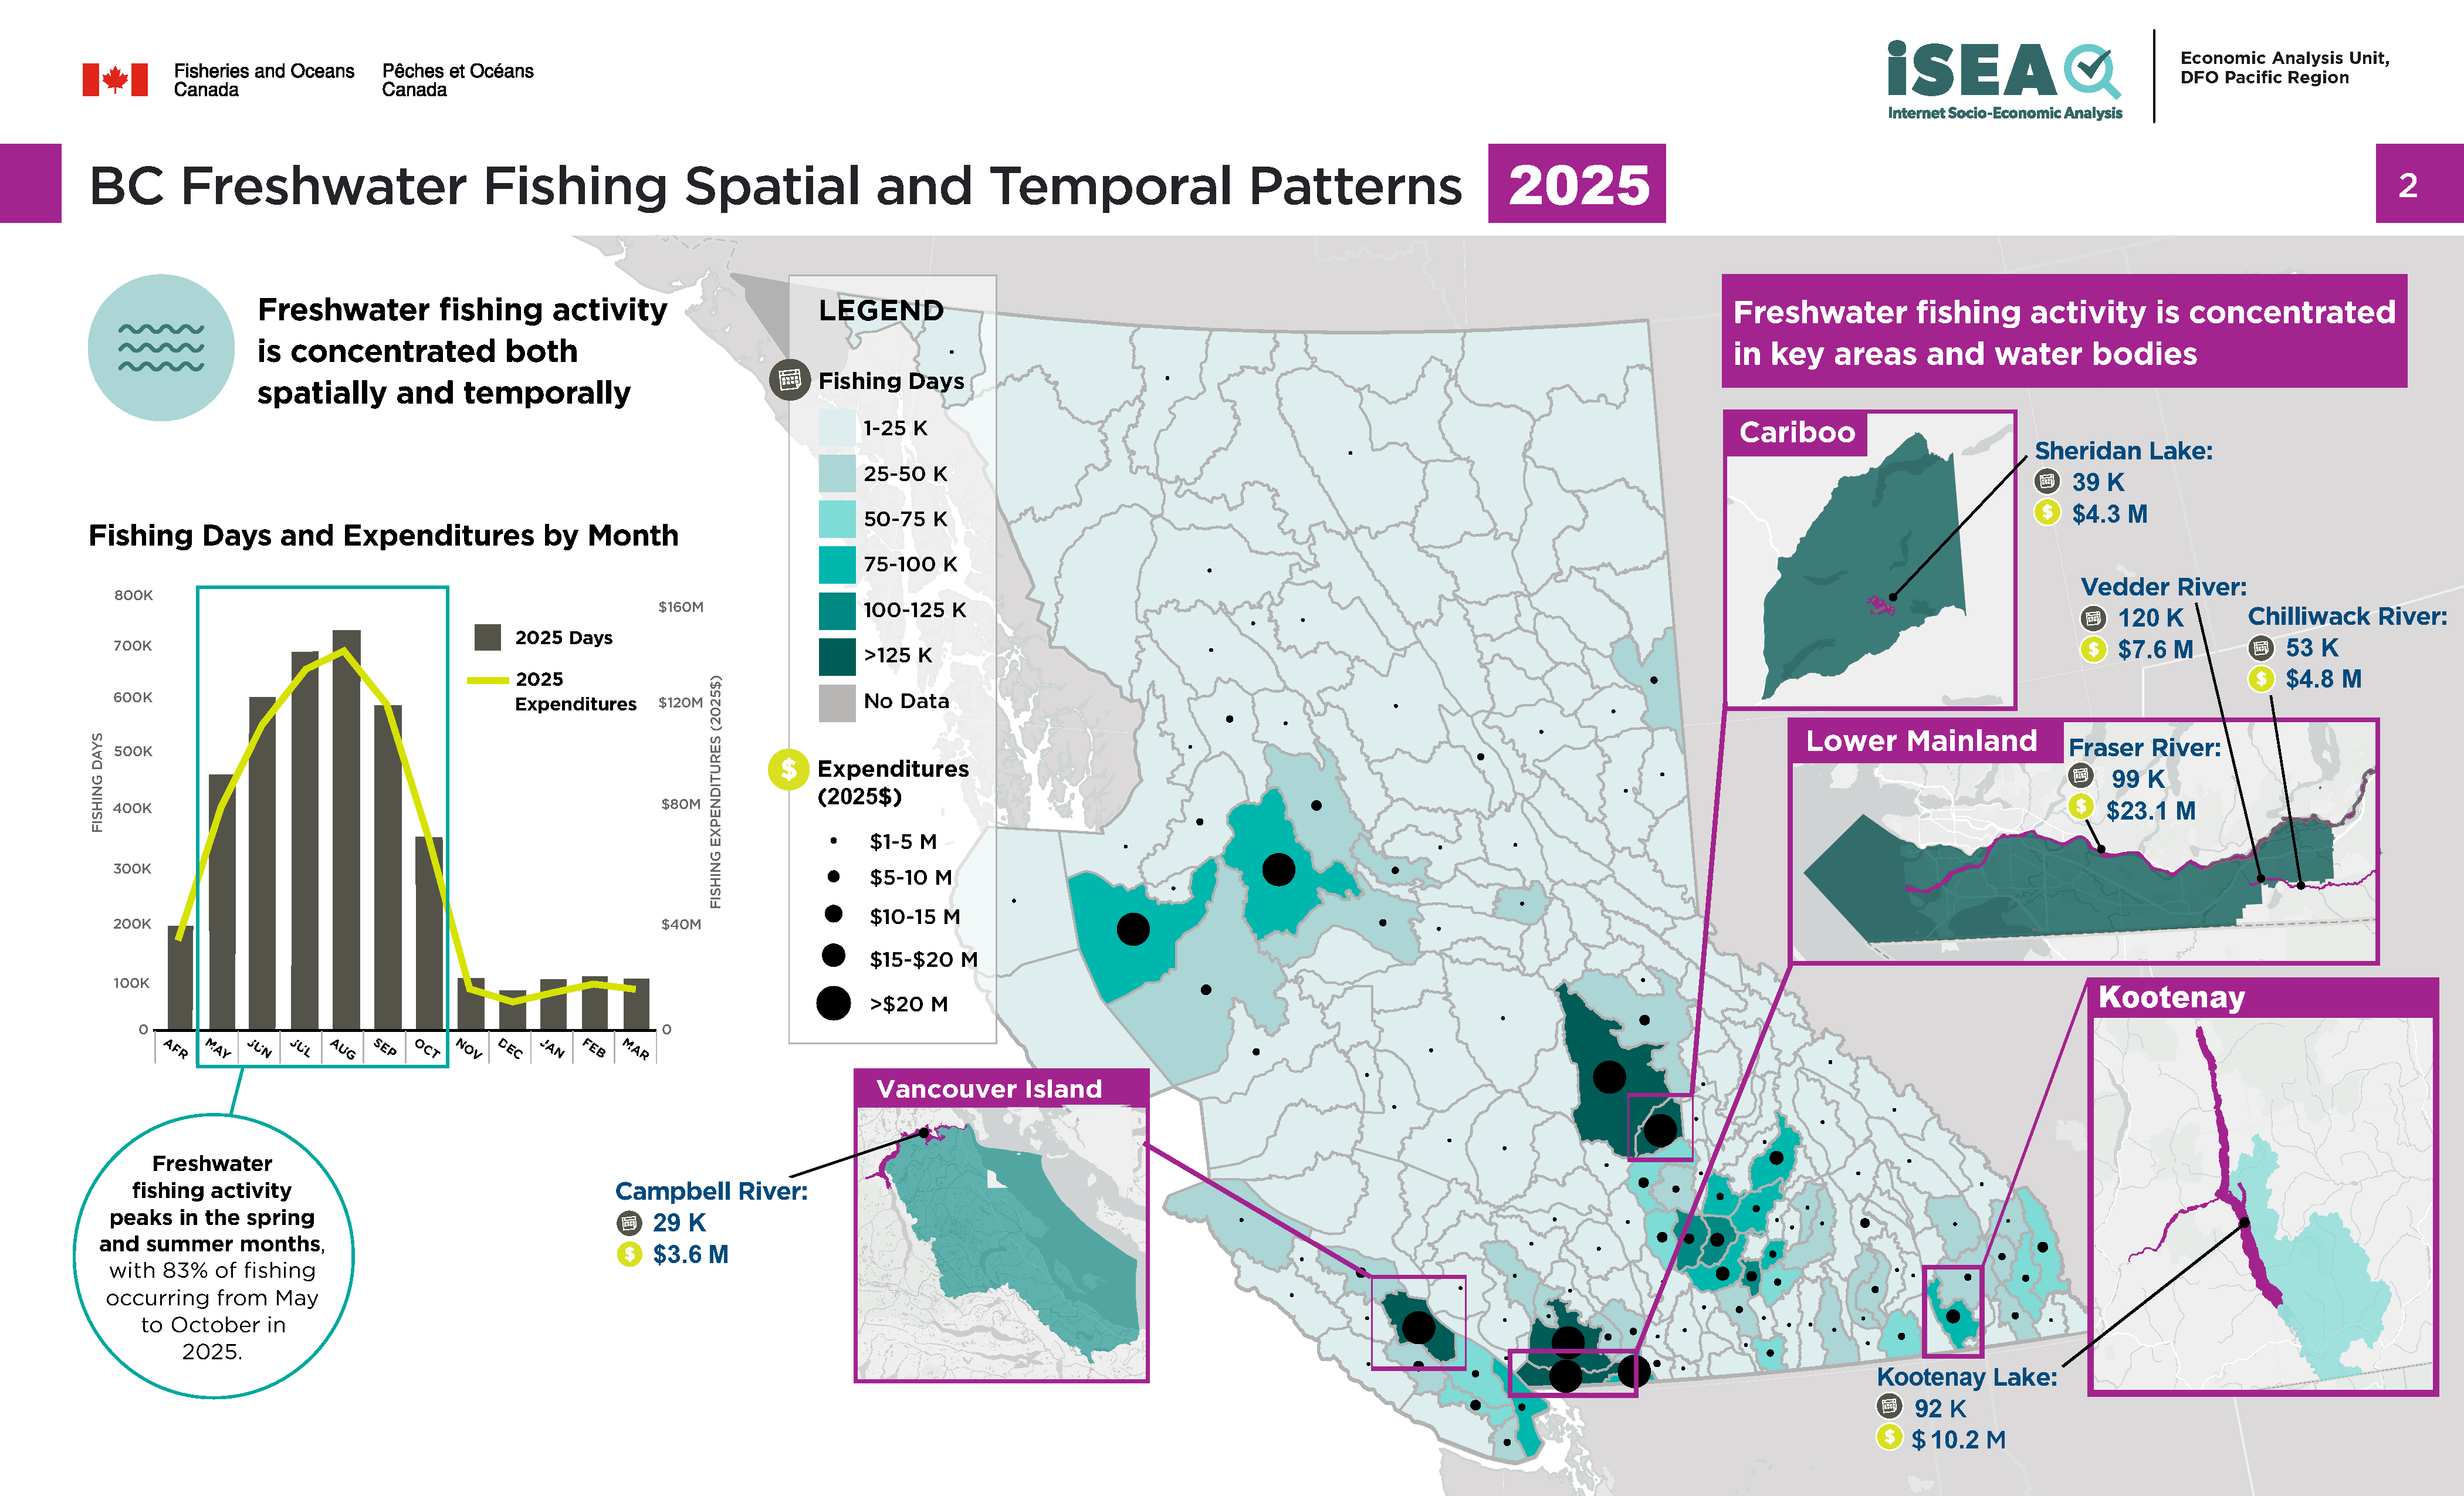
- Fishing expenditures and activity are concentrated both spatially and temporally
- Fishing activity peaks in the summer months with 83% of fishing occurring from May to October
- Geographically, freshwater activity is concentrated in a few key management areas and waterbodies
In 2025, the number of fishing days and corresponding expenditures by month were as follows:
- In April, there were 205,000 fishing days with expenditures totaling $33 million. In May, the fishing days increased to 452,000 and the expenditures rose to $74 million. June saw a further increase with 601,000 fishing days and $97 million in expenditures
- In July, there were 676,000 fishing days with expenditures of $119 million. August had the most fishing days at 741,000 and the expenditures were at their highest at $138 million. In September, there were 618,000 fishing days with $124 million expenditures
- In October, the number of fishing days reduced to 364,000 and expenditures were at $74 million. The numbers continued to decrease in November and December, with 130,000 and 79,000 fishing days and expenditures of $18 million and $9 million respectively
- In January, February, and March, the fishing days were relatively stable at 94,000, 99,000, and 94,000 respectively, with corresponding expenditures of $12 million, $14 million, and $12 million
In 2025, the top waterbodies for freshwater recreational fishing were as follows:
- In the Lower Mainland region, the Vedder and Fraser River saw the most angling days with about 120,000 and 99,000 days and expenditures around $7.6 million and $23.1 million, respectively
- The Chilliwack River in the same region had about 53,000 angling days with expenditures amounting to approximately $4.8 million
- In the Cariboo region, Sheridan Lake had the most activity with about 39,000 angling days and expenditures of approximately $4.3 million
- In the Kootenay region, Kootenay Lake had the most activity with around 92,000 angling days and expenditures of about $10.2 million
- On Vancouver Island, Campbell River (the river, rather than the city) had the most activity with about 29,000 angling days and expenditures of approximately $3.6 million
BC freshwater fishing regional patterns in 2025
Long text version
Key takeaways
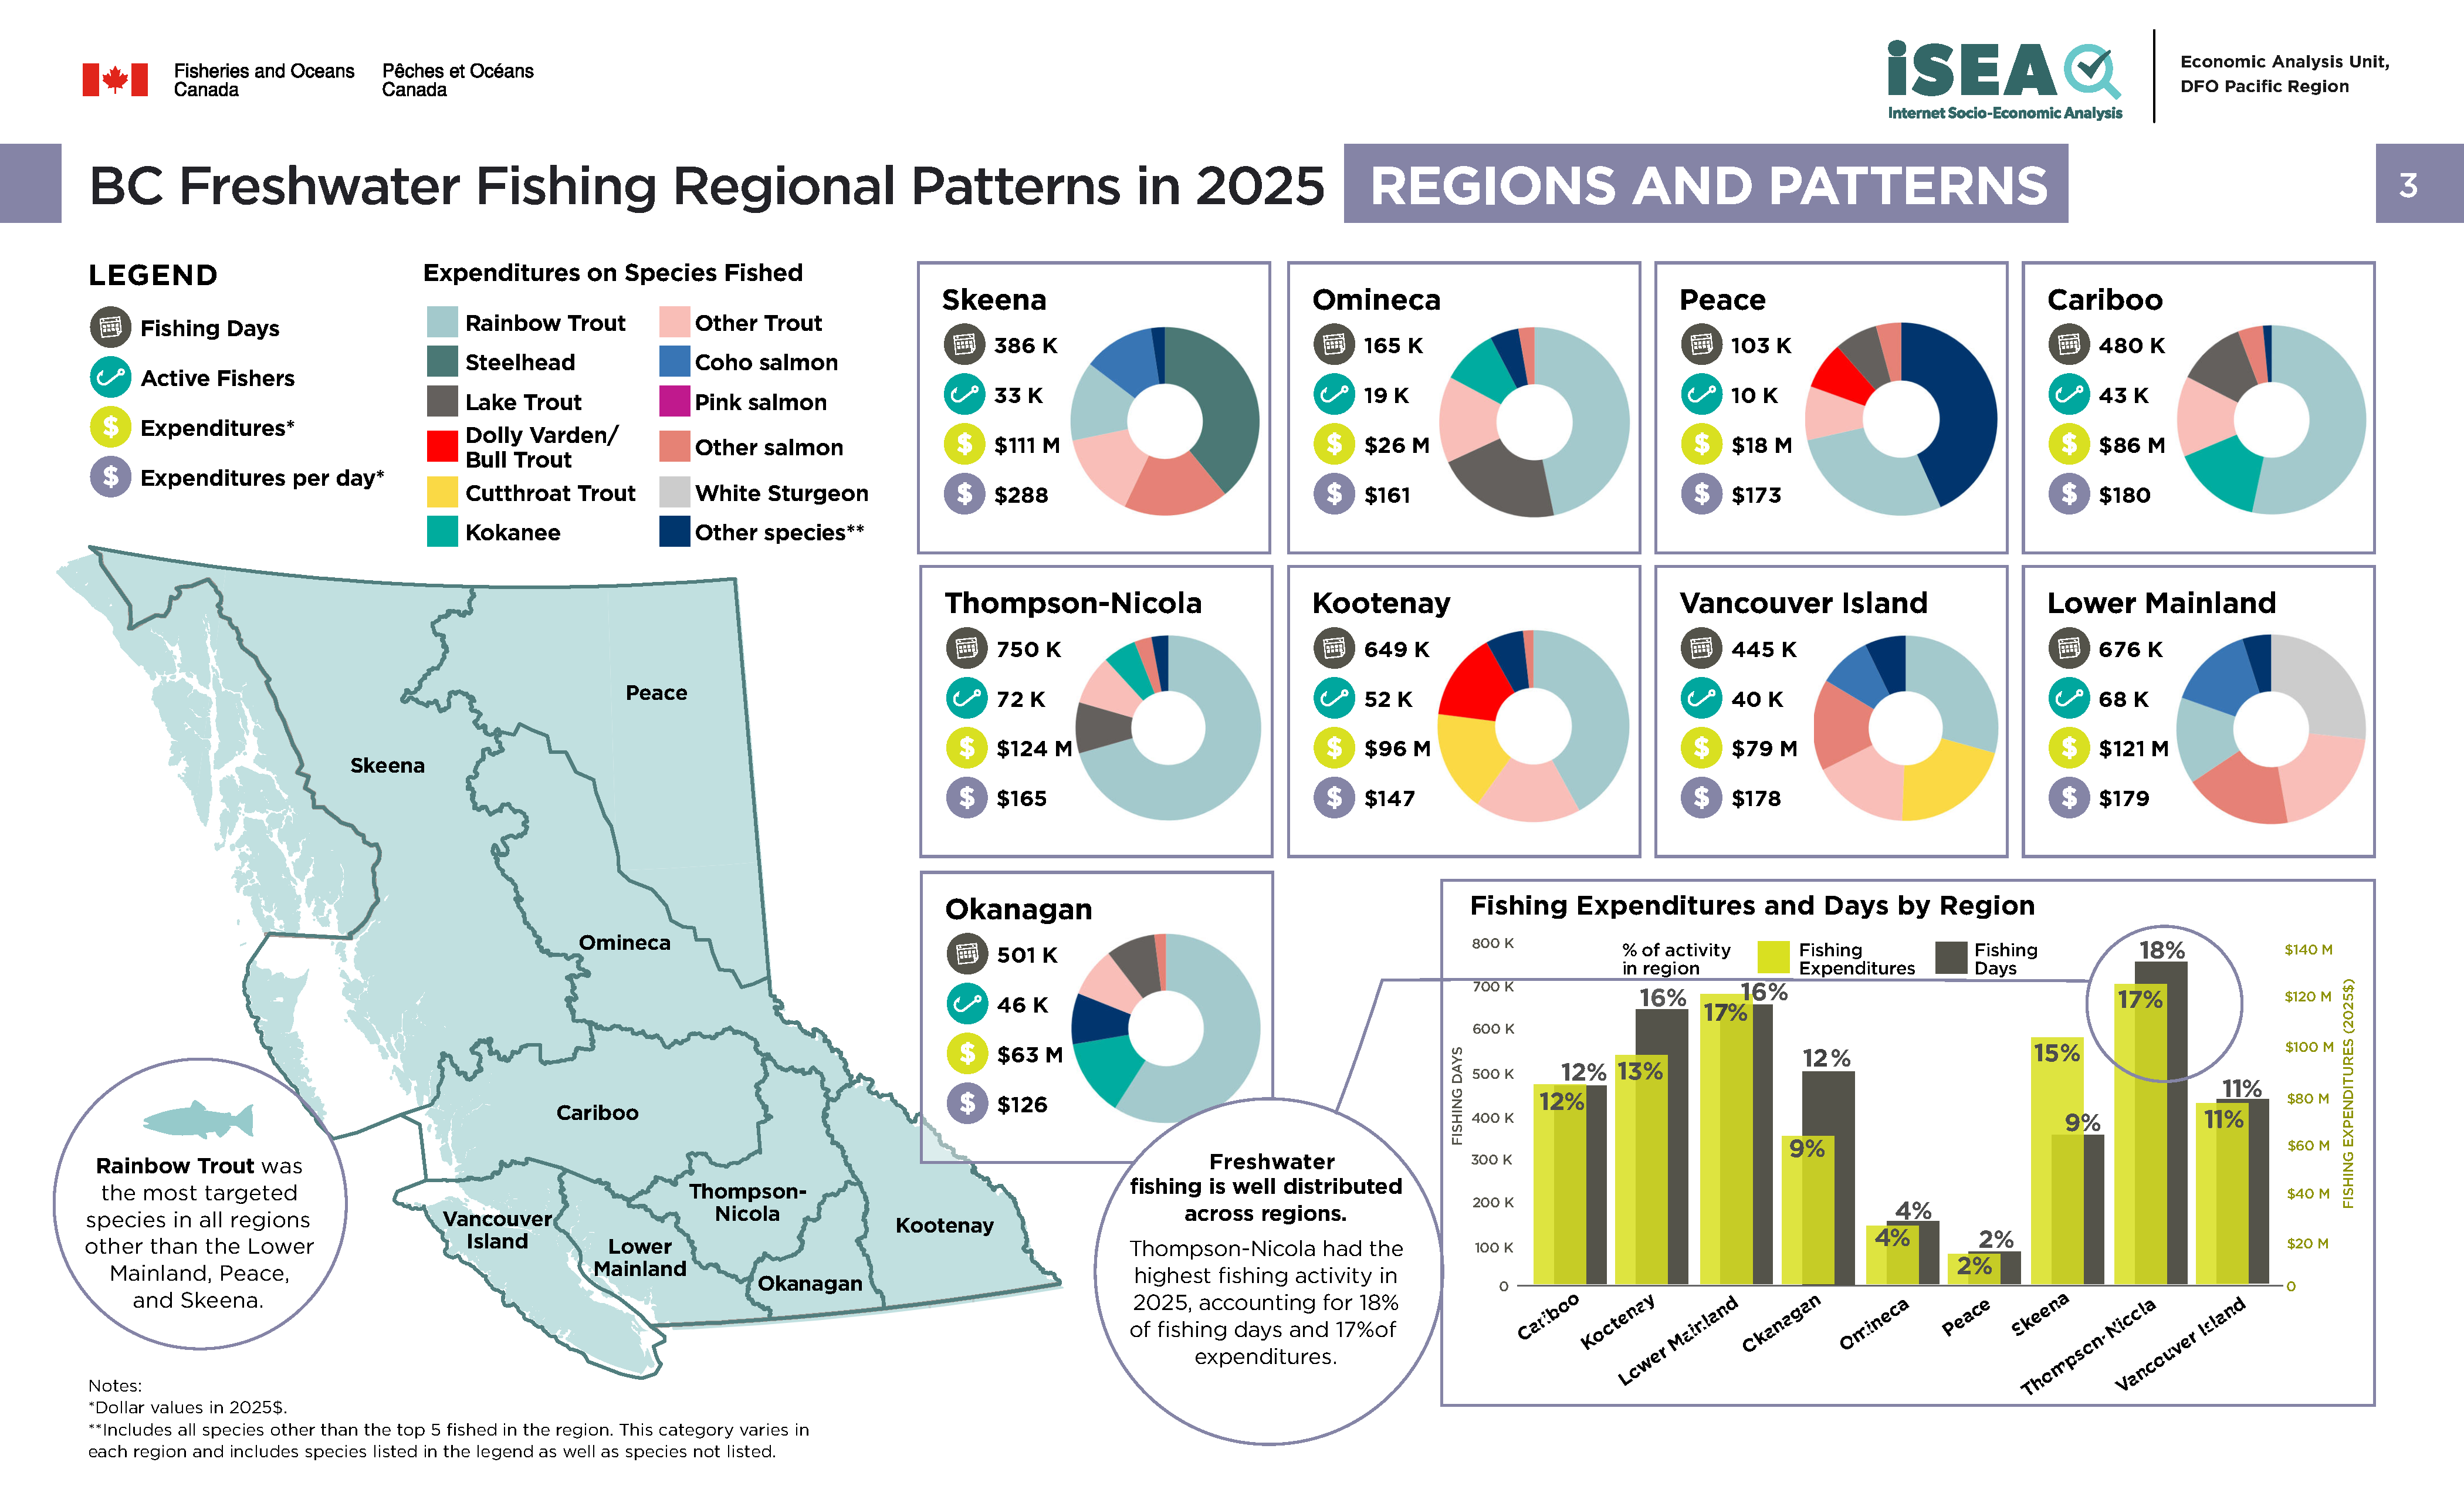
- Freshwater fishing activity is well distributed across regions
- Thompson-Nicola had the highest fishing activity in 2025, accounting for 18% of fishing days and 17% of expenditures
- Rainbow Trout was the most targeted species in all regions other than the Lower Mainland, Peace and Skeena
Key freshwater fishing metrics by BC region
(Values reflect the 2025-26 fishing year and dollar amounts are in 2025 dollars.)
Skeena
- Fishing days: 386K
- Active fishers: 33K
- Total expenditures: $111M
- Expenditures per day: $288
- Species expenditures: Steelhead (39%), Other Salmon (18%), Other Trout (15%), Rainbow Trout (14%), Coho Salmon (12%), Other (non-salmon, non-trout) (2%)
Omineca
- Fishing days: 165K
- Active fishers: 19K
- Total expenditures: $26M
- Expenditures per day: $161
- Species expenditures: Rainbow Trout (47%), Lake Trout (21%), Other Trout (15%), Kokanee (10%), Other (non-salmon, non-trout) (5%), Other Salmon (2%)
Peace
- Fishing days: 103K
- Active fishers: 10K
- Total expenditures: $18M
- Expenditures per day: $173
- Species expenditures: Other (non-salmon, non-trout) (43%), Rainbow Trout (28%), Other Trout (9%), Dolly Varden/Bull Trout (8%), Lake Trout (7%), Other Salmon (5%)
Cariboo
- Fishing days: 480K
- Active fishers: 43K
- Total expenditures: $86M
- Expenditures per day: $180
- Species expenditures: Rainbow Trout (53%), Kokanee (15%), Other Trout (14%), Lake Trout (12%), Other Salmon (4%), Other (non-salmon, non-trout) (2%)
Thompson-Nicola
- Fishing days: 750K
- Active fishers: 72K
- Total expenditures: $124M
- Expenditures per day: $165
- Species expenditures: Rainbow Trout (71%), Lake Trout (9%), Other Trout (9%), Kokanee (6%), Other Salmon (3%), Other (non-salmon, non-trout) (2%)
Kootenay
- Fishing days: 649K
- Active fishers: 52K
- Total expenditures: $96M
- Expenditures per day: $147
- Species expenditures: Rainbow Trout (42%), Other Trout (18%), Cutthroat Trout (17%), Dolly Varden/Bull Trout (15%), Other (non-salmon, non-trout) (6%), Other Salmon (2%)
Vancouver Island
- Fishing days: 445K
- Active fishers: 40K
- Total expenditures: $79M
- Expenditures per day: $178
- Species expenditures: Rainbow Trout (29%), Cutthroat Trout (21%), Other Trout (17%), Other Salmon (16%), Coho Salmon (9%), Other (non-salmon, non-trout) (8%)
Lower Mainland
- Fishing days: 676K
- Active fishers: 68K
- Total expenditures: $121M
- Expenditures per day: $179
- Species expenditures: White Sturgeon (27%), Other Trout (20%), Other Salmon (18%), Rainbow Trout (15%), Coho Salmon (15%), Other (non-salmon, non-trout) (5%)
Okanagan
- Fishing days: 501K
- Active fishers: 46K
- Total expenditures: $63M
- Expenditures per day: $126
- Species expenditures: Rainbow Trout (59%), Kokanee (13%), Other (non-salmon, non-trout) (9%), Other Trout (9%), Lake Trout (8%), Other Salmon (2%)
Fishing expenditures and days by region summary of pattern observed:
- In terms of fishing days, the Thompson-Nicola region accounted for the highest percentage at 18%, followed by Kootenay and the Lower Mainland at 16% each. Cariboo and Okanagan each represented 12% of fishing days, while Vancouver Island accounted for 11% and Skeena for 9%. The regions with the fewest fishing days were Omineca at 4% and Peace at 2%
- In terms of expenditures, the Thompson-Nicola region and the Lower Mainland accounted for the highest percentages at 17% each, followed by Skeena at 15%. Kootenay represented 13% of expenditures, while Cariboo accounted for 12%. Vancouver Island made up 11%, Okanagan 9%, Omineca 4%, and Peace 2%
BC freshwater fishing 2025, target species
Long text version
Key takeaways
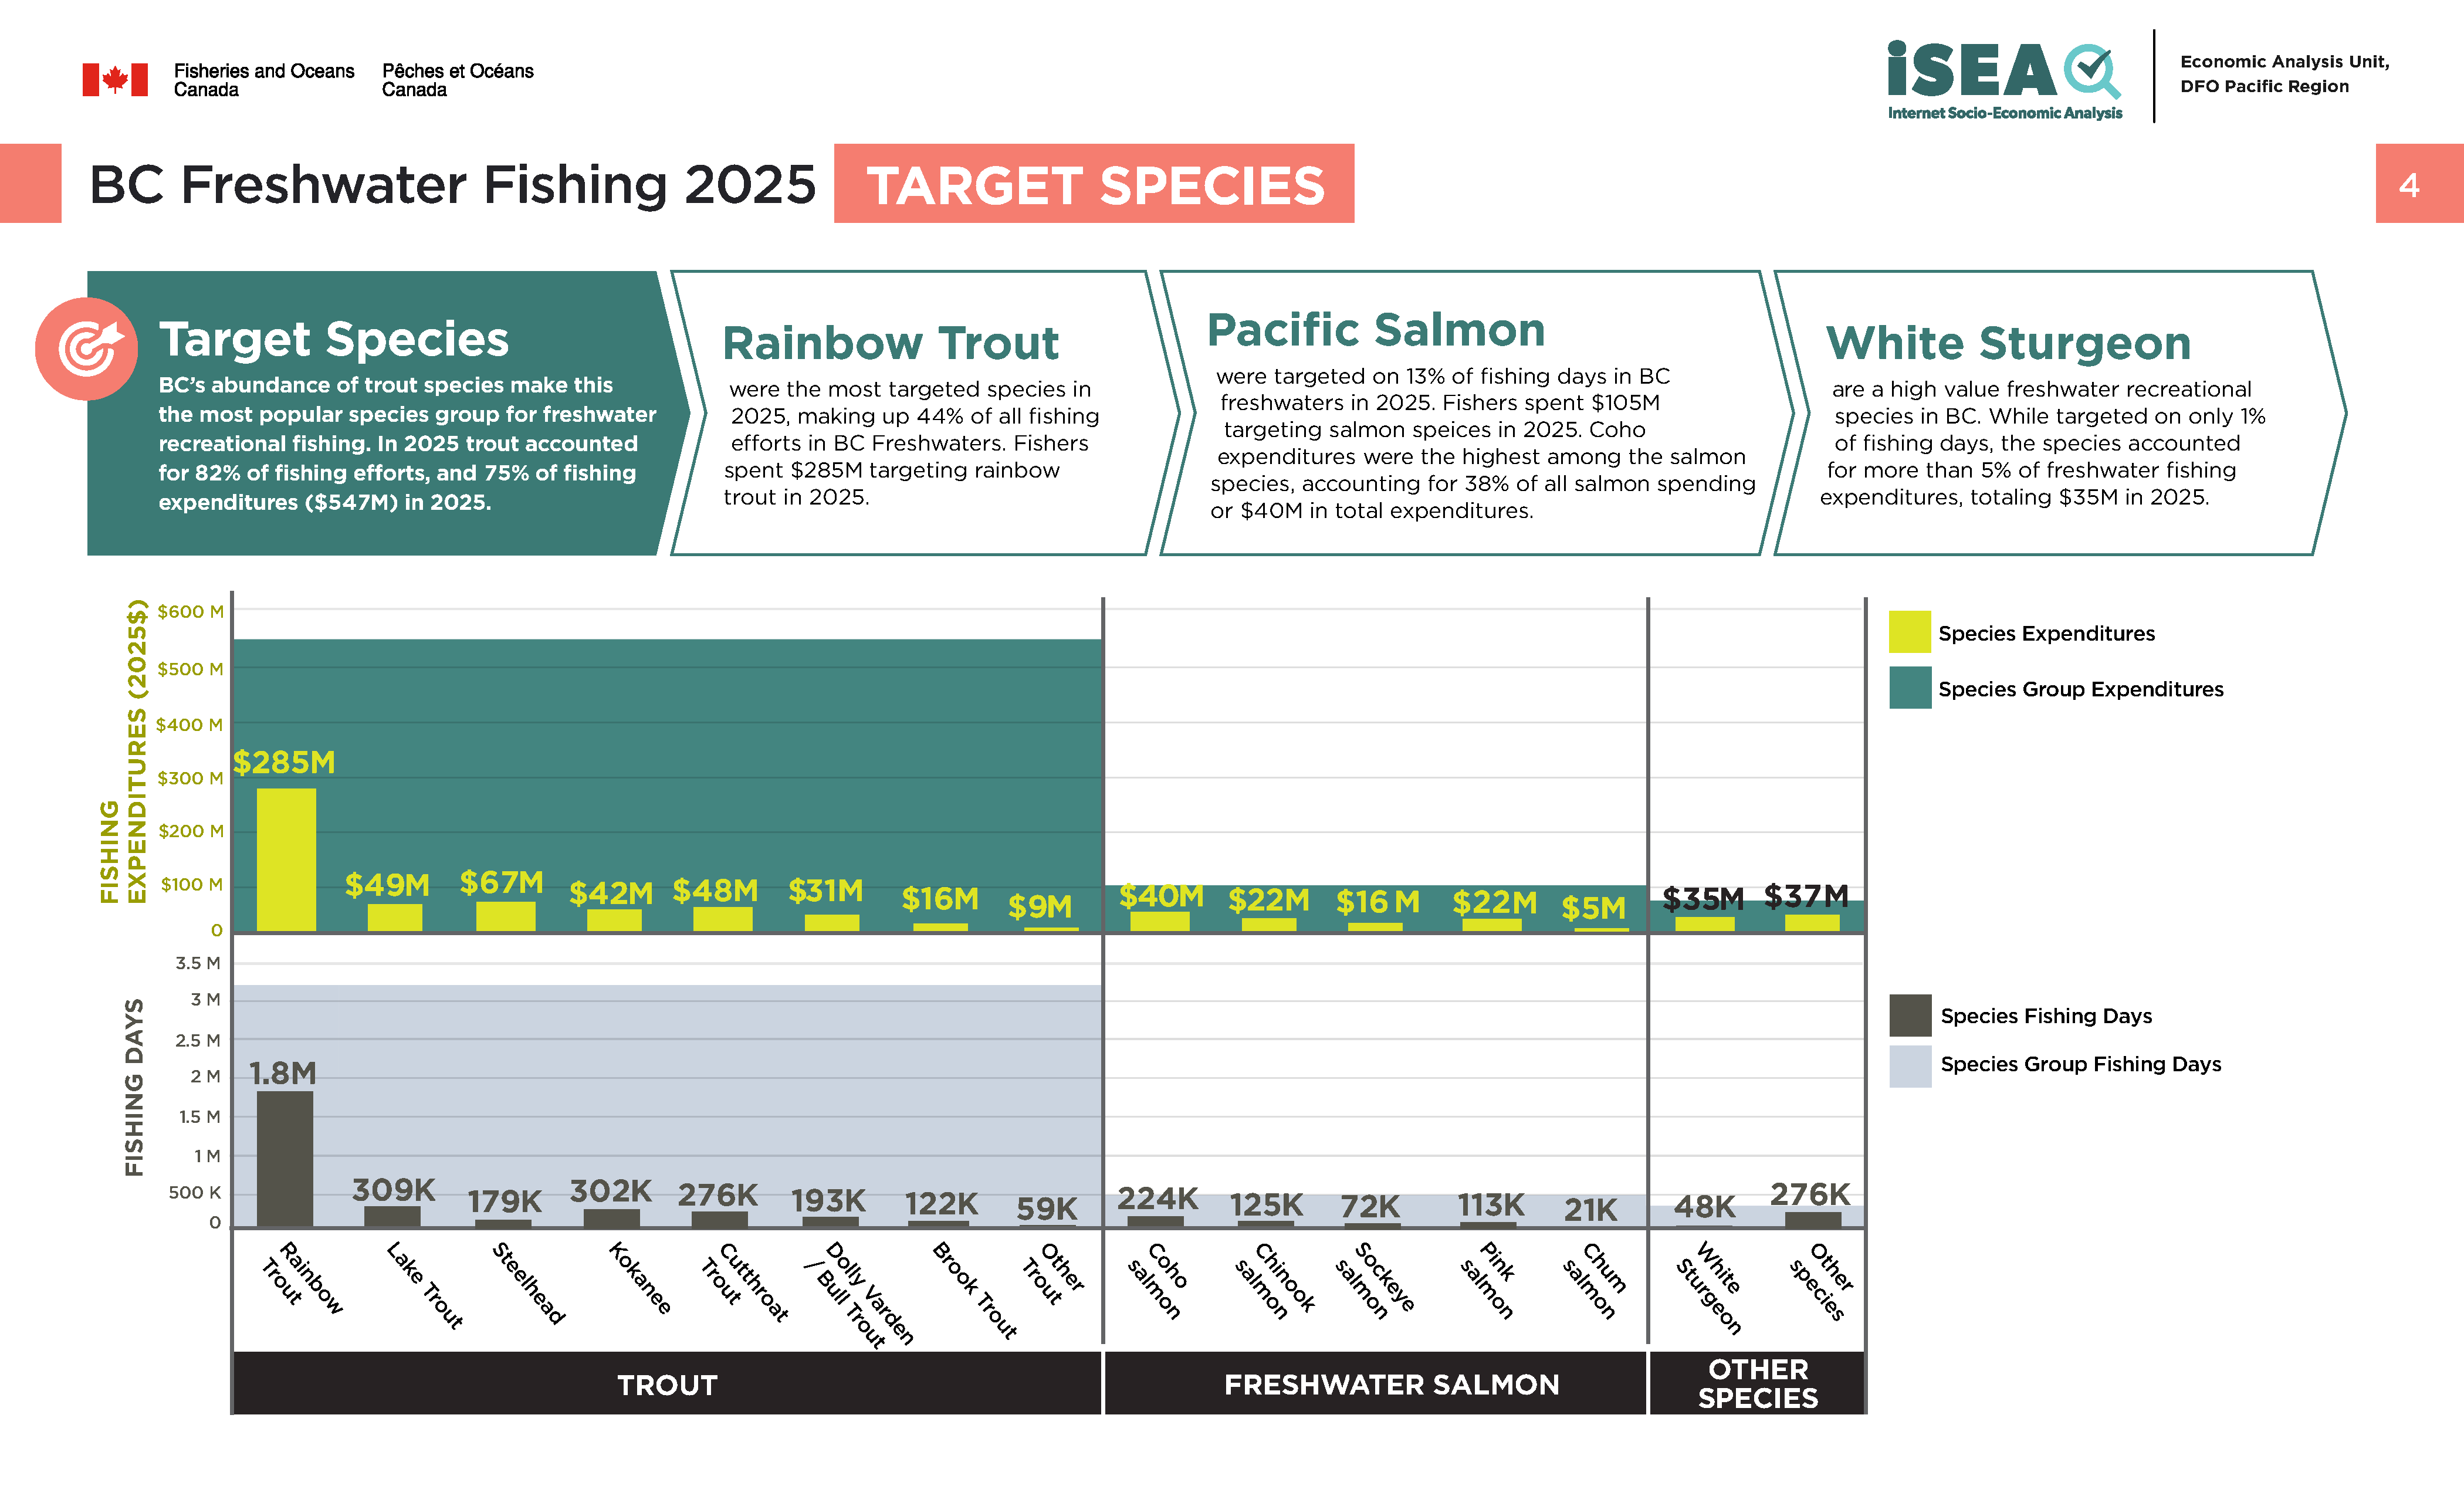
- BC’s abundance of trout species make this the most popular species group for freshwater recreational fishing. In 2025 trout accounted for 82% of fishing efforts, and 75% of fishing expenditures ($547M) in 2025
- Rainbow Trout were the most targeted species in 2025, making up 44% of all fishing efforts in BC freshwaters. Fishers spent $285M targeting Rainbow Trout in 2025
- Pacific Salmon were targeted on 13% of fishing days in BC freshwaters in 2025. Fishers spent $105M targeting salmon species in 2025. Coho expenditures were the highest among the salmon species, accounting for 38% of all salmon spending or $40M in total expenditures
- White Sturgeon are a high value freshwater recreational species in BC. While targeted on only 1% of fishing days, the species accounted for more than 5% of freshwater fishing expenditures, totaling $35M in 2025
Fishing days and expenditures by species group and species
(Values reflect the 2025-26 fishing year and dollar amounts are in 2025 dollars.)
Trout species group
- Total species group: 3.3M fishing days, $547M expenditures
- Rainbow Trout: 1.8M fishing days, $285M expenditures
- Lake Trout: 309K fishing days, $49M expenditures
- Steelhead: 179K fishing days, $67M expenditures
- Kokanee: 302K fishing days, $42M expenditures
- Cutthroat Trout: 276K fishing days, $48M expenditures
- Dolly Varden/Bull Trout: 193K fishing days, $31M expenditures
- Brook Trout: 122K fishing days, $16M expenditures
- Other Trout: 59K fishing days, $9M expenditures
Pacific Salmon species group
- Total species group: 553K fishing days, $105M expenditures
- Coho Salmon: 224K fishing days, $40M expenditures
- Chinook Salmon: 125K fishing days, $22M expenditures
- Sockeye Salmon: 72K fishing days, $16M expenditures
- Pink Salmon: 113K fishing days, $22M expenditures
- Chum Salmon: 21K fishing days, $5M expenditures
Other species
- Total: 324K fishing days, $72M expenditures
- White Sturgeon: 48K fishing days, $35M expenditures
- Other species: 276K fishing days, $37M expenditures
BC freshwater fishing 2025, salmon
Long text version
BC freshwater fishing 2025, salmon
Key takeaways
- Pacific Salmon are an important species for the freshwater recreational fishing sector
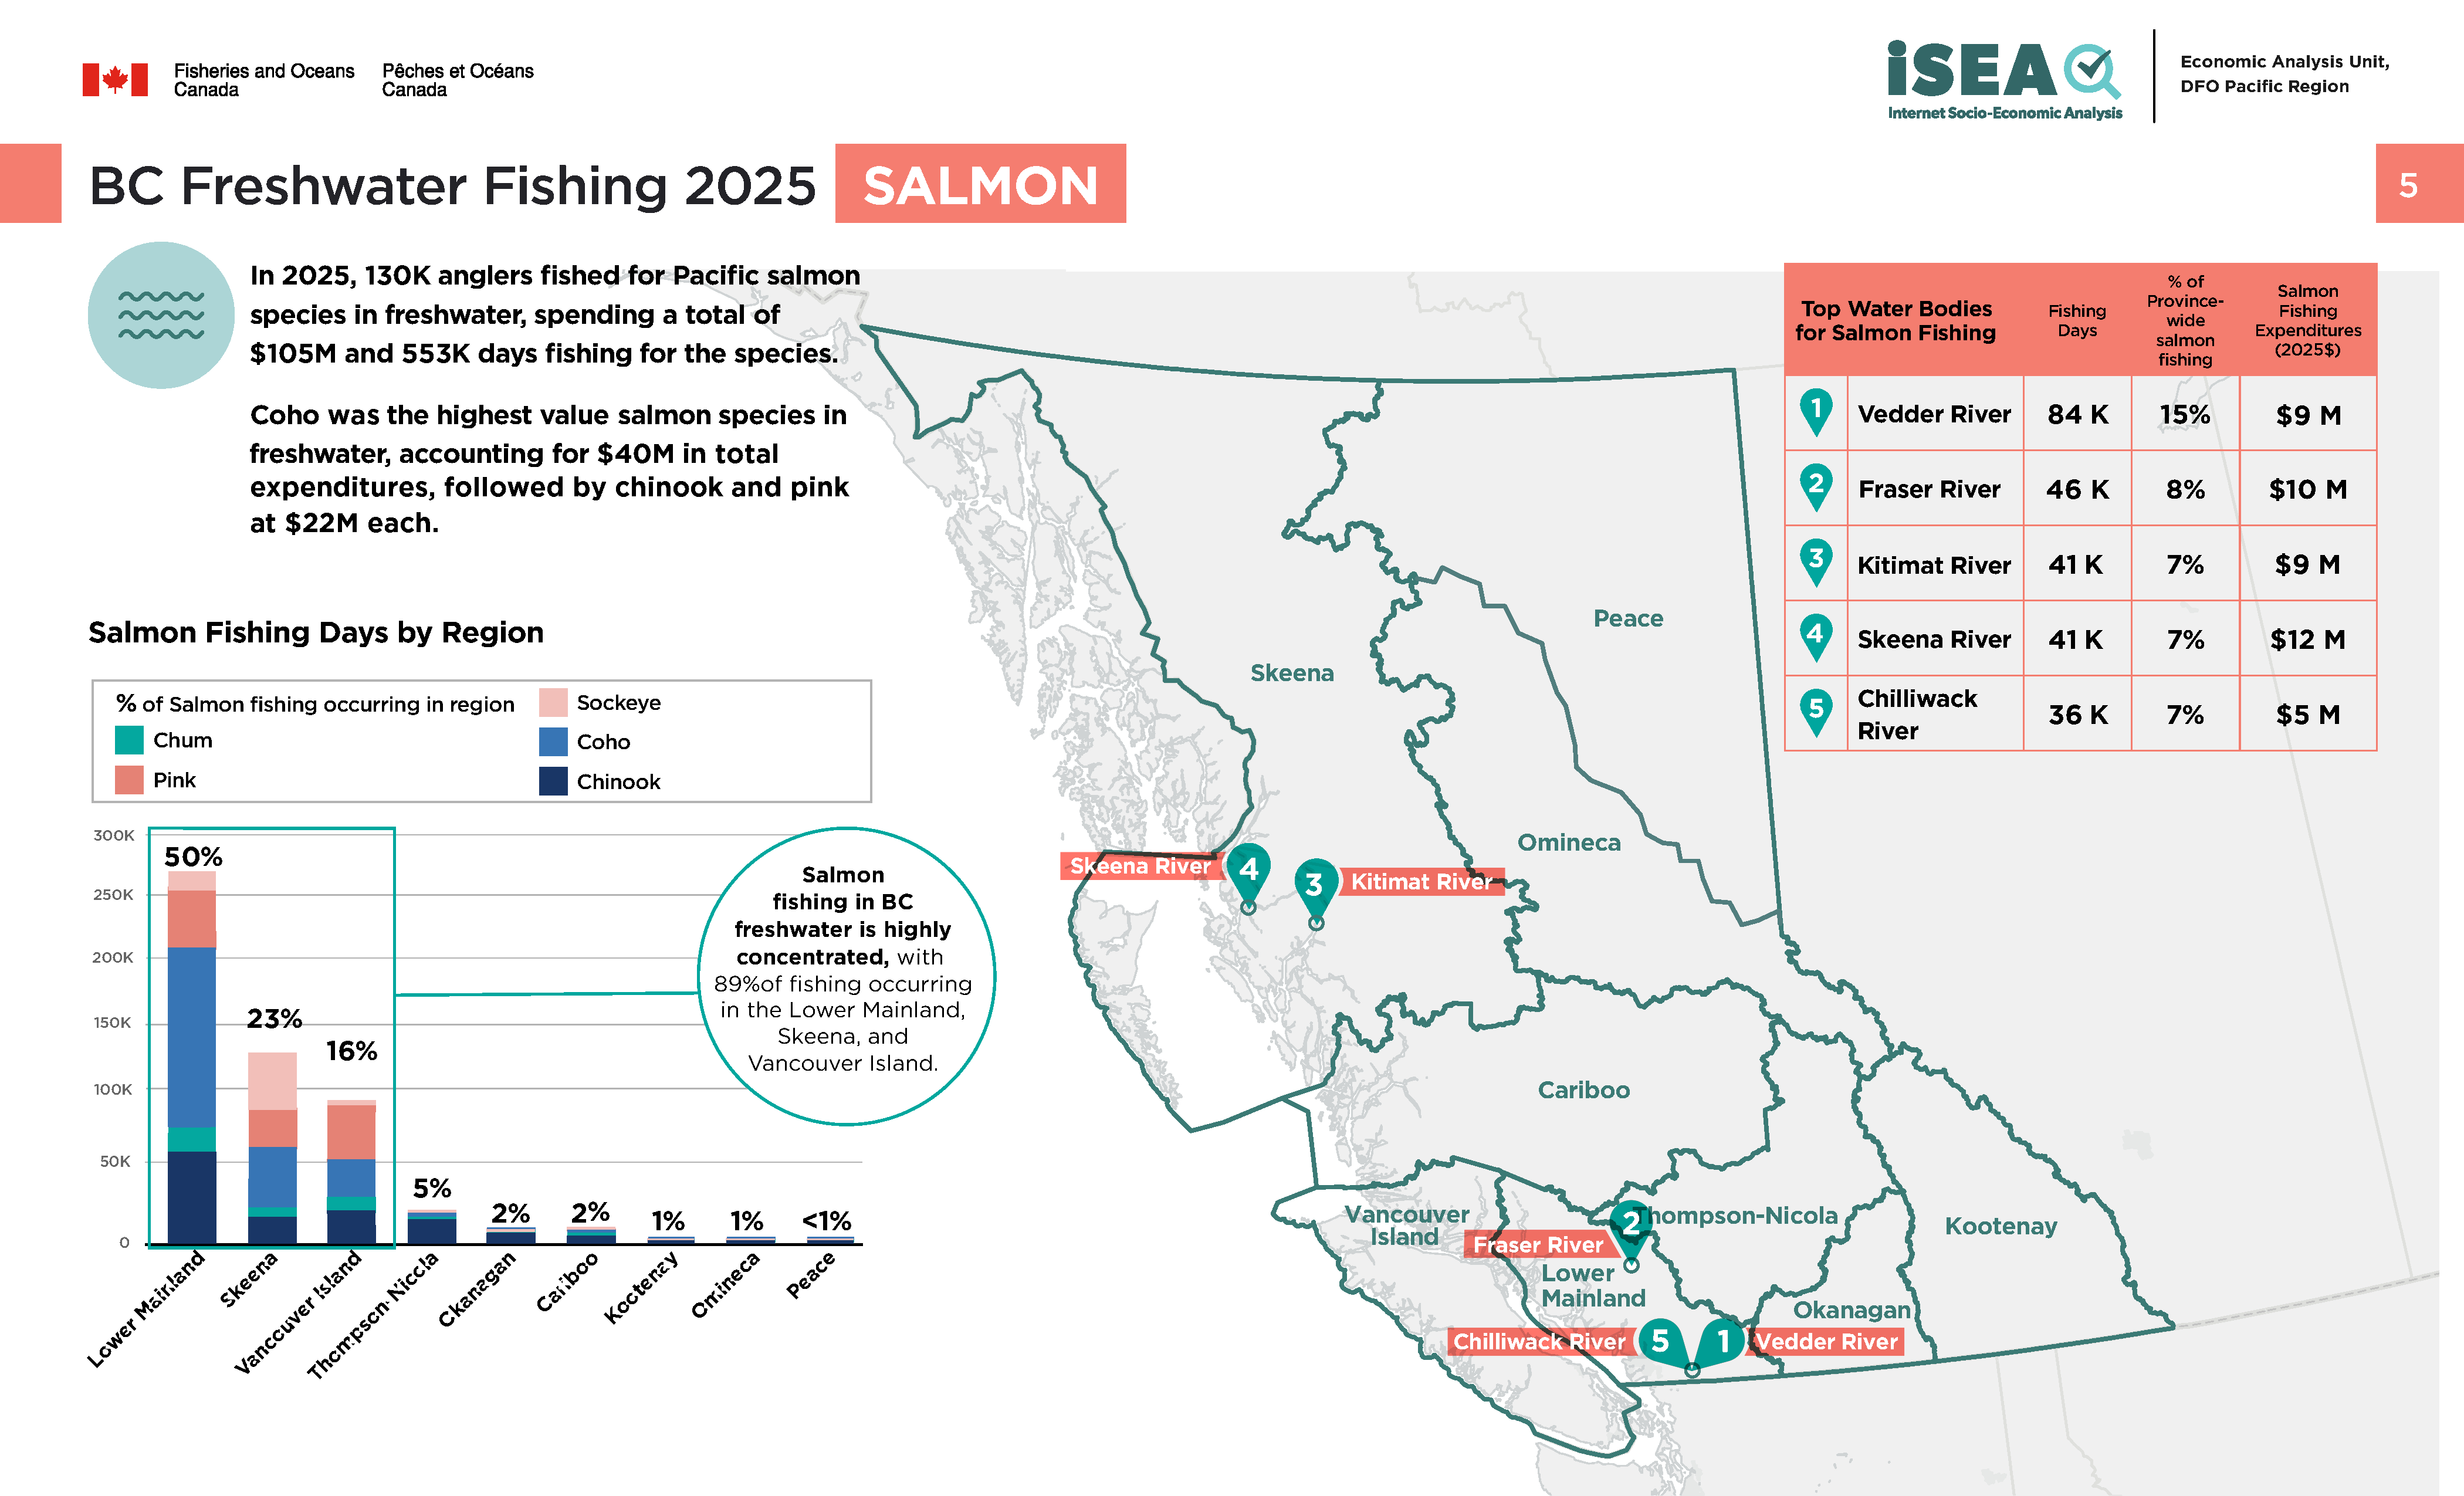
- In 2025, 130K anglers fished for Pacific Salmon species in freshwater, spending a total of $105M and 553K days fishing for the species
- Coho and Chinook were the highest value salmon species in freshwater, accounting for $40M and $22M in total expenditures, respectively
- Salmon fishing in freshwater is highly concentrated, with 89% of fishing occurring in the Lower Mainland, Skeena, and Vancouver Island
- The top waterbodies for freshwater salmon fishing in 2025 were the Vedder River, Fraser River, and Chilliwack River in the Lower Mainland, and the Kitimat River and Skeena River in the Skeena region
Salmon – fishing days by BC region and species
Lower Mainland
- Chinook: 61,433
- Coho: 139,657
- Sockeye: 21,832
- Pink: 43,752
- Chum: 9,806
- All Salmon: 276,480
- Percentage of total salmon fishing in region: 50%
Skeena
- Chinook: 13,673
- Coho: 46,114
- Sockeye: 35,627
- Pink: 29,169
- Chum: 4,966
- All Salmon: 129,549
- Percentage of total salmon fishing in region: 23%
Vancouver Island
- Chinook: 21,531
- Coho: 27,852
- Sockeye: 2,629
- Pink: 30,618
- Chum: 4,763
- All Salmon: 87,392
- Percentage of total salmon fishing in region: 16%
Thompson-Nicola
- Chinook: 12,824
- Coho: 3,131
- Sockeye: 4,965
- Pink: 4,477
- Chum: 285
- All Salmon: 25,682
- Percentage of total salmon fishing in region: 5%
Okanagan
- Chinook: 7,924
- Coho: 1,159
- Sockeye: 1,300
- Pink: 715
- Chum: 49
- All Salmon: 11,147
- Percentage of total salmon fishing in region: 2%
Cariboo
- Chinook: 4,454
- Coho: 4,129
- Sockeye: 1,611
- Pink: 2,293
- Chum: 377
- All Salmon: 12,864
- Percentage of total salmon fishing in region: 2%
Omineca
- Chinook: 581
- Coho: 859
- Sockeye: 3,385
- Pink: 1,042
- Chum: 98
- All Salmon: 5,966
- Percentage of total salmon fishing in region: 1%
Peace
- Chinook: 105
- Coho: 254
- Sockeye: 196
- Pink: 328
- Chum: 49
- All Salmon: 933
- Percentage of total salmon fishing in region: <1%
Kootenay
- Chinook: 2,113
- Coho: 483
- Sockeye: 270
- Pink: 474
- Chum: 125
- All Salmon: 3,466
- Percentage of total salmon fishing in region: 1%
In 2025, the top waterbodies for freshwater salmon fishing, as well as their fishing days and expenditures, were as follows:
Vedder River (Lower Mainland)
- Salmon fishing days: 84K
- % of province-wide salmon fishing: 15%
- Salmon expenditures: $9M
Fraser River (Lower Mainland)
- Salmon fishing days: 46K
- % of province-wide salmon fishing: 8%
- Salmon expenditures: $10M
Kitimat River (Skeena)
- Salmon fishing days: 41K
- % of province-wide salmon fishing: 7%
- Salmon expenditures: $9M
Skeena River (Skeena)
- Salmon fishing days: 41K
- % of province-wide salmon fishing: 7%
- Salmon expenditures: $12M
Chilliwack River (Lower Mainland)
- Salmon fishing days: 36K
- % of province-wide salmon fishing: 7%
- Salmon expenditures: $5M
BC freshwater fishing 2025, Fraser River white sturgeon
Long text version
Key takeaways
- White Sturgeon are a high value freshwater recreational fishing species in BC
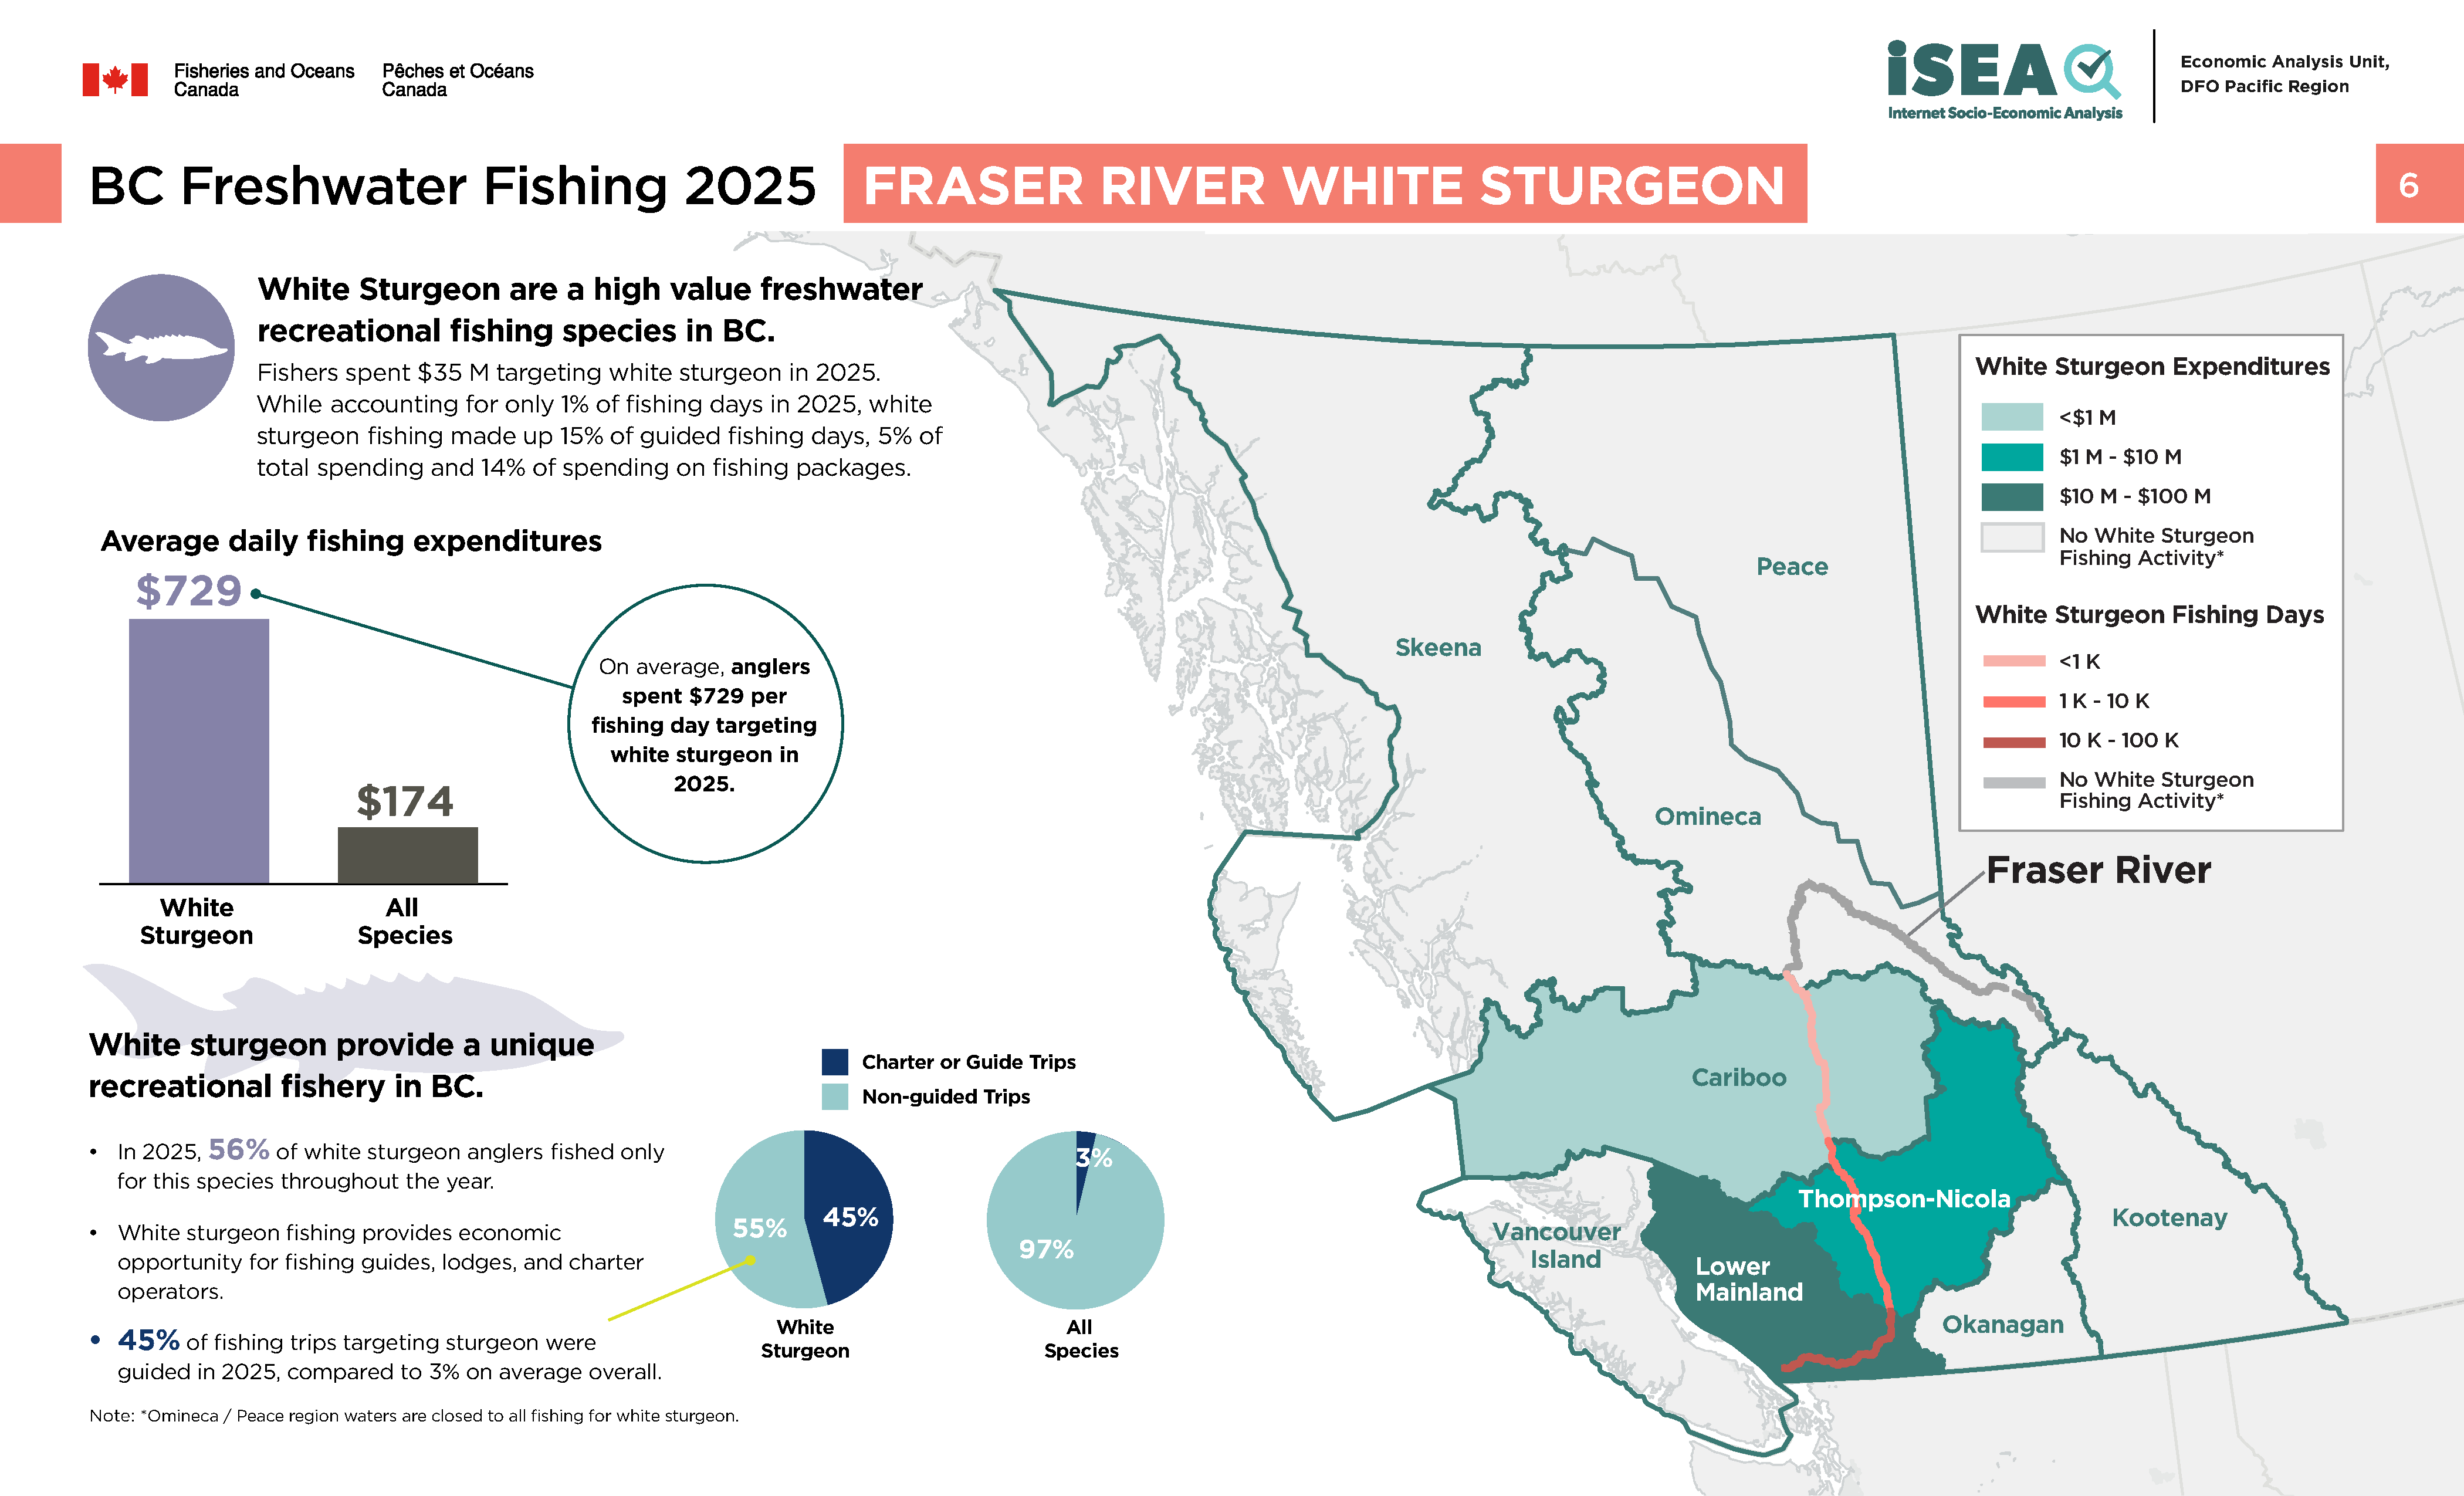
- Fishers spent $35M targeting White Sturgeon in 2025
- While accounting for only 1% of fishing days in 2025, White Sturgeon fishing made up 15% of guided fishing days, 5% of total spending and 14% of spending on fishing packages
- Anglers spent $729 per fishing day on average targeting White Sturgeon in 2025, compared to $174 per day on average overall
- White Sturgeon provide a unique recreational fishery in BC
- In 2025, 56% of White Sturgeon anglers fished only for this species throughout the year
- White Sturgeon fishing provides economic opportunity for fishing guides, lodges, and charter operators. 45% of fishing trips targeting sturgeon were guided in 2025, compared to 3% on average overall
White Sturgeon – fishing days and expenditures by BC region
(Values reflect the 2025-26 fishing year and dollar amounts are in 2025 dollars.)
- White Sturgeon fishing in BC is limited to the Fraser River, which runs through the Lower Mainland, Thompson-Nicola, Cariboo, and Omineca regions. However, Omineca region is closed to all fishing for White Sturgeon
- In 2025, the most White Sturgeon fishing occurred in the Lower Mainland portion of the Fraser River, with around 87% of days and 93% of expenditures spent targeting the species in this region
- Sturgeon fishing in the Thompson-Nicola region accounted for around 8% of days and 5% of fishing expenditures in 2025
BC freshwater fishing 2025, steelhead
Long text version
Key takeaways
- Steelhead are one of the top species fished recreationally in BC freshwaters
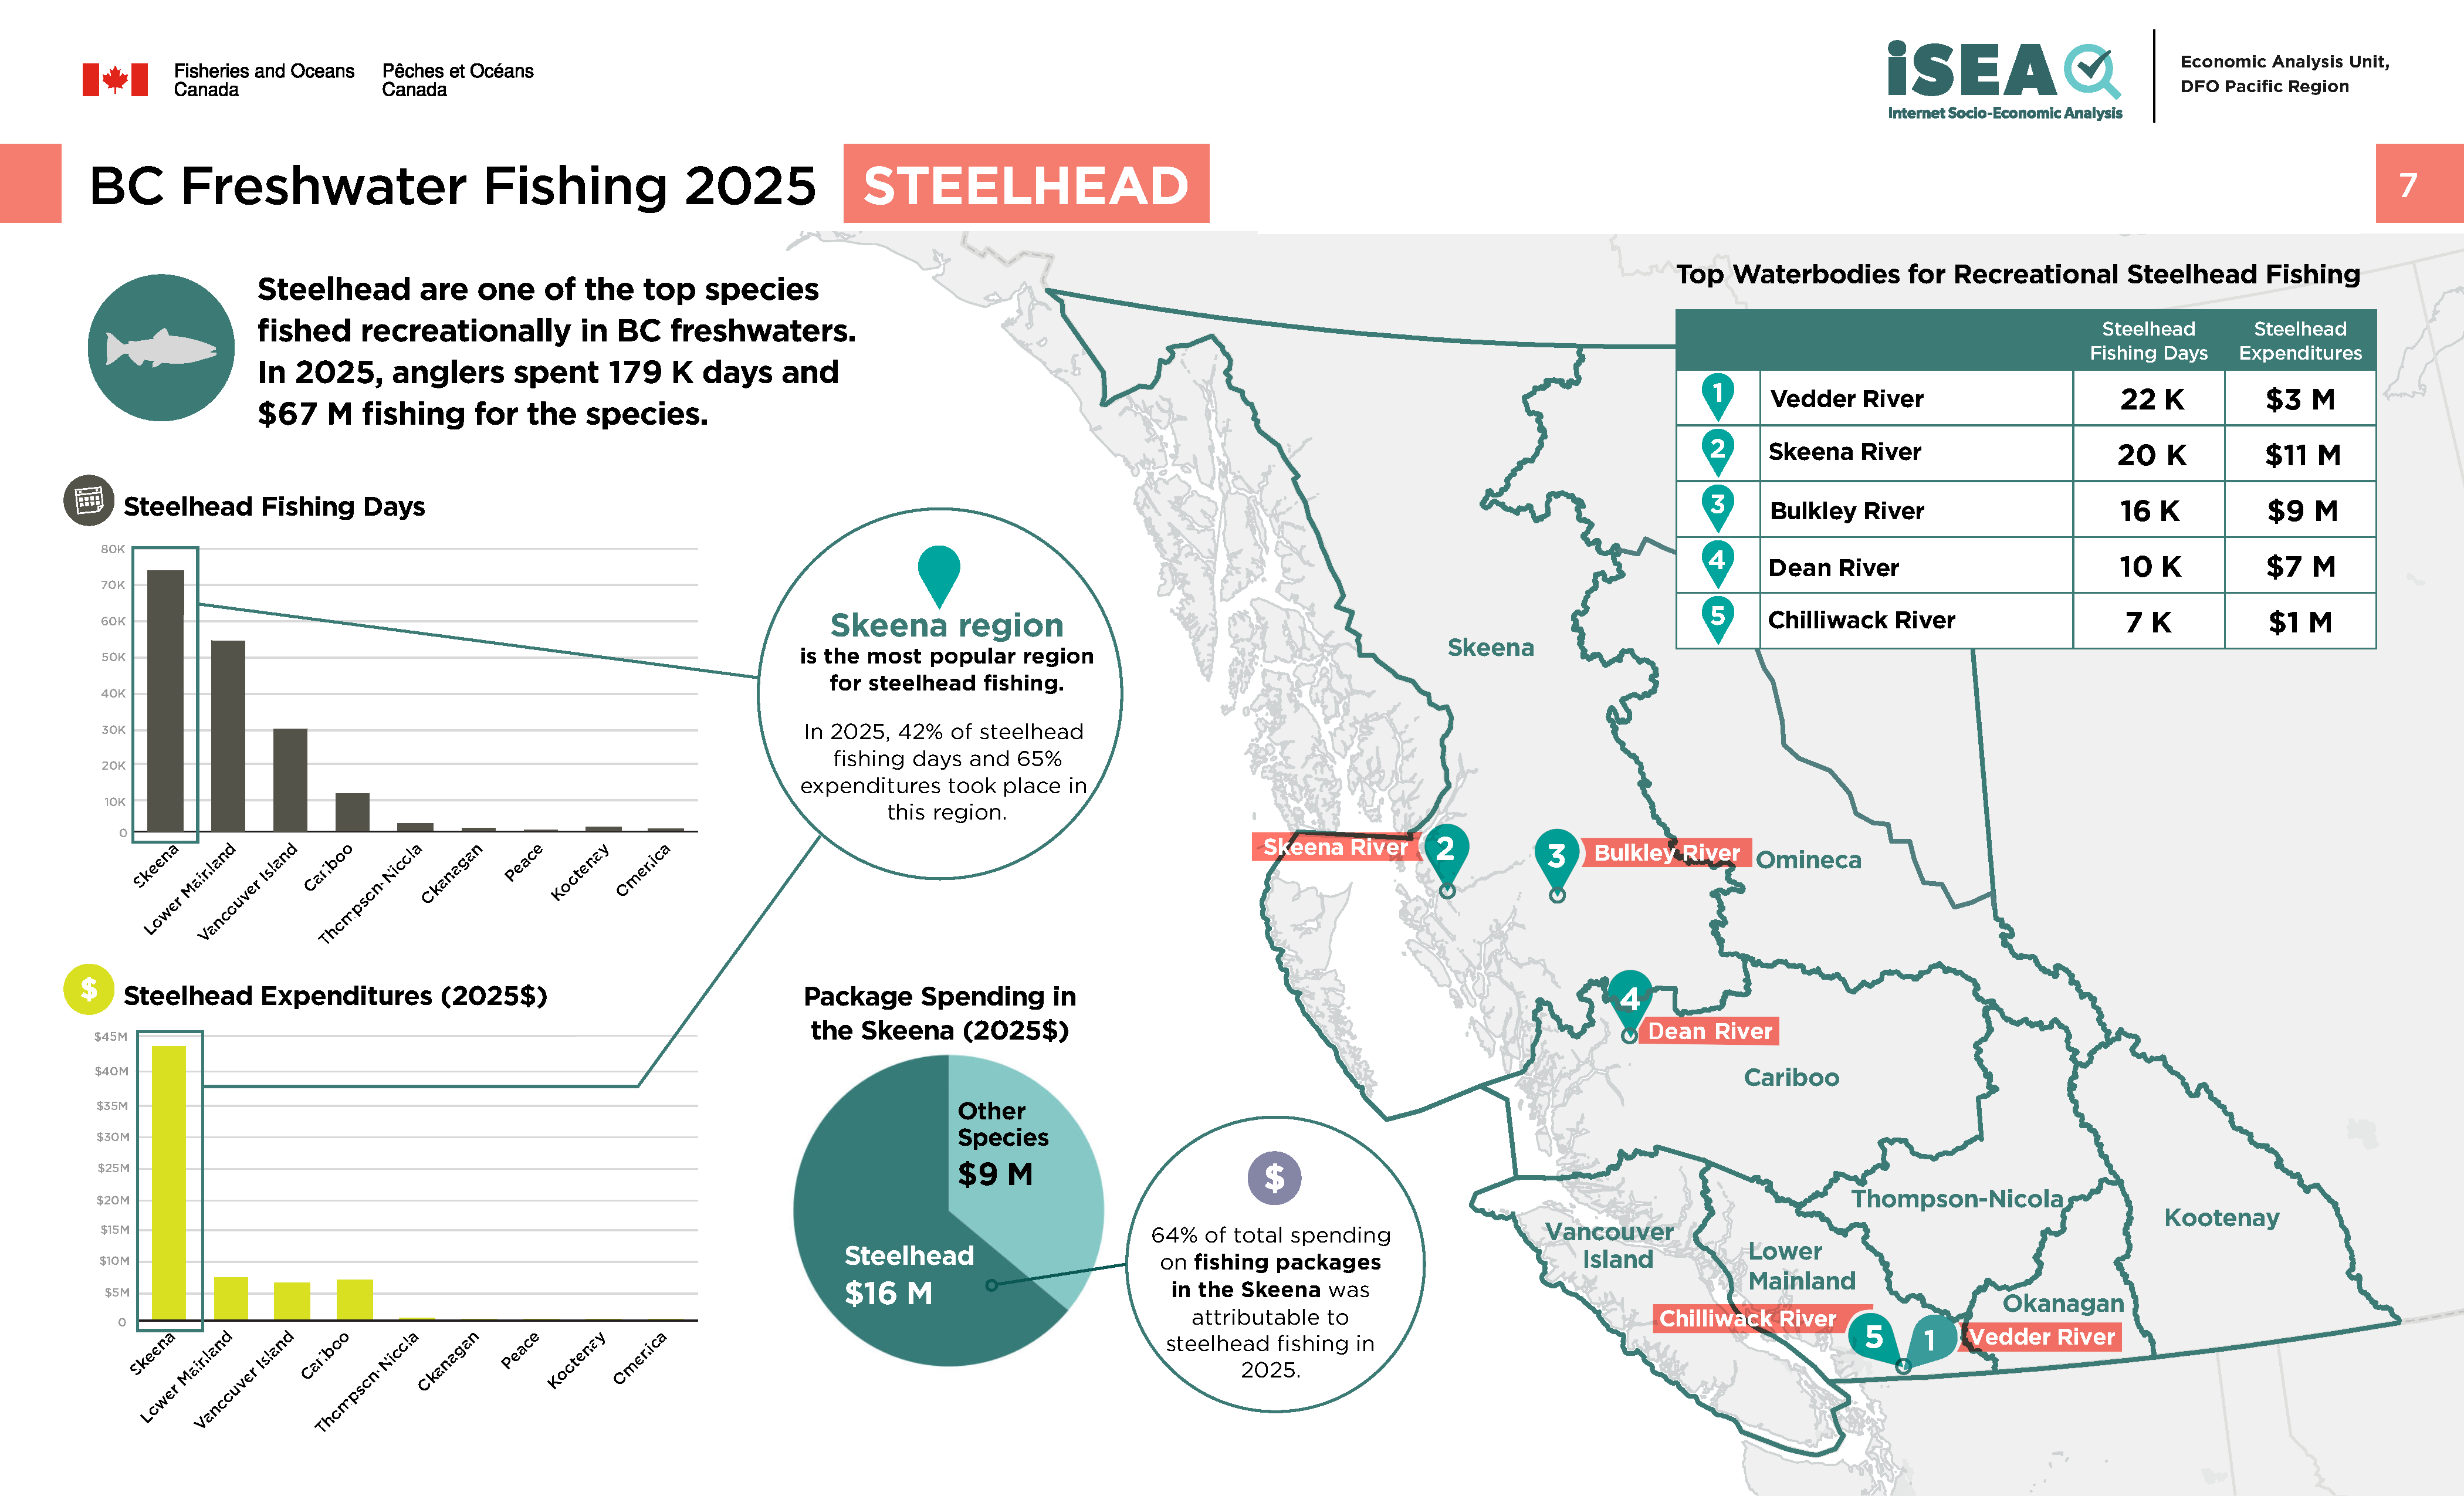
- In 2025, anglers spent 179K days and $67M fishing for the species
- Skeena region is the most popular region for steelhead fishing
- In 2025, 42% of fishing days and 65% of expenditures spent targeting steelhead took place in this region
- 64% of total spending on fishing packages in the Skeena region was attributable to steelhead fishing in 2025, accounting for $16M in expenditures
Steelhead – fishing days and expenditures by BC region
(Values reflect the 2025 fishing year and dollar amounts are in 2025 dollars.)
Skeena
- Fishing days: 74,851
- Total expenditures: $43,343,522
Lower Mainland
- Fishing days: 55,572
- Total expenditures: $7,990,554
Vancouver Island
- Fishing days: 30,535
- Total expenditures: $7,101,627
Cariboo
- Fishing days: 11,125
- Total expenditures: $7,322,839
Thompson-Nicola
- Fishing days: 2,922
- Total expenditures: $556,672
Kootenay
- Fishing days: 2,040
- Total expenditures: $299,487
Omineca
- Fishing days: 504
- Total expenditures: $368,432
Peace
- Fishing days: 150
- Total expenditures: $36,479
Okanagan
- Fishing days: 1,190
- Total expenditures: $144,637
In 2025, the top waterbodies for steelhead fishing, as well as their fishing days and expenditures, were as follows:
- In the Lower Mainland, Vedder River had the most steelhead fishing days at 22K, with expenditures reaching $3M
- In the Skeena region, Skeena River came in second with 20K steelhead fishing days and higher expenditures totaling $11M
- Also in the Skeena region, Bulkley River was the third most common waterbody for steelhead fishing with 16K fishing days but with lower expenditures of $9M
- Following this, Dean River in Cariboo had 10K steelhead fishing days and expenditures amounting to $7M
- Finally, in the Lower Mainland, Chilliwack River also had 7K steelhead fishing days but with lower expenditures of $1M
BC freshwater recreational fishing, 2000 to 2025 trends
Long text version
Key takeaways
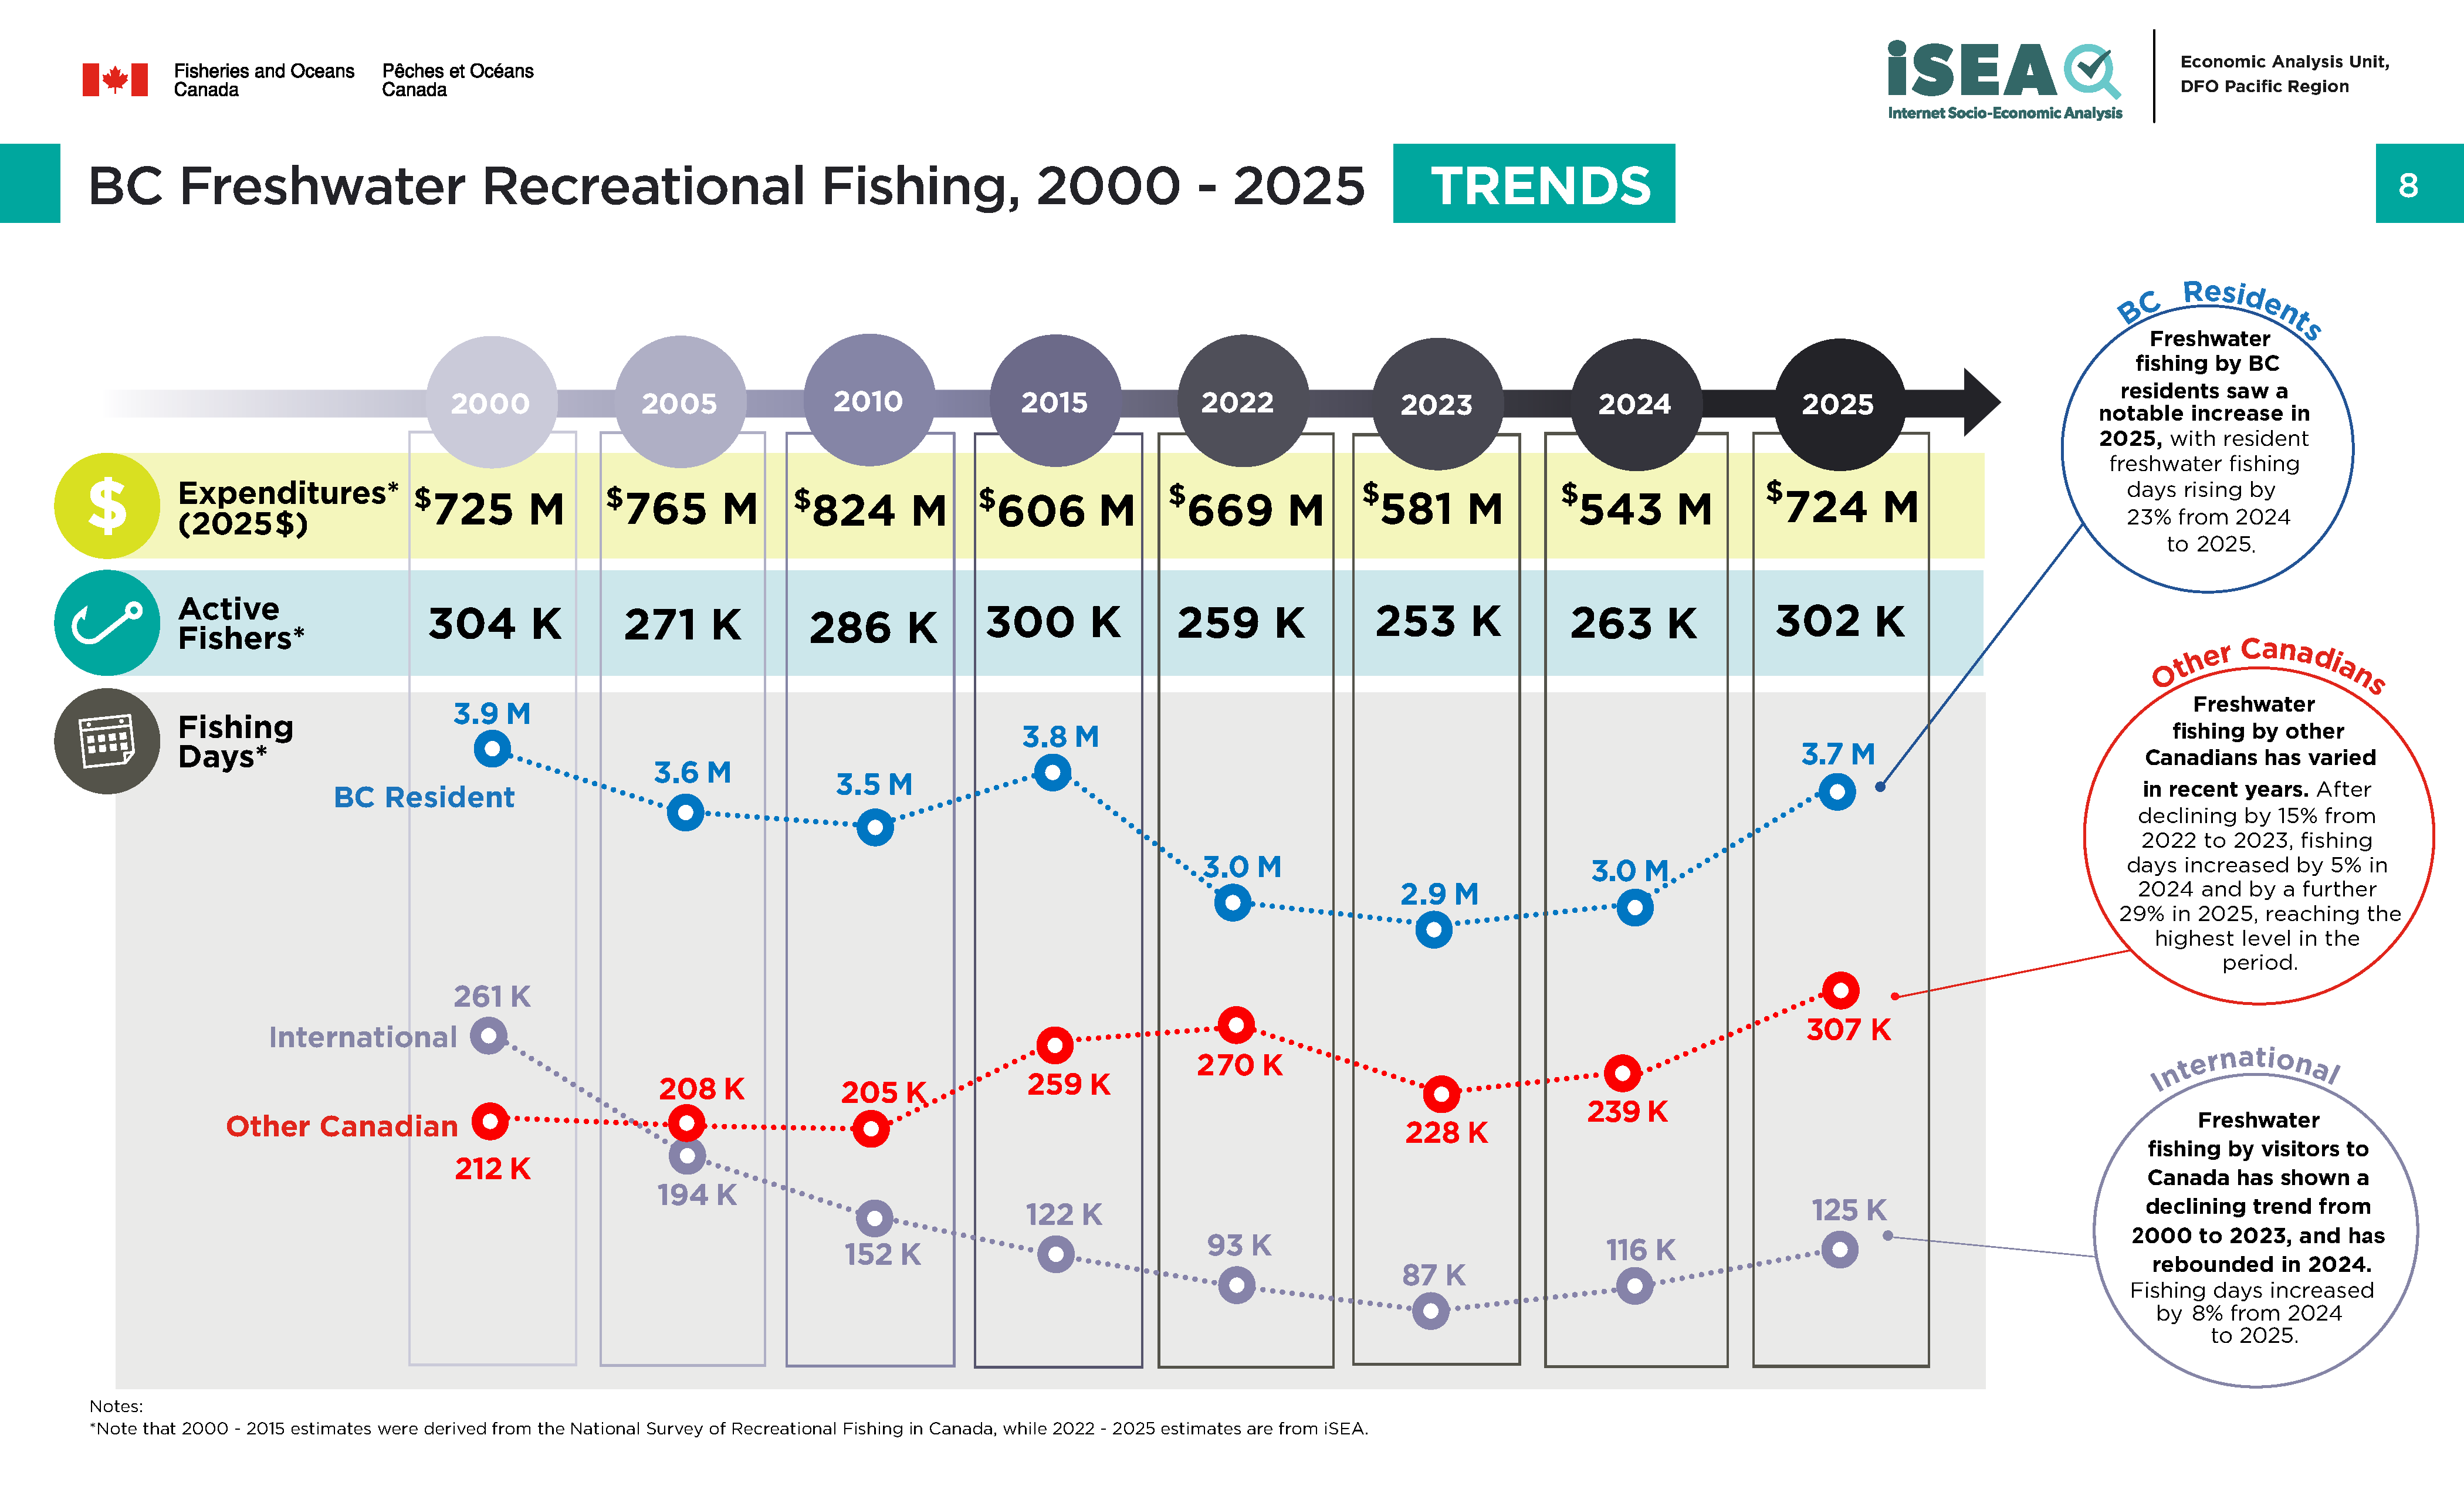
- The total expenditures for fishing and the number of active fishers have fluctuated substantially since 2000
- Active fishers fell from 2000 to 2005, rose from 2005 to 2015, then decreased from 2015 to 2023 and rebounded in 2024 and increased further in 2025
- Expenditures increased from 2000 to 2010, dropped from 2010 to 2024, and then rebounded in 2025
- Total fishing days showed a declining trend since 2000; however, the trend varies by fisher residency
- Freshwater fishing by BC residents saw a notable increase in 2025, with resident freshwater fishing days rising by 23% from 2024 to 2025
- Freshwater fishing by other Canadians has varied in recent years. After declining by 15% from 2022 to 2023, fishing days increased by 5% in 2024 and by a further 29% in 2025, reaching the highest level in the period
- Freshwater fishing by visitors to Canada has shown a declining trend from 2000 to 2023 and rebounded in 2024. Fishing days increased by 8% from 2024 to 2025
Key freshwater fishing metrics by year, 2000 to 2025
Total expenditures (2025$)
- 2000: $725M
- 2005: $765M
- 2010: $824M
- 2015: $606M
- 2022: $669M
- 2023: $581M
- 2024: $543M
- 2025: $724M
Active fishers
- 2000: 304K
- 2005: 271K
- 2010: 286K
- 2015: 300K
- 2022: 259K
- 2023: 253K
- 2024: 263K
- 2025: 302K
Fishing days
- 2000: Total 4.4M (Resident 3.9M, Non-Resident Canadian 212K, International 261K)
- 2005: Total 4.0M (Resident 3.6M, Non-Resident Canadian 208K, International 194K)
- 2010: Total 3.8M (Resident 3.5M, Non-Resident Canadian 205K, International 152K)
- 2015: Total 4.2M (Resident 3.8M, Non-Resident Canadian 259K, International 122K)
- 2022: Total 3.4M (Resident 3.0M, Non-Resident Canadian 270K, International 93K)
- 2023: Total 3.2M (Resident 2.9M, Non-Resident Canadian 228K, International 87K)
- 2024: Total 3.4M (Resident 3.0M, Non-Resident Canadian 239K, International 116K)
- 2025: Total 4.2M (Resident 3.7M, Non-Resident Canadian 307K, International 125K)
BC freshwater fishing expenditures, 2025
Long text version
Key takeaways
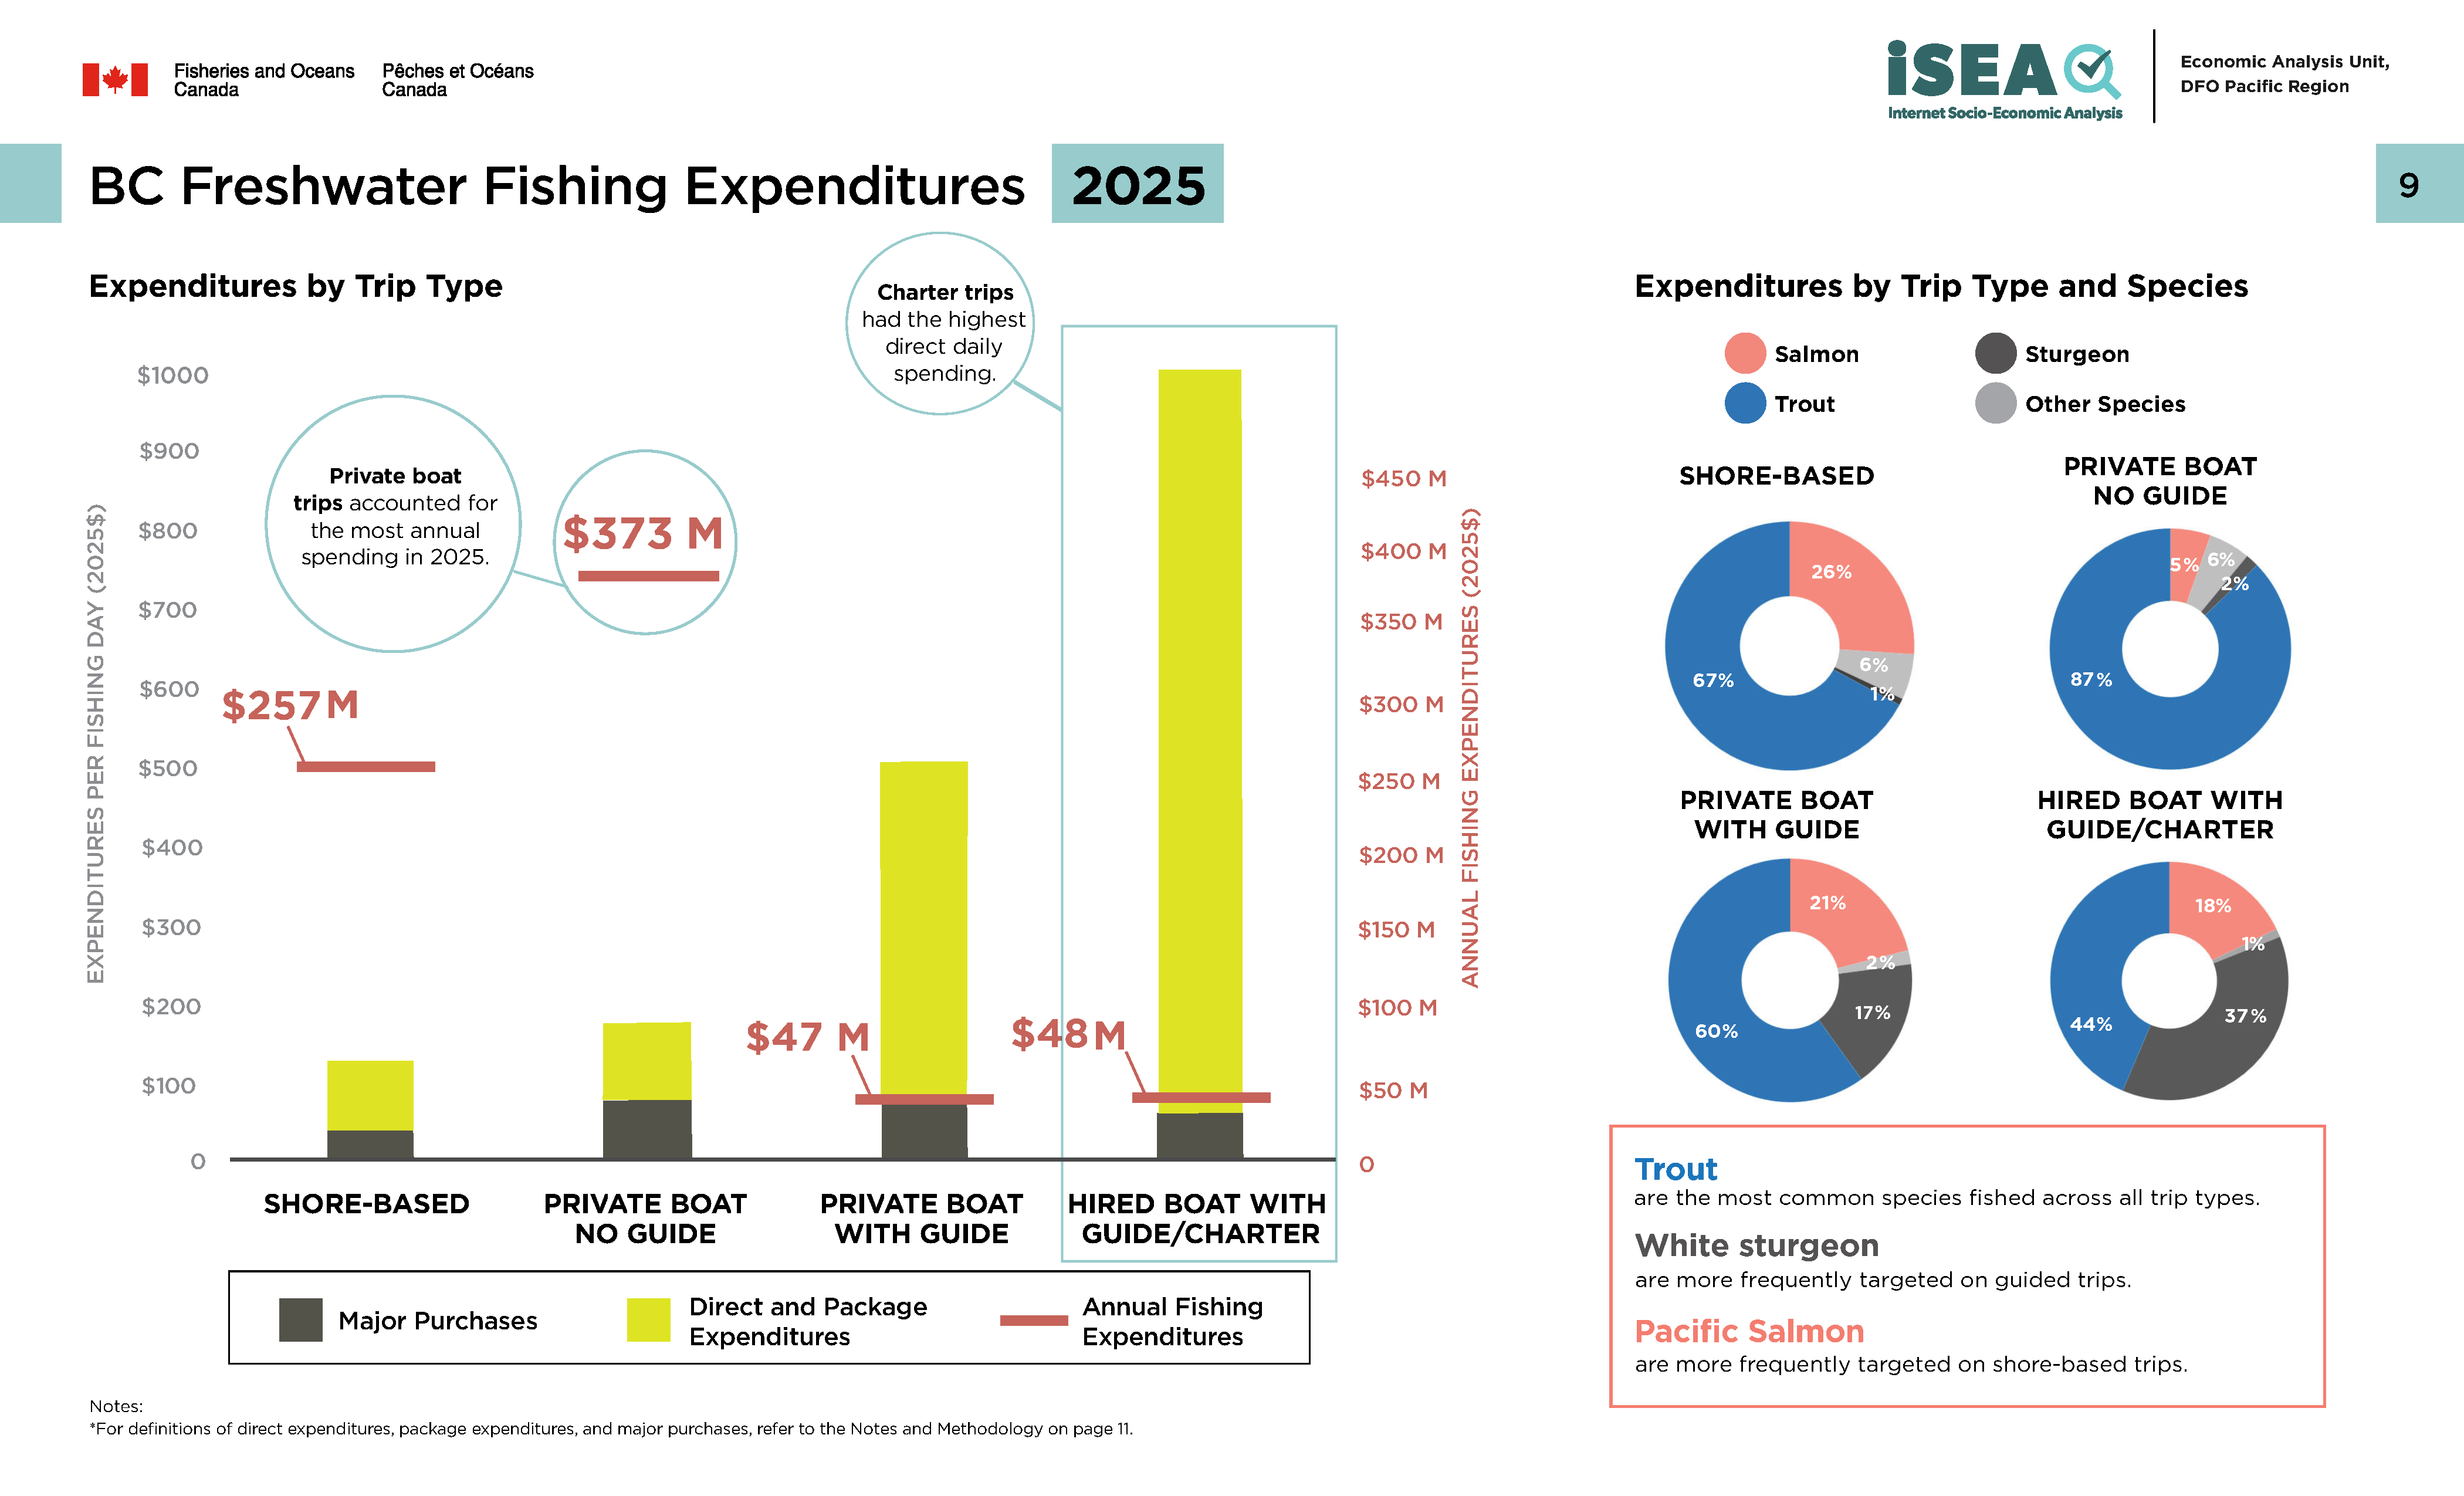
- Fishing expenditures vary by trip type and target species
- In terms of expenditures, in 2025, shore-based trips had the lowest daily expenditures at $138, but accounted for $257 million in total annual spending
- Private boat trips without a guide had the second lowest daily expenditures at $173, but accounted for the highest annual total fishing expenditures at $373 million
- Private boat trips with a guide had the second highest daily expenditures on major purchases and the second highest daily expenditures overall at $493. However, annual total fishing expenditures were the lowest among trip types at $47 million
- Hired boat trips with a guide or charter had the highest overall daily expenditures at $1,018, and annual total fishing expenditures of $48 million. The majority of daily spending on charter trips came from direct and package expenditures, at around $955 per day
- Across all trip types, the majority of spending is attributable to trout fishing
- White Sturgeon are more frequently targeted on guided fishing trips, with 37% of spending on charter trips being attributable to White Sturgeon fishing
- Salmon are most commonly targeted on shore-based fishing trips, with 26% of spending on shore-based trips being attributable to salmon fishing
Trip expenditures by trip type
Shore-based trips
- Major purchases per day: $52
- Direct and package expenditures per day: $86
- Total annual fishing expenditures: $257 million
Private boat trips (without guide)
- Major purchases per day: $78
- Direct and package expenditures per day: $95
- Total annual fishing expenditures: $373 million
Private boat trips (with guide)
- Major purchases per day: $75
- Direct and package expenditures per day: $418
- Total annual fishing expenditures: $47 million
Hired boat trips with guide/charter
- Major purchases per day: $64
- Direct and package expenditures per day: $955
- Total annual fishing expenditures: $48 million
Species expenditures by trip type
(Values reflect the 2025-26 fishing year and dollar amounts are in 2025 dollars.)
Shore-based trips
- Freshwater Salmon: $67 million
- Other species: $15 million
- Sturgeon: $2 million
- Trout: $172 million
Private boat trips (without guide)
- Freshwater Salmon: $20 million
- Other species: $21 million
- Sturgeon: $7 million
- Trout: $325 million
Private boat trips (with guide)
- Freshwater Salmon: $10 million
- Other species: $1 million
- Sturgeon: $8 million
- Trout: $28 million
Hired boat trips with guide/charter
- Freshwater Salmon: $9 million
- Other species: $1 million
- Sturgeon: $18 million
- Trout: $21 million
BC freshwater fishing package deals, 2025
Long text version
Key takeaways
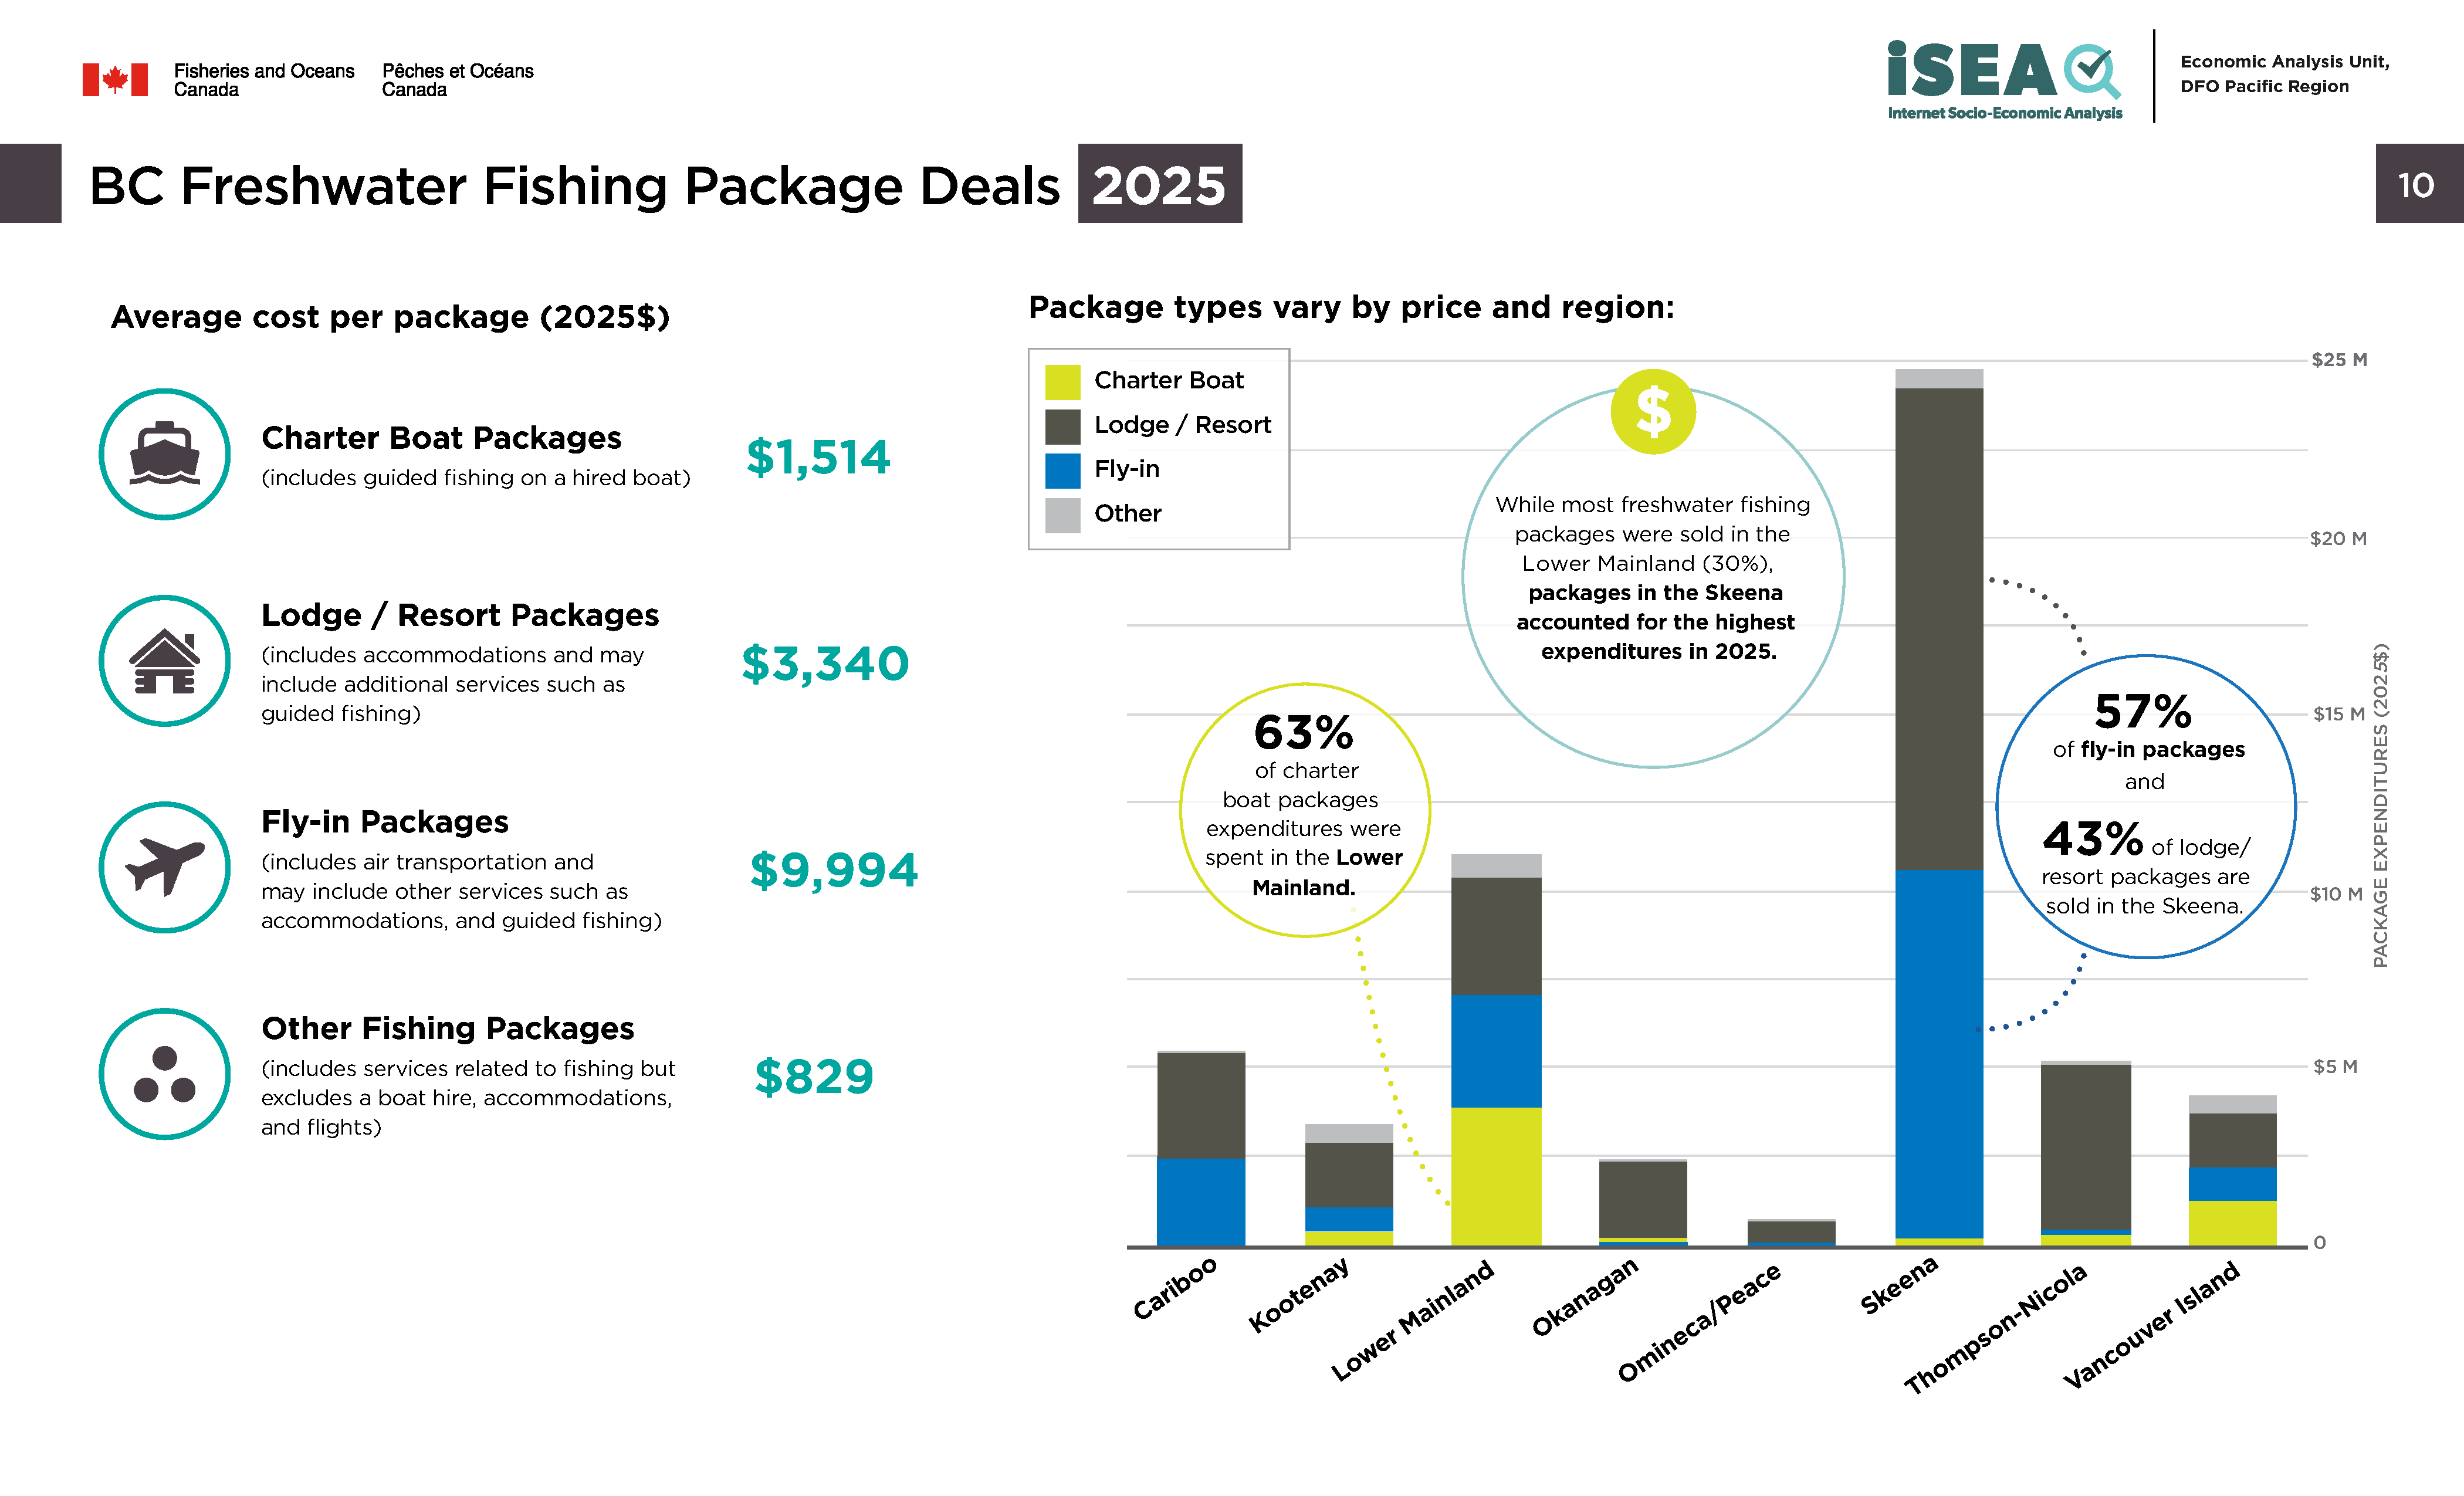
- In 2025, the average cost for a fishing package varied based on the services included
- Charter Boat Packages, which include guided fishing on a hired boat, were priced on average at $1,514
- Lodge/Resort Packages, which include accommodations and may also include additional services like guided fishing, cost more at an average of $3,340
- Fly-in Packages, which include air transportation and may also encompass other services such as accommodations and guided fishing, were the most expensive package type, with an average cost of $9,994
- Other Fishing Packages, which include services related to fishing but exclude a boat hire, accommodations, and flights, were the least expensive, with an average cost of $829
In 2025, package types and expenditures varied by region:
- The most freshwater fishing packages were sold in the Lower Mainland region (30%), followed by the Thompson-Nicola region (22%) and Skeena region (17%)
- Packages in the Skeena accounted for the highest expenditures in 2025
- 57% of fly-in packages and 43% of lodge/resort packages were sold in the Skeena region in 2025
- The most Charter Boat package expenditures (63%) were spent in the Lower Mainland
Package expenditures by region and package type
(Values reflect the 2025-26 fishing year and dollar amounts are in 2025 dollars.)
Cariboo
- Total package expenditures: $5,777,000
- Share of regional expenditures: 8%
- Charter Boat: $19,000
- Fly-in: $2,640,000
- Lodge/Resort: $3,038,000
- Other packages: $80,000
Kootenay
- Total package expenditures: $3,709,000
- Share of regional expenditures: 10%
- Charter Boat: $325,000
- Fly-in: $707,000
- Lodge/Resort: $1,988,000
- Other packages: $689,000
Lower Mainland
- Total package expenditures: $11,685,000
- Share of regional expenditures: 30%
- Charter Boat: $3,625,000
- Fly-in: $3,538,000
- Lodge/Resort: $3,640,000
- Other packages: $883,000
Okanagan
- Total package expenditures: $2,258,000
- Share of regional expenditures: 6%
- Charter Boat: $65,000
- Fly-in: $86,000
- Lodge/Resort: $2,054,000
- Other packages: $54,000
Omineca and Peace
- Total package expenditures: $884,000
- Share of regional expenditures: 2%
- Lodge/Resort: $693,000
- Other packages: $191,000
Skeena
- Total package expenditures: $24,593,000
- Share of regional expenditures: 17%
- Charter Boat: $117,000
- Fly-in: $10,588,000
- Lodge/Resort: $13,236,000
- Other packages: $653,000
Thompson-Nicola
- Total package expenditures: $5,315,000
- Share of regional expenditures: 22%
- Charter Boat: $235,000
- Fly-in: $171,000
- Lodge/Resort: $4,800,000
- Other packages: $5,000
Vancouver Island
- Total package expenditures: $4,000,000
- Share of regional expenditures: 6%
- Charter Boat: $1,359,000
- Fly-in: $884,000
- Lodge/Resort: $1,277,000
- Other packages: $484,000
Notes and methodology
Concepts, terms and definitions
- Active fisher
- An individual who fished in the corresponding fishing season.
- Fishing day
- A day or part of a day on which an individual fished for recreation.
- Direct expenditures
- Expenditures on goods and services (food, camping, accommodation, transportation, supplies, etc.) incurred during fishing trips or excursions.
- Major purchases
- The purchase of durable goods and investments in support of recreational fishing activities. These include boats, motors, special vehicles, camping gear and other durable goods, as well as land and building purchases. Respondents reported the total purchase price as well as the percentage which the respondent felt was directly attributable to recreational fishing. In this report, only purchases attributable to recreational fishing are presented.
- Package expenditures
- Monies paid to a lodge or outfitter for a complete range of services such as lodging, food, transportation, use of fishing equipment, etc. Four types of packages were defined for the purposes of this survey:
- Charter boat package: a package which includes fishing in a boat and may include other goods or services such as a guide, food, or fishing supplies, but excludes accommodation and airfare
- Lodge package: a package which includes accommodation and may include other goods or services such as a guided charter, food, or fishing supplies, but excludes airfare
- Fly-in package: a package which includes airfare and may include other goods or services such as accommodations, a guided charter, food, or fishing supplies
- Other: a package which does not include fishing in a boat, accommodations, or airfare, but may include other goods or services such as a guide, food, or fishing supplies
- Total economic impact
- The total impact of the industry on the economy. This is the sum of the direct, indirect and induced economic impacts.
- Direct economic impact
- Measures the actual expenditures made by establishments operating in the sector.
- Indirect economic impact
- Measures the economic activity of industries supplying goods and services used by sector operators. This is also referred to as “supplier industry impact”.
- Induced economic impact
- Measures the impact on the economy of spending by workers employed as a result of the sector’s activity.
- GDP
- The annual contribution of the recreational fishing sector to BC provincial gross domestic product. This includes the direct, indirect and induced economic contribution.
- Household income
- The total/aggregated annual contribution of the recreational fishing sector to household income. This includes the direct, indirect and induced economic contribution.
- Employment
- The total annual number of jobs (FTEs) in BC which are sustained by the recreational fishing sector. This includes direct, indirect and induced jobs.
- Percent change
- Calculated as 𝑟 = ((𝑝𝑛 − 𝑝0)/𝑝0) ∗ 100 where 𝑟 is average annual percent change, 𝑝𝑛 and 𝑝0 are the final and initial observations in the period, respectively.
- Recreational fishing
- Refers to non-commercial fishing; recreational angling and sport fishing are covered in the definition used by the survey. Note that food, social and ceremonial fishing is not covered by the survey and is therefore not included in any of the estimates presented in this report.
- Residency
- The place in which the license holder permanently resided within the survey year.
- BC resident
- An individual who lived within British Columbia during the survey year.
- Other Canadian: an individual who lived within Canada, but outside British Columbia during the survey year
- International fisher: an individual who lived outside of Canada during the survey year
- Visitor: an individual whose primary residence is outside of BC (includes Other Canadian and International fishers)
- Trip type
- Respondents distributed their days fished across four types of fishing days. This considers all fishing days and is separate from package types which are specific to package expenditures.
Data description
The primary data source used for this report was the Internet Socioeconomic Analysis (iSEA) Survey of Freshwater Recreational Fishing in British Columbia, 2025. This survey was administered by DFO Pacific and collected socioeconomic information on freshwater recreational fishing activity in British Columbia (BC) throughout the 2025 fishing season (from April 2025 to March 2026). The survey questions were organized into two sections: fishing effort (days) and fishing expenditures. A random sample of 100,000 individuals who purchased a freshwater fishing licence in the 2025 season were selected to complete the survey. In total, 18,306 individuals completed the survey in full, which represents 5% of the freshwater fishing population.
This survey was similarly administered in the 2024 fishing season. The data from this iteration was also used in generating some of the statistics presented in this report. The 2024 survey achieved an effective sample rate of 5%.
In addition to the iSEA survey, the figures presented in this report were supplemented using data from the Survey of Recreational Fishing in Canada. This survey was historically run by DFO every 5 years up until 2015 and collected socioeconomic information on all fishing activity (tidal and freshwater) across Canada. In contrast to iSEA, this survey was run based on the calendar year rather than the fishing season. Information from the 2000, 2005, 2010 and 2015 iterations were used for generating reported recreational fishing statistics for BC prior to 2022. More information on this survey is available from DFO’s national website.
Note that survey results presented in this report have been weighted in order to scale results to the licence population level. Additionally, many survey results presented in this report are transformed data. Fields such as fishing days and expenditures were calculated by distributing reported values across species, spatial and trip categories.
Additional notes on methodology
- Unless otherwise specified, all dollar metrics presented in this report are in 2025$
- Throughout this report, fishing expenditures refers to the sum of direct expenditures, major purchases and package expenditures reported in the corresponding survey year
- On page 1 of this report, GDP, household income and employment statistics were calculated using multipliers from British Columbia’s Fisheries and Aquaculture Sector Report, developed by BC Stats. These statistics represent outcomes from the total economic impact of BC’s freshwater recreational fishing sector, which includes the direct, indirect and induced impacts. For more information, the report is available on the Government of British Columbia’s website
Page details
- Date modified: