
DFO marine finfish aquaculture audit activities in British Columbia
DFO conducts regular audits of marine finish aquaculture facilities in BC to ensure compliance with conditions of licence and to monitor environmental performance.
The protection and conservation of wild fish is a priority and DFO is committed to ensuring that Canada’s aquaculture regulations support the health of marine ecosystems and the aquatic species they support.
A complete overview of the marine finfish aquaculture industry’s performance in meeting requirements under the Pacific Aquaculture Regulations and the Aquaculture Activities Regulations is available in the report, Regulating and monitoring British Columbia’s marine finfish aquaculture facilities.
Fish health audits
Fish health audits
This graph summarizes the veterinary diagnoses resulting from DFO fish health audits performed at marine finfish aquaculture facilities in British Columbia. Each quarter, DFO biologists audit approximately 30 randomly selected facilities based on species grown and location. Some facilities may be randomly selected in multiple quarters. During fish health audits, DFO staff sample farmed fish for diseases and pathogens of concern and check compliance with health management plans and licence conditions.
Diagnostic services are provided by an accredited animal health laboratory. Results of polymerase chain reaction (PCR) screening, bacterial culture and histopathology are analyzed by DFO veterinarians to provide a farm-level diagnosis for each audit. In some cases, more than one non-infectious environmental or bacterial disease may be identified during an audit.
- Non-infectious environmental disease
- These are low-impact diseases that farmed fish can contract from their environment including, but not limited to, environmental toxins, fungal infections and poor gill health associated with environmental stressors. These conditions often resolve on their own and veterinary intervention is uncommon.
- Bacterial disease
- A large majority of fish health events are the result of easily treatable diseases caused by naturally occurring bacteria. Approximately two thirds of these events are due to mouth rot, a disease commonly found in cultured Atlantic salmon, usually soon after they enter seawater. Research on the cause of mouth rot is ongoing, as is development of a vaccine. Mouth rot rarely occurs in Pacific salmon. Other diseases caused by naturally occurring bacteria that affect Atlantic salmon farms are Renibacterium salmoninarum causing Bacterial Kidney Disease (BKD), and Piscirickettsia salmonis causing Salmonid Rickettsial Septicemia (SRS).
- Reportable disease
- Certain diseases that are of significant importance to aquatic animal health or to the Canadian economy are closely monitored and managed by the Canadian Food Inspection Agency (CFIA). Aquaculture companies are required by law to report to the CFIA if they suspect the presence of a reportable disease. CFIA will then initiate an investigation and will dictate how to manage the disease (e.g. testing, quarantine, eradication or containment). A list of these diseases can be found on the CFIA website.
- Undiagnosed
- In some cases it may not be possible to assign a farm-level diagnosis. For example, if mortalities are too low and a sufficient number of samples are not available for analysis, or if mortalities are elevated but laboratory results do not confirm a common disease-related cause of mortality.
Detailed results of each fish health audit can be found in the report, Results of DFO fish health audits of British Columbian marine finfish aquaculture sites, by facility.

Graph: DFO fish health audits at British Columbia marine finfish aquaculture sites, 2011 to 2020
Long text version
| No significant disease(s) identified | Undiagnosed | Non-infectious environmental or bacterial disease(s) identified | Reportable disease | Number of active facilities | Number of Audits | |
|---|---|---|---|---|---|---|
| 2011 | 44 | 7 | 14 | 0 | 94 | 65 |
| 2012 | 90 | 12 | 15 | 0 | 84 | 117 |
| 2013 | 82 | 12 | 25 | 0 | 77 | 119 |
| 2014 | 90 | 7 | 14 | 0 | 82 | 111 |
| 2015 | 83 | 8 | 29 | 0 | 84 | 120 |
| 2016 | 75 | 17 | 25 | 0 | 81 | 117 |
| 2017 | 92 | 9 | 19 | 0 | 81 | 120 |
| 2018 | 78 | 6 | 36 | 0 | 80 | 120 |
| 2019 | 103 | 3 | 18 | 0 | 83 | 124 |
| 2020 | 71 | 4 | 17 | 0 | 77 | 92 |
Sea lice audits
Sea lice audits
This graph shows the outcomes of Fisheries and Oceans Canada (DFO) audits of industry sea lice counting methodology at marine finfish aquaculture facilities in BC. DFO’s conditions of licence for marine finfish aquaculture contain sea lice monitoring, reporting and sampling requirements to determine sea lice abundance on farms. DFO audits industry’s sampling methodology and counting sensitivity to ensure that industry-reported counts are reliable and accurate.
The various licence conditions around sea lice on farmed fish seek to minimize the potential exposure of wild and farmed fish to sea lice from farms. DFO biologists and veterinarians conduct regular assessments throughout the year to verify the accuracy of licence holders’ procedures and reporting.
DFO’s random quarterly sea lice audits coincide with one of the licence holder's numerous scheduled counts. During an audit, farm staff count lice on half of the sampled fish and DFO staff count lice on the other half. In 2020 and 2021, due increased safety protocols in response to the Covid-19 pandemic, side by side counts were not completed. Audit counts were completed only by DFO and these results were assessed against industry reporting and record keeping to determine compliance.
A statistical comparison is performed to determine the level of agreement between DFO counts and industry counts. If there is agreement between the counts, and DFO staff observed counting methodology that meets requirements outlined in licence conditions, then the licence holder is in compliance. If DFO staff observed counting methodologies that do not meet requirements outlined in licence conditions and/or there is not agreement between the counts, then follow-up actions may be required.
In some cases, where there is not statistical agreement between counts but DFO staff observed counting methodology that meets requirements outlined in licence conditions, it is assumed that the difference in counts can be attributed to sample selection, or chance, and no compliance follow-up actions are required.
Detailed information on specific sea lice audits can be found in the report, DFO sea lice audits of BC marine finfish aquaculture sites.

Graph: DFO sea lice audits of British Columbia marine finfish aquaculture sites, 2011 to 2025
Long text version
| Year | Statistical agreement | Statistical difference, methodology meets requirements | Statistical difference, follow-up action taken | Statistical comparison not possible (Covid-19) |
|---|---|---|---|---|
| 2011 | 34 | 1 | 0 | NA |
| 2012 | 39 | 2 | 0 | NA |
| 2013 | 37 | 0 | 1 | NA |
| 2014 | 32 | 3 | 0 | NA |
| 2015 | 39 | 3 | 4 | NA |
| 2016 | 37 | 3 | 1 | NA |
| 2017 | 39 | 2 | 5 | NA |
| 2018 | 42 | 7 | 0 | NA |
| 2019 | 47 | 4 | 0 | NA |
| 2020 | 7 | 3 | 0 | 18 |
| 2021 | 0 | 0 | 0 | 50 |
| 2022 | 26 | 2 | 1 | 11 |
| 2023 | 26 | 2 | 0 | 0 |
| 2024 | 24 | 6 | 0 | 0 |
| 2025 | 34 | 2 | 0 | 0 |
Benthic audits
Benthic audits
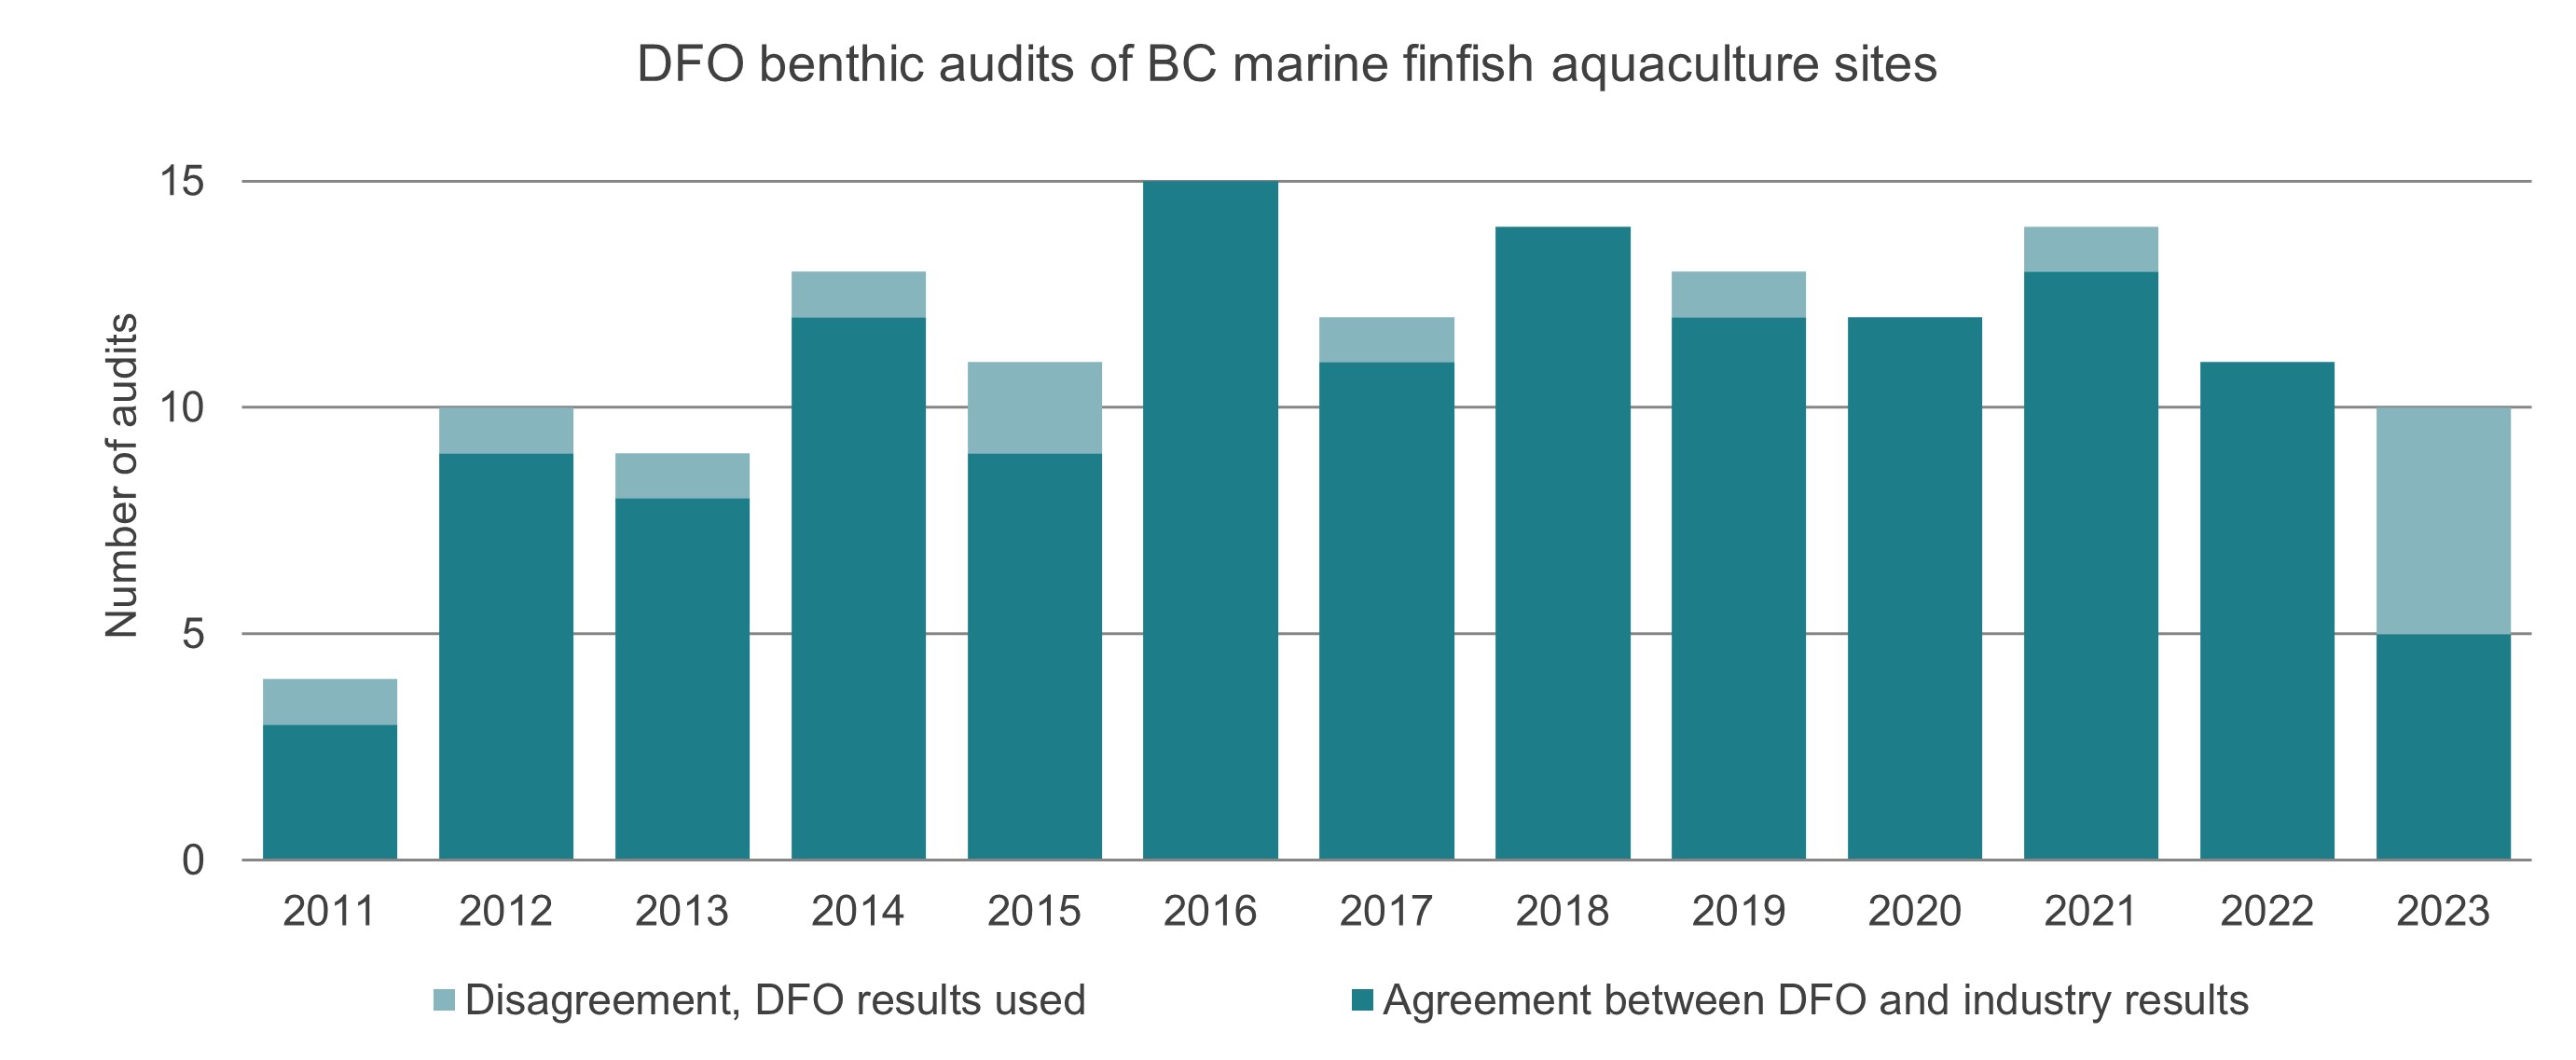
This graph shows the results of benthic audits that are conducted at marine finfish aquaculture sites in British Columbia. To ensure that acceptable levels of environmental impact are not exceeded, monitoring of the sea floor is conducted during peak production, when the level of impact is expected to be highest.
Industry conducts benthic surveys and submits results to the Department. DFO biologists audit a portion of these facilities and compare the results to industry-submitted data. If there is disagreement between DFO and industry results, then DFO results are used and additional industry monitoring may be required. To better understand seasonal and long- term trends, DFO also conducts information-gathering surveys throughout the production cycle and at times when industry is not required to monitor.
Detailed information on specific benthic audits and industry surveys can be found in the reports, Results of industry benthic monitoring of British Columbia marine finfish aquaculture sites and Results of DFO benthic audits of British Columbia marine finfish aquaculture sites.
Graph: DFO benthic audits of British Columbia marine finfish aquaculture sites, 2011 to 2025
Long text version
| Year | Agreement between DFO and industry results | Disagreement, DFO results used |
|---|---|---|
| 2011 | 3 | 1 |
| 2012 | 9 | 1 |
| 2013 | 8 | 1 |
| 2014 | 12 | 1 |
| 2015 | 9 | 2 |
| 2016 | 15 | 0 |
| 2017 | 11 | 1 |
| 2018 | 14 | 0 |
| 2019 | 12 | 1 |
| 2020 | 12 | 0 |
| 2021 | 13 | 1 |
| 2022 | 11 | 0 |
| 2023 | 5 | 5 |
| 2024 | 9 | 1 |
| 2025 | 9 | 2 |
Related links
- Sea lice mitigation events graph
- Average number of lice per fish on BC salmon farms
- DFO sea lice audits of BC marine finfish aquaculture sites
- Industry sea lice counts at BC marine finfish aquaculture sites
- Sea lice mitigation events at BC marine finfish aquaculture sites
- Date modified: