
2023 Economic Profile of all BC Recreational Fisheries
This profile provides an overview of the economic contributions of British Columbia’s Tidal and Freshwater recreational fisheries.
Long text version
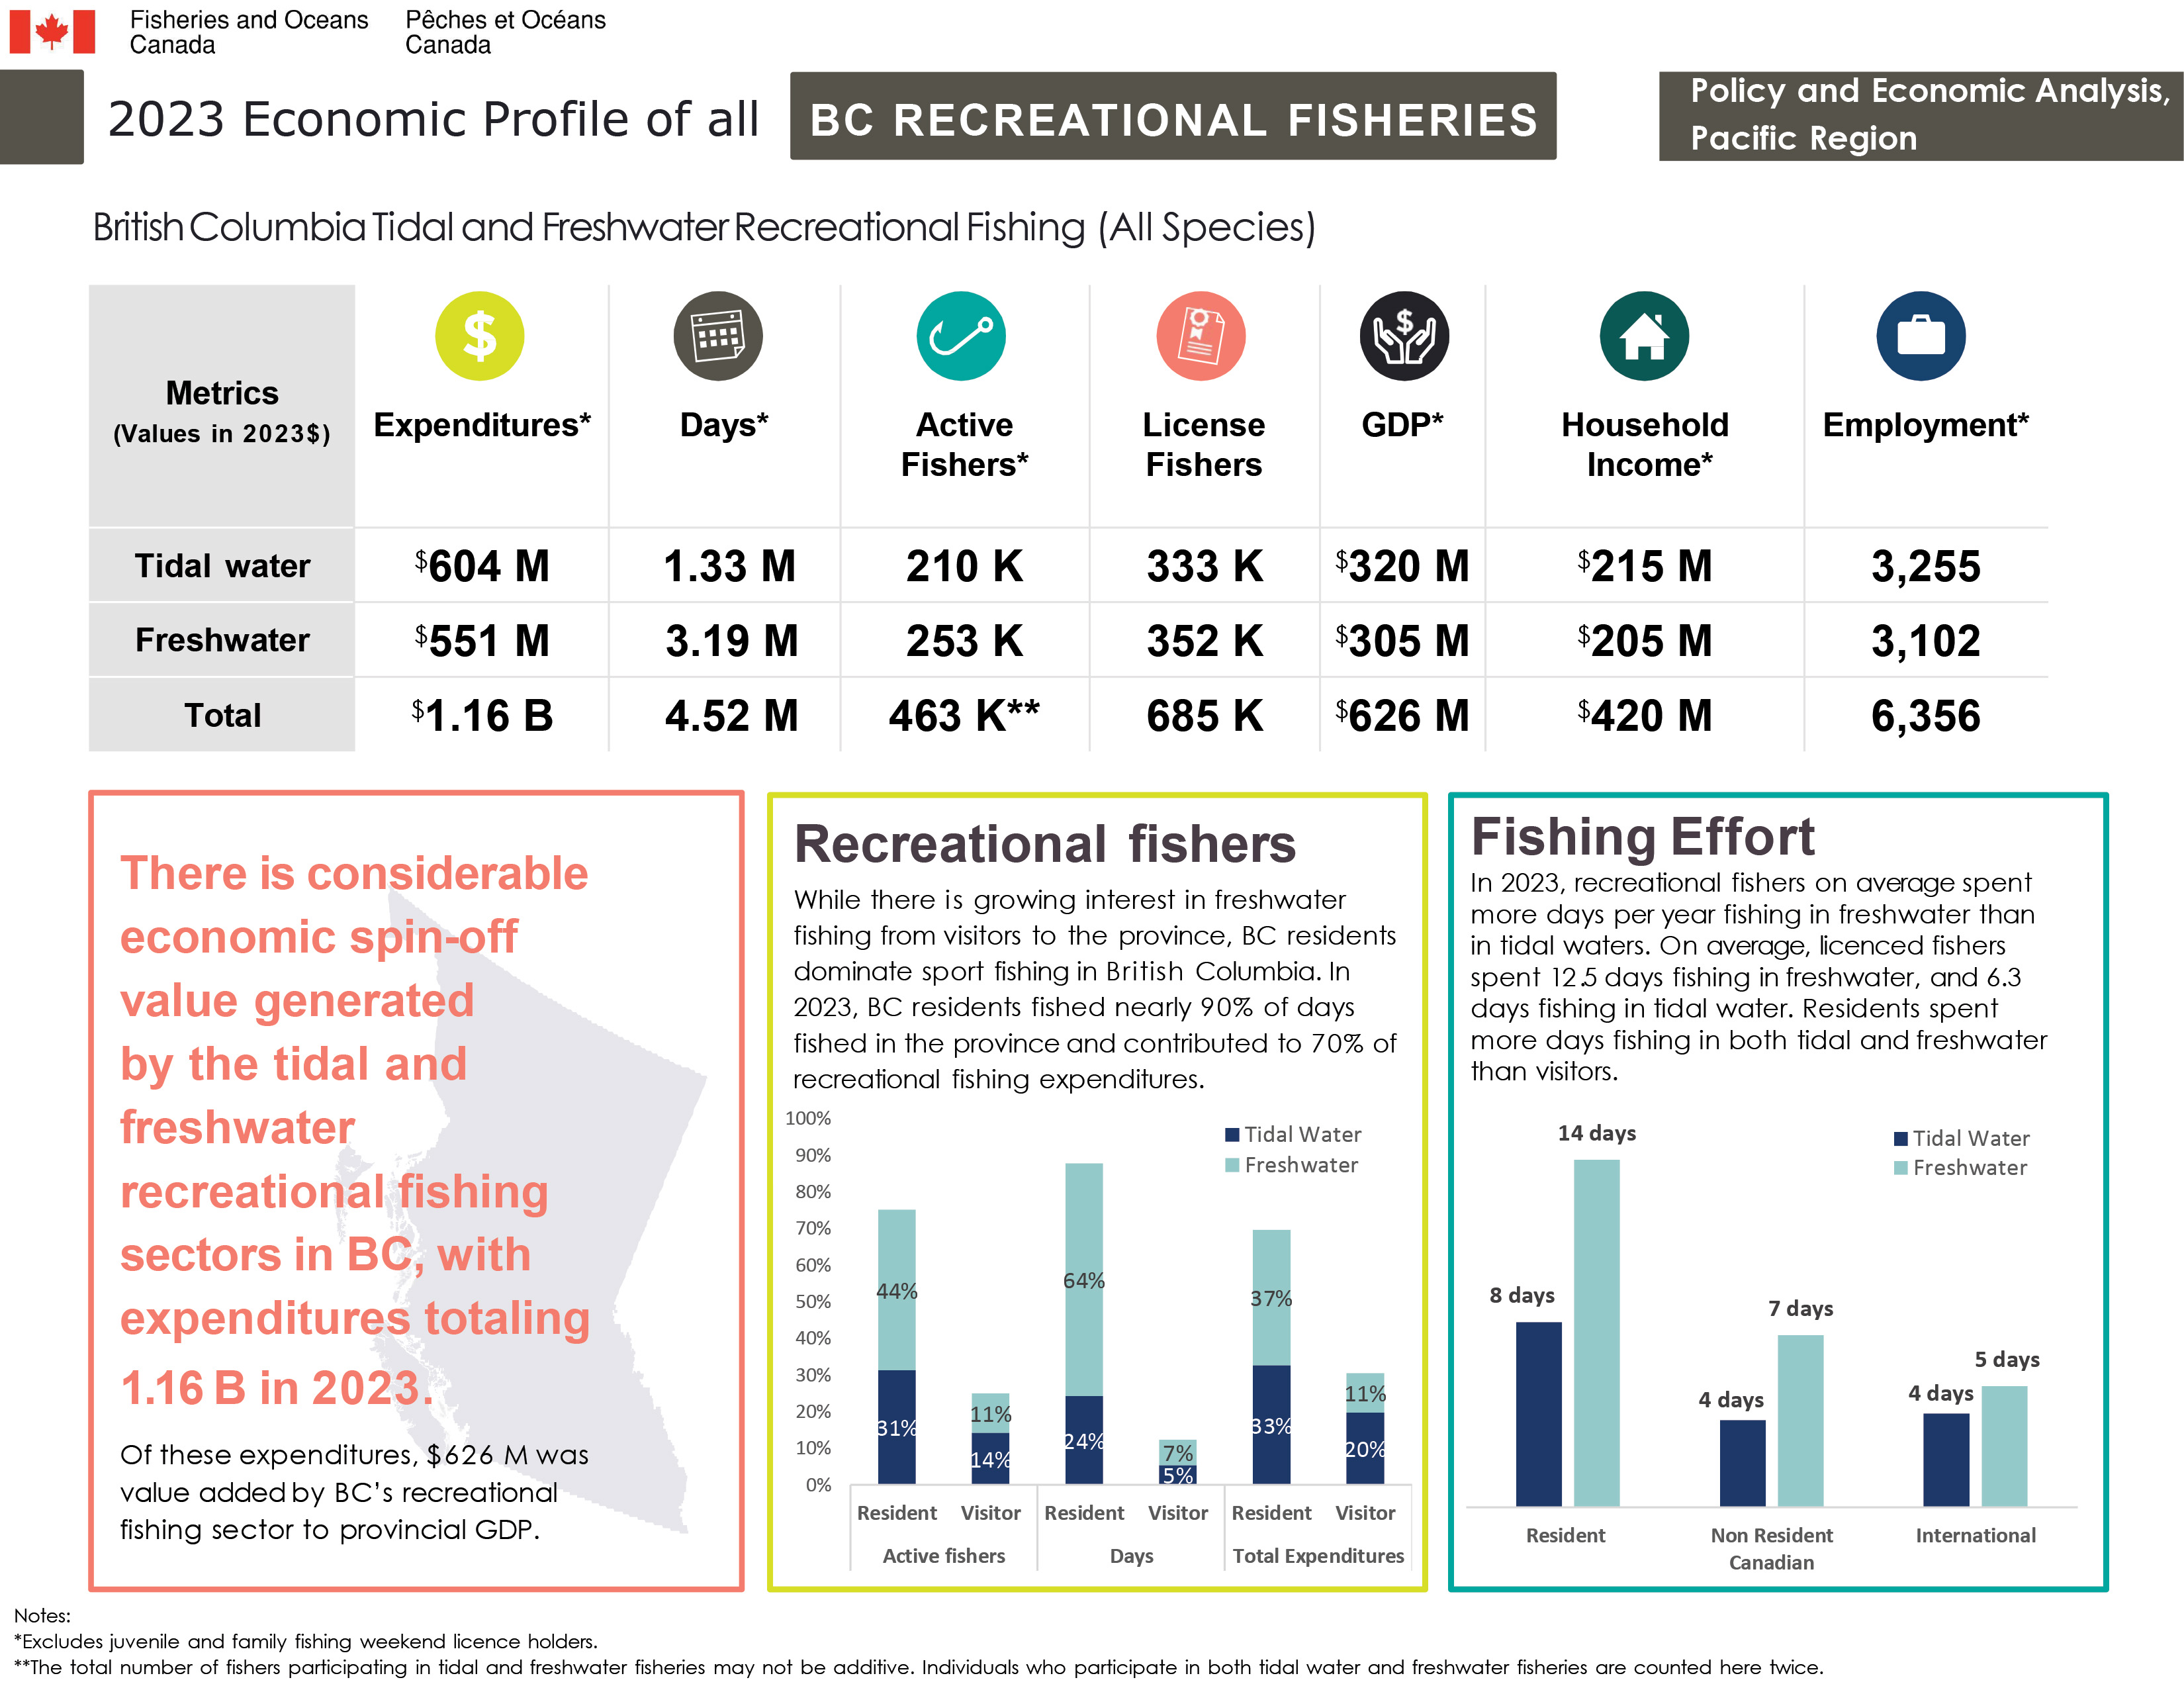
British Columbia Tidal and Freshwater Recreational Fishing (All Species)
Key metrics for Tidal and Freshwater Recreational Fishing Industry. Metrics exclude Juvenile and Family Fishing Weekend licence holders. All values represent the 2023 fishing year and are in 2023 dollars.
Expenditures*
- Tidal water - $604M
- Freshwater - $551M
- Total - $1.16B
Days*
- Tidal water - 1.33M
- Freshwater – 3.19M
- Total – 4.52M
Active Fishers*
- Tidal water – 210K
- Freshwater – 253K
- Total – 463K**
License Fishers
- Tidal water – 333K
- Freshwater – 352K
- Total – 685K
GDP*
- Tidal water - $320M
- Freshwater - $305M
- Total - $626M
Household Income*
- Tidal water - $215M
- Freshwater - $205M
- Total - $420M
Employment*
- Tidal water – 3,255
- Freshwater – 3,102
- Total – 6,356
There is considerable economic spin-off value generated by the tidal and freshwater recreational fishing sectors in BC, with expenditures totaling 1.16 B in 2023. Of these expenditures, $626 M was value added by BC’s recreational fishing sector to provincial GDP.
Recreational fishers
While there is growing interest in freshwater fishing from visitors to the province, BC residents dominate sport fishing in British Columbia. In 2023, BC residents fished nearly 90% of days fished in the province and contributed to 70% of recreational fishing expenditures.
Recreational Fishing Chart:
Active:
- Resident (44% Freshwater, 31% Tidal Water)
- Visitor (11 Freshwater, 14% Tidal Water)
Days:
- Resident (64% Freshwater, 24% Tidal Water)
- Visitor (7% Freshwater, 5% Tidal Water)
Total Expenditures:
- Resident (37 Freshwater, 33% Tidal Water)
- Visitor (11% Freshwater, 20% Tidal Water)
Fishing Effort
In 2023, recreational fishers on average spent more days per year fishing in freshwater than in tidal waters. On average, licenced fishers spent 12.5 days fishing in freshwater, and 6.3 days fishing in tidal water. Residents spent more days fishing in both tidal and freshwater than visitors.
Fishing Effort Chart:
- Resident: (14 days Freshwater, 8 days Tidal water)
- Non-Resident Canadian: (7 days Freshwater, 4 days Tidal water)
- International: (5 days Freshwater, 4 days Tidal water)
Footnotes:
- *Excludes juvenile and family fishing weekend licence holders.
- **The total number of fishers participating in tidal and freshwater fisheries may not be additive. Individuals who participate in both tidal water and freshwater fisheries are counted here twice.
Long text version
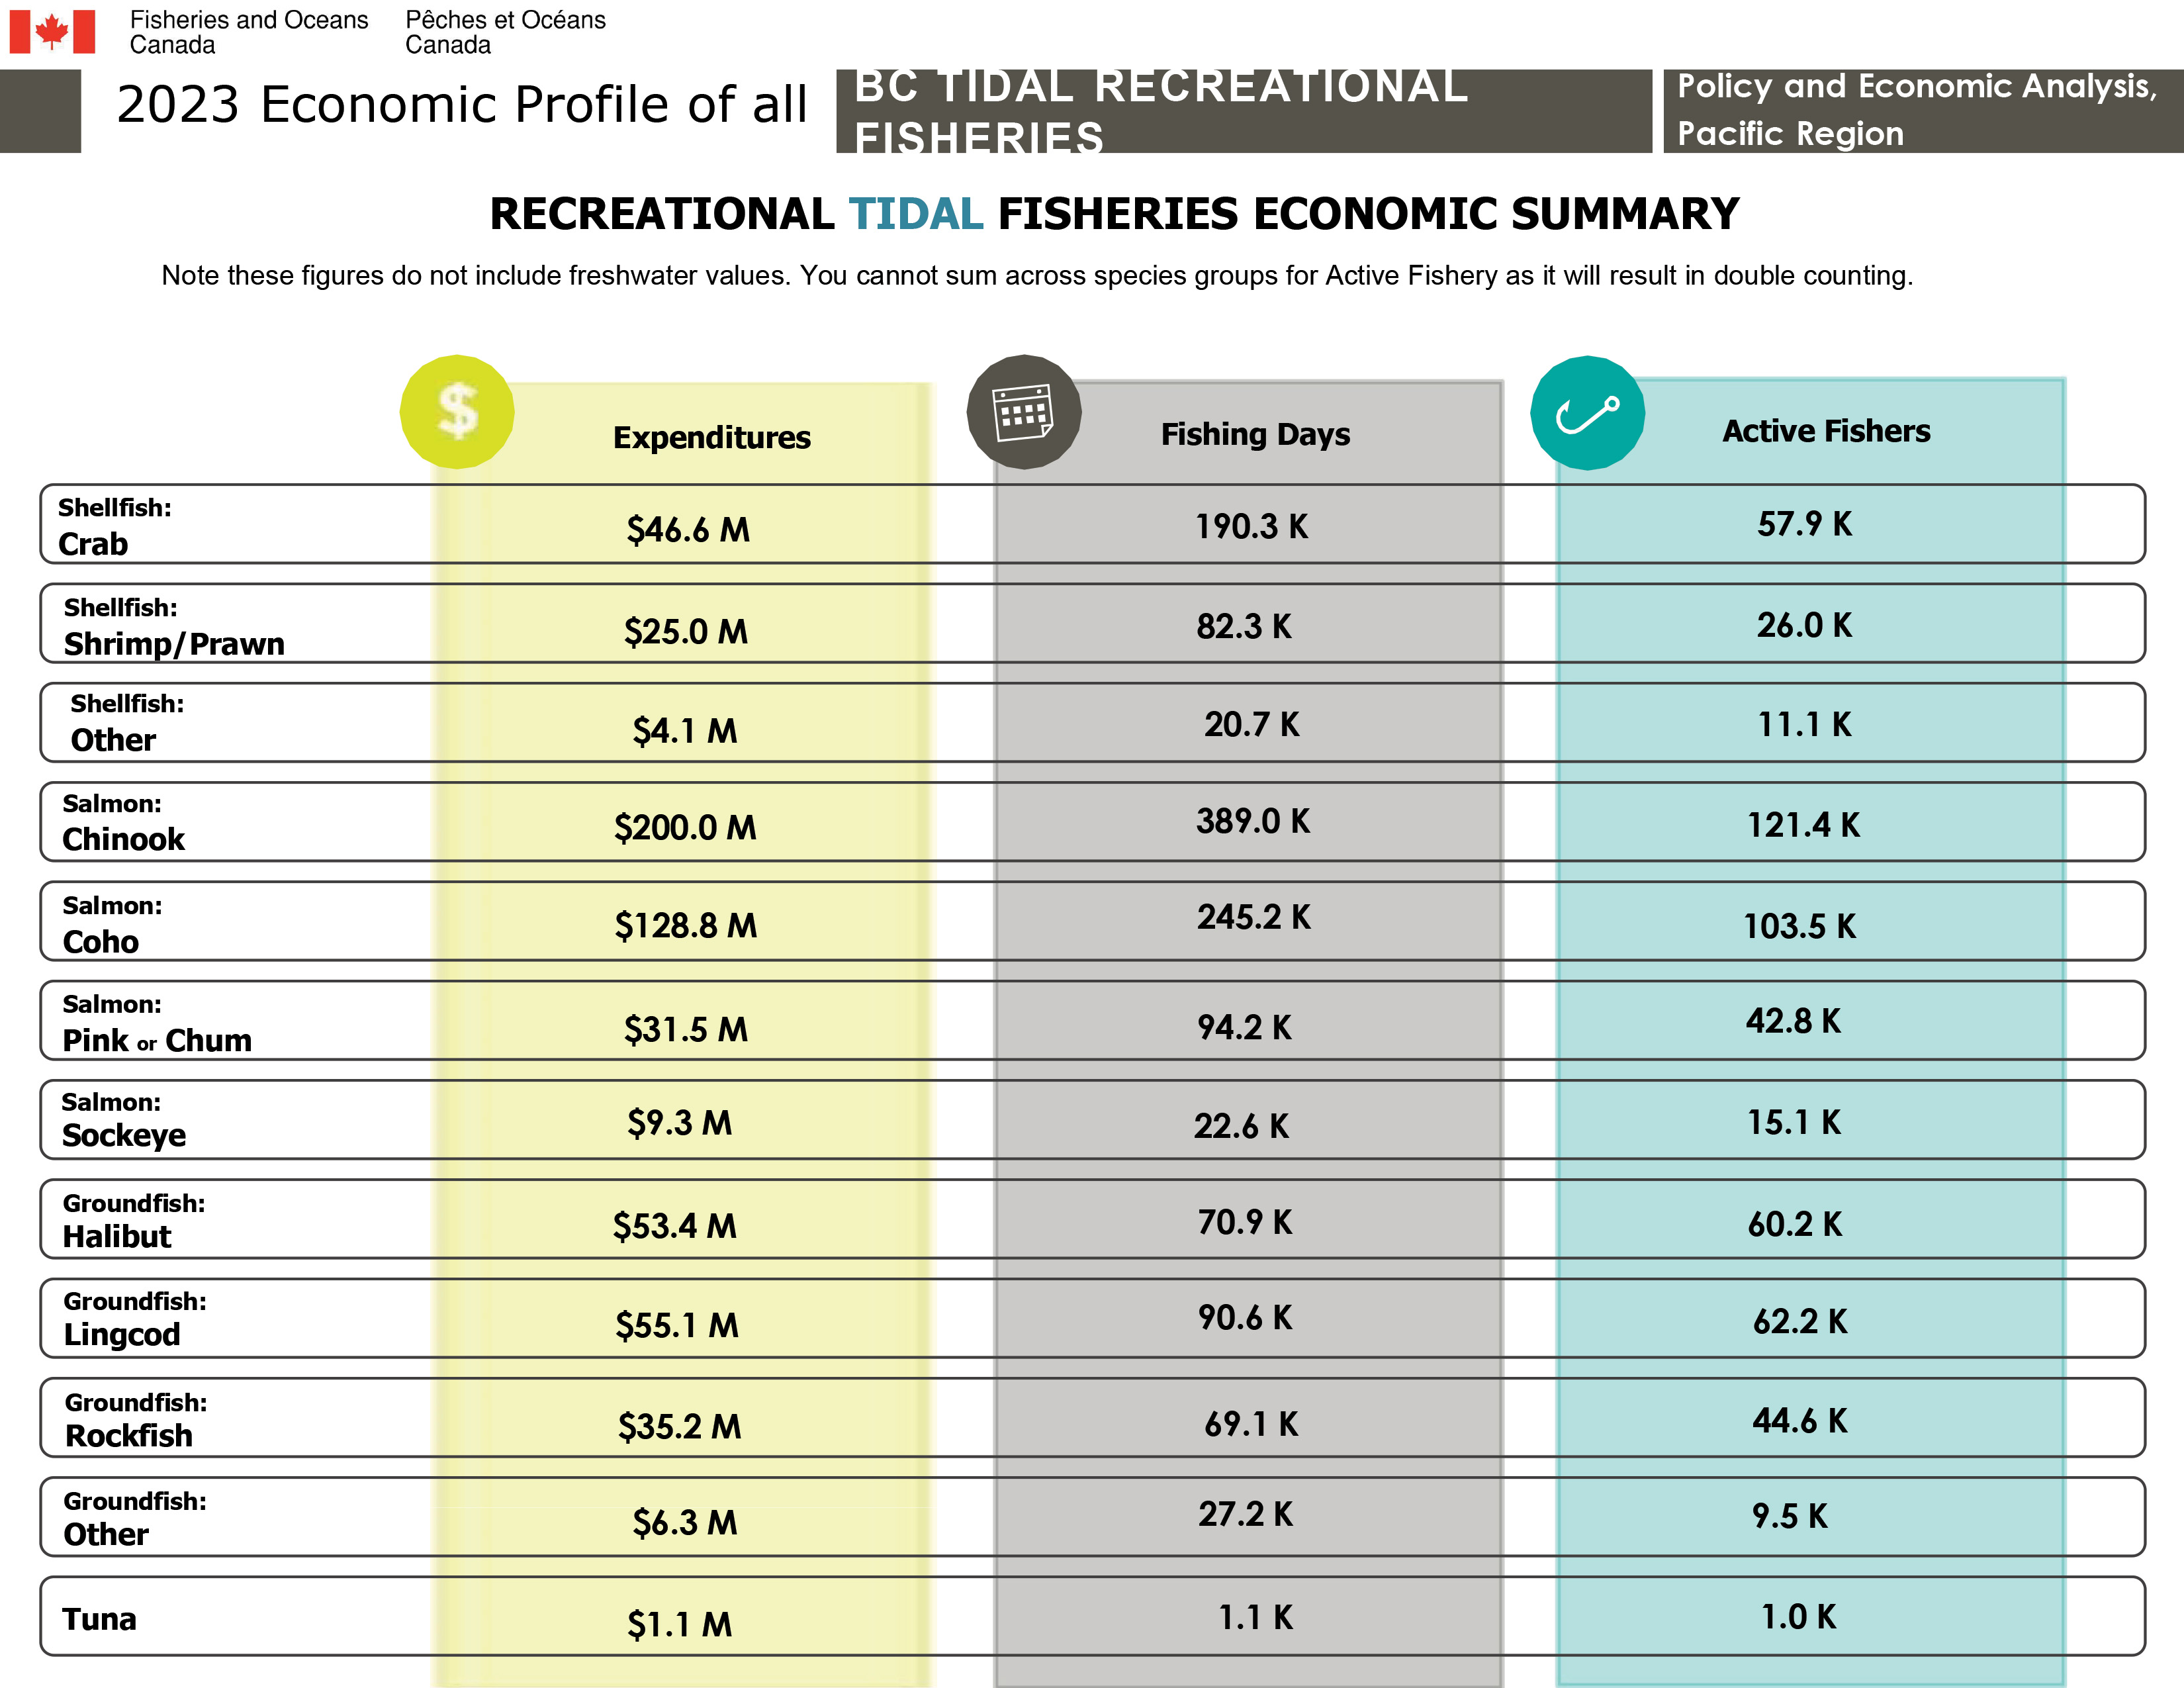
Recreational Tidal Fisheries Economic Summary
Note these figures do not include freshwater values. You cannot sum across species groups for Active Fishery as it will result in double counting.
Shellfish: Crab
- Expenditures: $46.6M
- Fishing Days: 190.3K
- Active Fishers: 57.9K
Shellfish: Shrimp/Prawn
- Expenditures: $25.0M
- Fishing Days: 82.3K
- Active Fishers: 26.0K
Shellfish: Other
- Expenditures: $4.1M
- Fishing Days: 20.7K
- Active Fishers: 11.1K
Salmon: Chinook
- Expenditures: $200.0M
- Fishing Days: 389.0K
- Active Fishers: 121.4K
Salmon: Coho
- Expenditures: $128.8M
- Fishing Days: 245.2K
- Active Fishers: 103.5K
Salmon: Pink or Chum
- Expenditures: $31.5M
- Fishing Days: 94.2K
- Active Fishers: 42.8K
Salmon: Sockeye
- Expenditures: $9.3M
- Fishing Days: 22.6K
- Active Fishers: 15.1K
Groundfish: Halibut
- Expenditures: $53.4M
- Fishing Days: 70.9K
- Active Fishers: 60.2K
Groundfish: Lingcod
- Expenditures: $55.1M
- Fishing Days: 90.6K
- Active Fishers: 60.2K
Groundfish: Rockfish
- Expenditures: $35.2M
- Fishing Days: 69.1K
- Active Fishers: 44.6K
Groundfish: Other
- Expenditures: $6.3M
- Fishing Days: 27.2K
- Active Fishers: 9.5K
Tuna
- Expenditures: $1.1M
- Fishing Days: 1.1K
- Active Fishers: 1.0K
- Date modified: