
Clam fishery
The following profile provides the socioeconomic context of the intertidal clam fishery in British Columbia. It includes an overview of the commercial sector. This overview is based on data collected from DFO commercial harvest logbooks and sale slips, public reports, and DFO surveys on harvest prices.
Long text version
2023 Economic profile of the intertidal clam fishery
Commercial fisheries overview
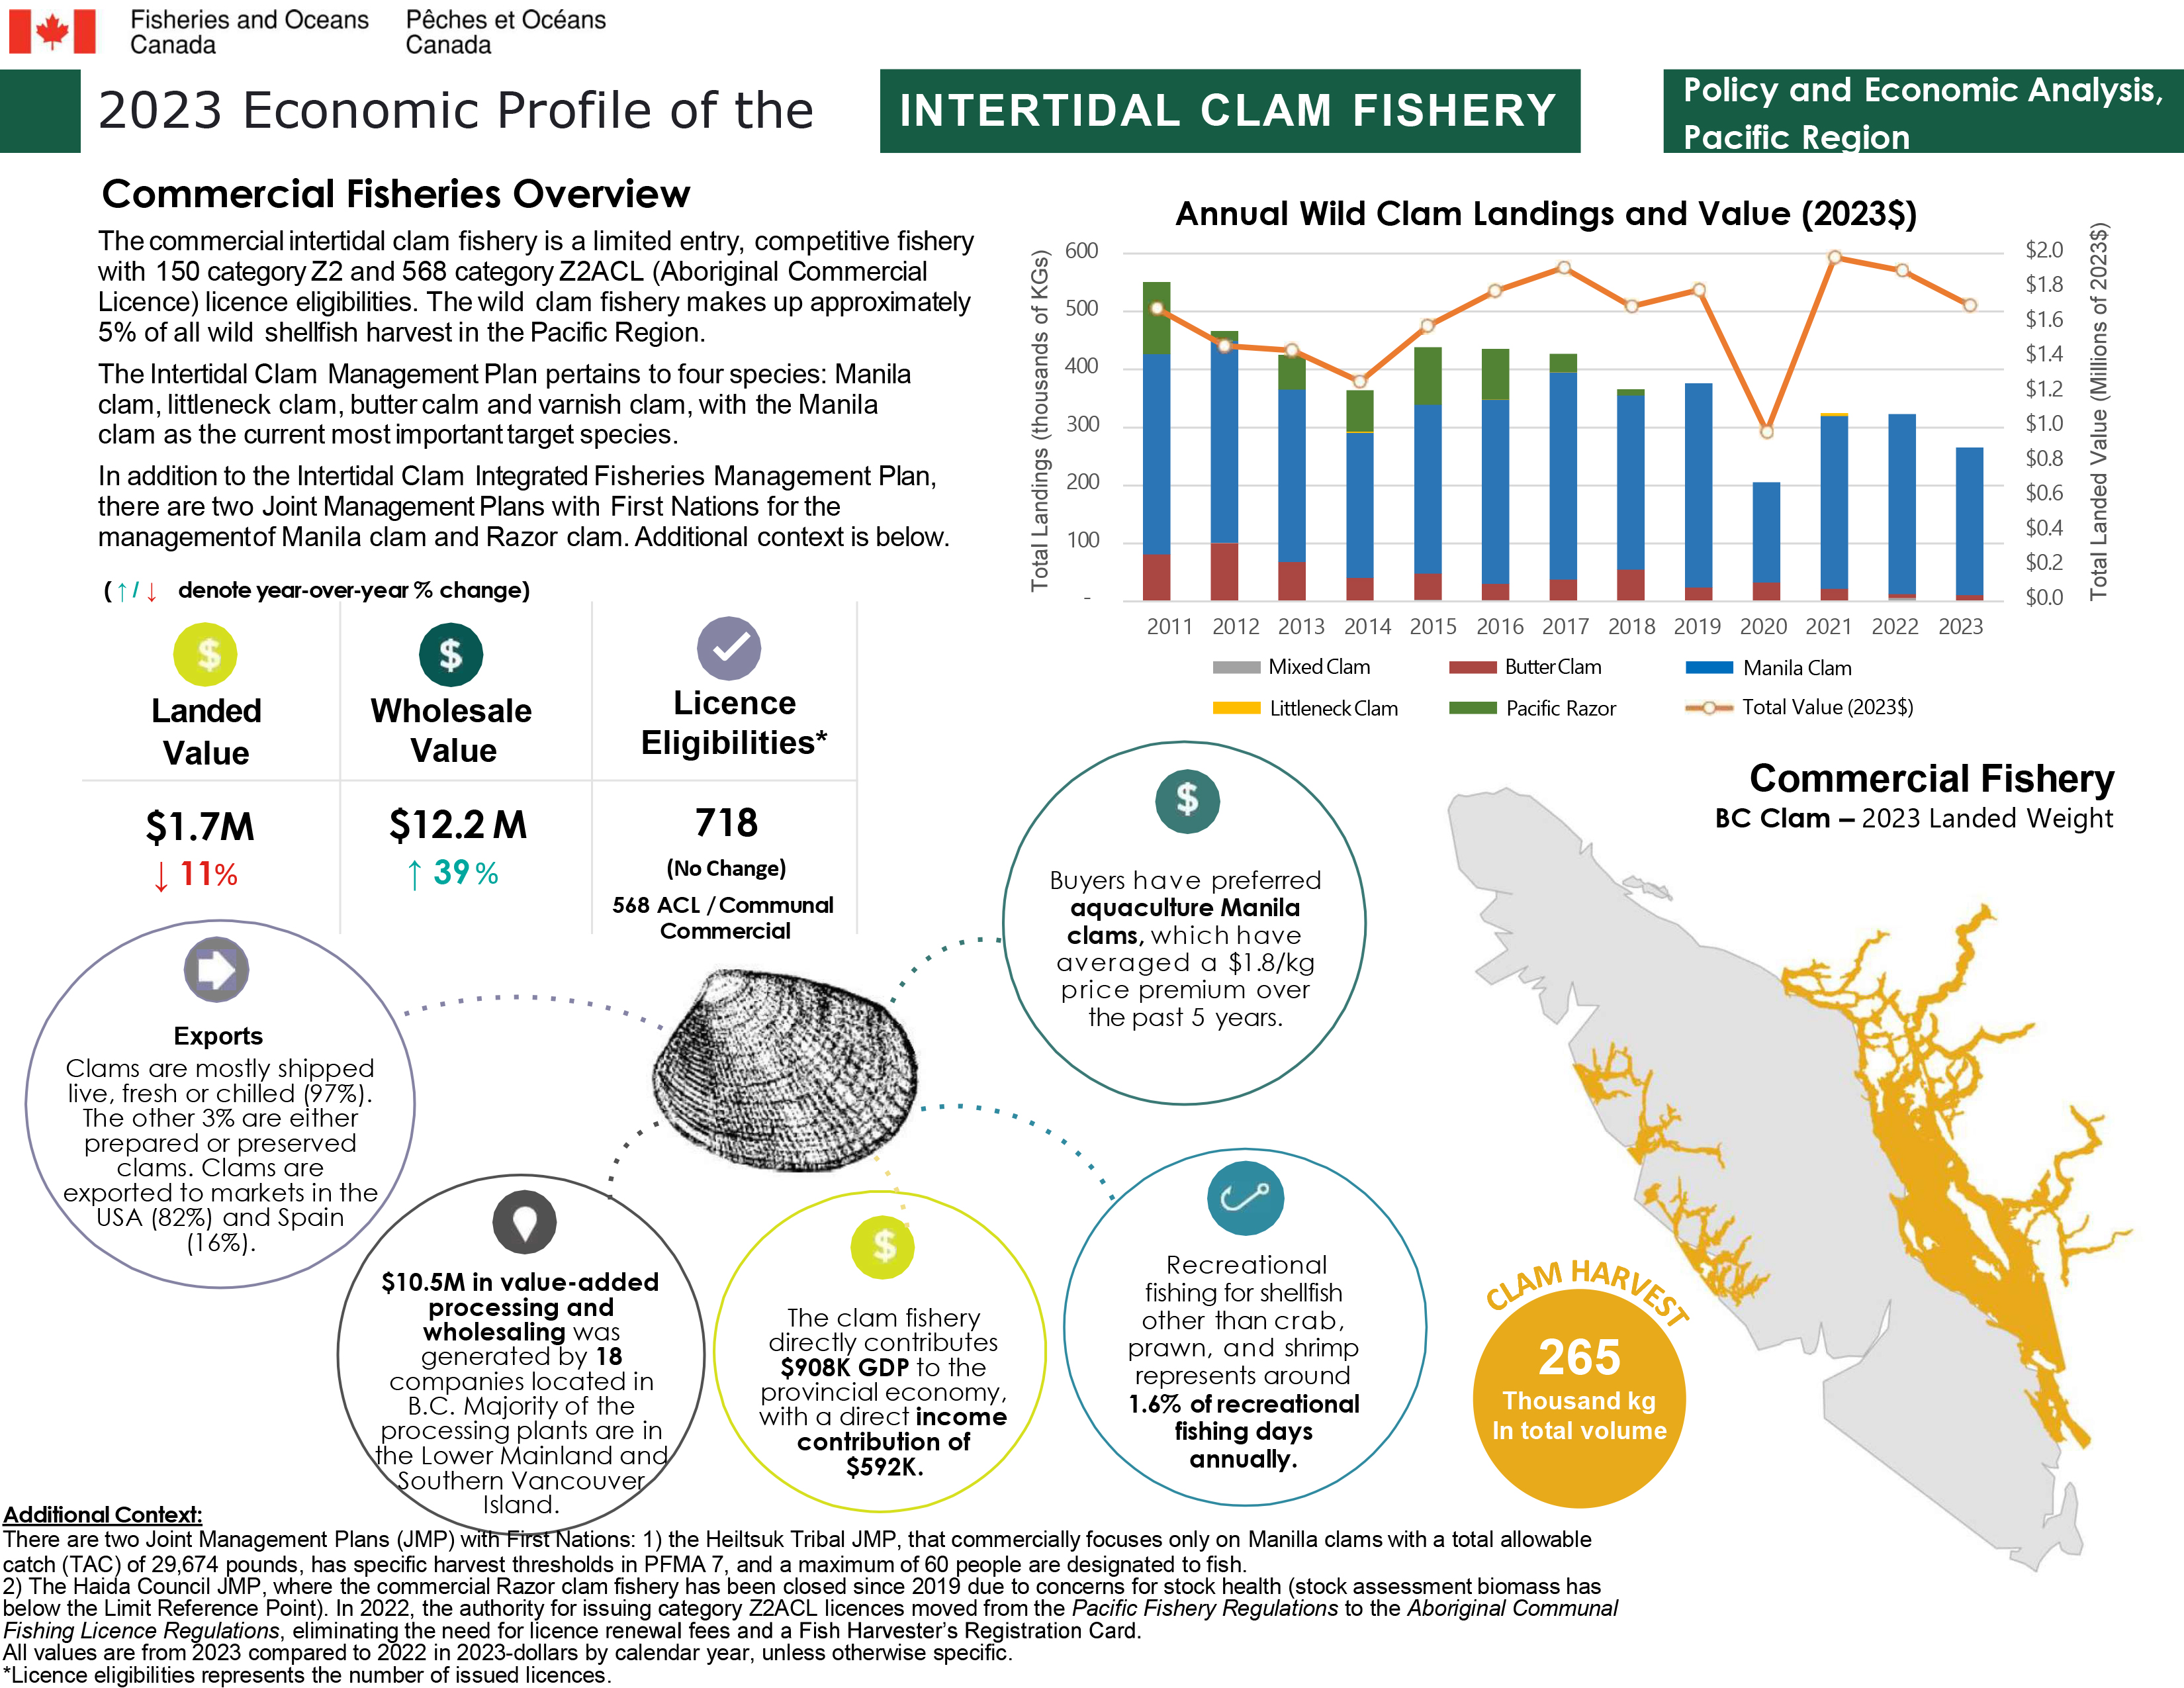
The commercial intertidal clam fishery is a limited entry, competitive fishery with 150 category Z2 and 568 category Z2ACL (Aboriginal Commercial Licence) licence eligibilities. The wild clam fishery makes up approximately 5% of all wild shellfish harvest in the Pacific Region.
The Intertidal Clam Management Plan pertains to four species: Manila clam, littleneck clam, butter clam and varnish clam, with the Manila clam as the current most important target species.
In addition to the Intertidal Clam Integrated Fisheries Management Plan, there are two Joint Management Plans with First Nations for the management of Manila clam and Razor clam. Additional context is provided below.
Key metrics for the intertidal clam fishery, all values are from 2023 and in 2023 dollars:
- Landed value ($1.7M), decreased by 11% since 2022
- Wholesale value ($12.2M), increased by 39% since 2022
- Licence eligibilities (718), with 568 ACL/Communal Commercial licences, no change since 2022
Annual wild clam landings and value chart
Butter clam landed kilograms
- 2011 - 81K kg
- 2012 - 101K kg
- 2013 - 69K kg
- 2014 - 40K kg
- 2015 - 45K kg
- 2016 - 28K kg
- 2017 - 39K kg
- 2018 - 55K kg
- 2019 - 24K kg
- 2020 - 33K kg
- 2021 - 22K kg
- 2022 - 7.1K kg
- 2023 - 11K kg
Manila clam landed kilograms
- 2011 - 345K kg
- 2012 - 348K kg
- 2013 - 297K kg
- 2014 - 250K kg
- 2015 - 290K kg
- 2016 - 317K kg
- 2017 - 357K kg
- 2018 - 299K kg
- 2019 - 351K kg
- 2020 - 172K kg
- 2021 - 298K kg
- 2022 - 309K kg
- 2023 - 254K kg
Littleneck clam landed kilograms
- 2011 – 30 kg
- 2012 – 41 kg
- 2013 – 590 kg
- 2014 - 2,430 kg
- 2015 – 0 kg
- 2016 – 570 kg
- 2017 – 225 kg
- 2018 – 25 kg
- 2019 – 0 kg
- 2020 – 0 kg
- 2021 - 4,750 kg
- 2022 – 0 kg
- 2023 – 0 kg
Pacific razor clam landed kilograms
- 2011 - 125K kg
- 2012 - 17K kg
- 2013 - 59K kg
- 2014 - 71K kg
- 2015 - 99K kg
- 2016 - 87K kg
- 2017 - 31K kg
- 2018 - 11K kg
- 2019 – 0 kg
- 2020 – 0 kg
- 2021 – 0 kg
- 2022 – 0 kg
- 2023 – 0 kg
Mixed clam landed kilograms
- 2011 – 46 kg
- 2012 – 0 kg
- 2013 – 28 kg
- 2014 – 0 kg
- 2015 - 3,160 kg
- 2016 - 2,570 kg
- 2017 – 0 kg
- 2018 – 0 kg
- 2019 – 0 kg
- 2020 – 0 kg
- 2021 – 0 kg
- 2022 - 6,015 kg
- 2023 – 0 kg
Total landed value (2023$)
- 2011 - $1.7M
- 2012 - $1.5M
- 2013 - $1.4M
- 2014 - $1.3M
- 2015 - $1.6M
- 2016 - $1.8M
- 2017 - $1.9M
- 2018 - $1.7M
- 2019 - $1.8M
- 2020 - $0.97M
- 2021 - $1.98M
- 2022 - $1.9M
- 2023 - $1.7M
Commercial fishery BC clam – 2023 landed weight map
- Clam harvest: 265 thousand kilograms in total volume
Exports: Clams are mostly shipped live, fresh or chilled (97%). The other 3% are either prepared or preserved clams. Clams are exported to markets in the USA (82%) and Spain (16%).
$10.5M in value-added processing and wholesaling was generated by 18 companies located in B.C. Majority of the processing plants are in the Lower Mainland and Southern Vancouver Island.
The clam fishery directly contributes $908 K (GDP) to the provincial economy, with a direct income contribution of $592 K.
Buyers have preferred aquaculture Manila clams, which have averaged a $1.8/kg price premium over the past 5 years.
Recreational fishing for shellfish other than crab, prawn, and shrimp represents around 1.6% of recreational fishing days annually.
Footnotes
Additional context:
- There are two Joint Management Plans (JMP) with First Nations: 1) the Heiltsuk Tribal JMP, that commercially focuses only on Manilla clams with a total allowable catch (TAC) of 29,674 pounds, has specific harvest thresholds in PFMA 7, and a maximum of 60 people are designated to fish. 2) The Haida Council JMP, where the commercial Razor clam fishery has been closed since 2019 due to concerns for stock health (stock assessment biomass has below the Limit Reference Point). In 2022, the authority for issuing category Z2ACL licences moved from the Pacific Fishery Regulations to the Aboriginal Communal Fishing Licence Regulations, eliminating the need for licence renewal fees and a Fish Harvester’s Registration Card.
- All values are from 2023 compared to 2022 in 2023-dollars by calendar year, unless otherwise specified.
- Licence eligibilities represents the number of issued licences.
Data
The commercial data that informed this work can be downloaded here.
- Date modified: