
Crab fishery
The following profile provides the socioeconomic context of the crab fishery in British Columbia. It includes an overview of the commercial and recreational sectors. This overview is based on data collected from DFO commercial harvest logbooks and sale slips, public reports, and DFO surveys on harvest prices and recreational fisheries. The commercial harvest data that informed this work can be downloaded here.
Long text version
2023 Economic profile of the crab fishery
Commercial fisheries overview
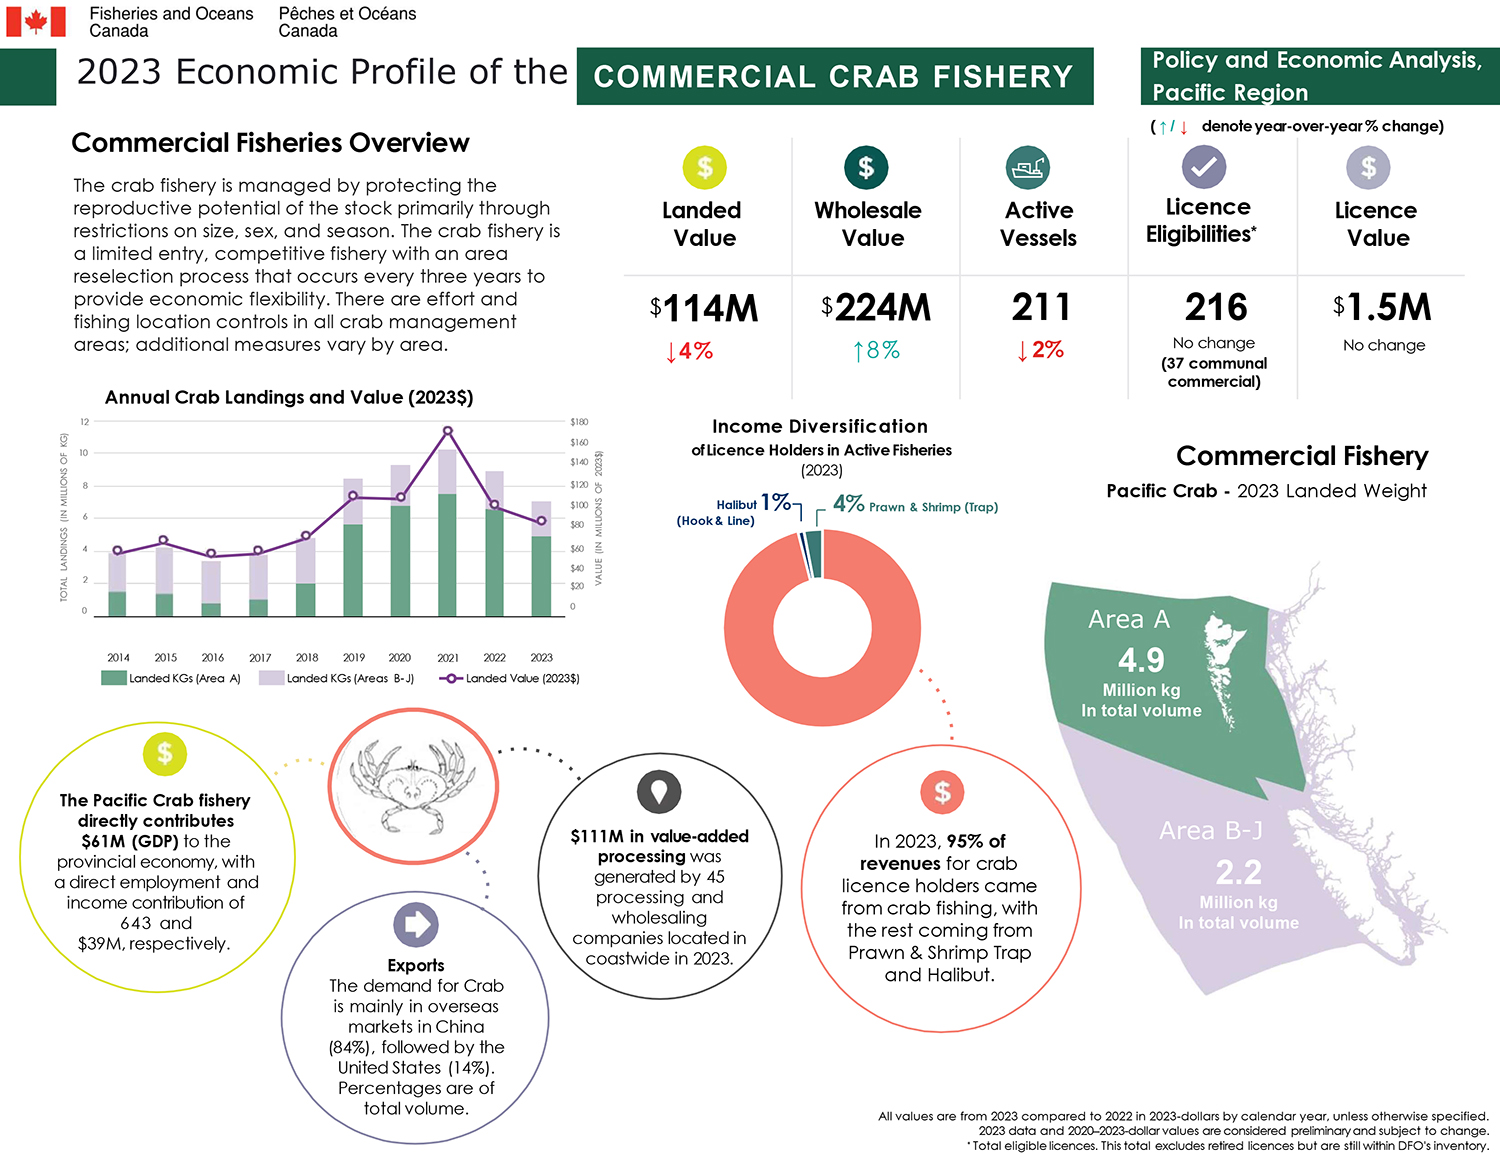
The crab fishery is managed by protecting the reproductive potential of the stock primarily through restrictions on size, sex, and season. The crab fishery is a limited entry, competitive fishery with an area reselection process that occurs every three years to provide economic flexibility. There are effort and fishing location controls in all crab management areas; additional measures vary by area.
Key metrics for the crab fishery, all values are from 2023 and in 2023 dollars:
- Landed value ($114M), decreased by 4% since 2022
- Wholesale value ($224M), increased by 8% since 2022
- Active vessels (211), decreased by 2% since 2022
- Licence Eligibilities (2161), 37 are communal commercial licences. No change since 2022
- Licence value ($1.5M), no change since 2022
Annual wild crab landings and value chart
Area A crab landed kilograms
- 2014 - 1.4M kg
- 2015 - 1.3M kg
- 2016 - 792K kg
- 2017 - 999K kg
- 2018 - 2.0M kg
- 2019 - 5.6M kg
- 2020 - 6.7M kg
- 2021 - 7.5M kg
- 2022 - 6.6M kg
- 2023 - 4.9M kg
Area B-J crab landed kilograms
- 2014 - 2.4M kg
- 2015 - 2.9M kg
- 2016 - 2.6M kg
- 2017 - 2.8M kg
- 2018 - 2.8M kg
- 2019 - 2.8M kg
- 2020 - 2.6M kg
- 2021 - 2.8M kg
- 2022 - 2.3M kg
- 2023 - 2.2M kg
Total landed value (2023$)
- 2014 - $58M
- 2015 - $68M
- 2016 - $55M
- 2017 - $57M
- 2018 - $72M
- 2019 - $109M
- 2020 - $108M
- 2021 - $175M
- 2022 - $118M
- 2023 - $114M
Commercial fishery Pacific crab – 2023 landed weight map
- Area A: 4.9 million kilograms in total volume
- Areas B-J: 2.2 million kilograms in total volume
Income diversification of licence holders in active fisheries (2023) chart
In 2023, 95% of revenues for crab licence holders came from crab fishing, with the rest coming from prawn and shrimp trap (4%), and halibut (1%).
Exports: The demand for crab is mainly in overseas markets in China (84%), followed by the United States (14%). Percentages are of total volume.
$111M in value-added processing was generated by 45 processing and wholesaling companies located coastwide in 2023.
The Pacific crab fishery directly contributes $61M (GDP) to the provincial economy, with a direct employment and income contribution of 643 and $39M, respectively.
Footnotes
- All values are from 2023 compared to 2022 in 2023 dollars by calendar year, unless otherwise specified.
- 2023 data and 2020–2023 dollar values are considered preliminary and subject to change.
- *Total eligible licences. This total excludes retired licences but are still within DFO's inventory.
Long text version
2023 economic profile of the recreational crab fishery
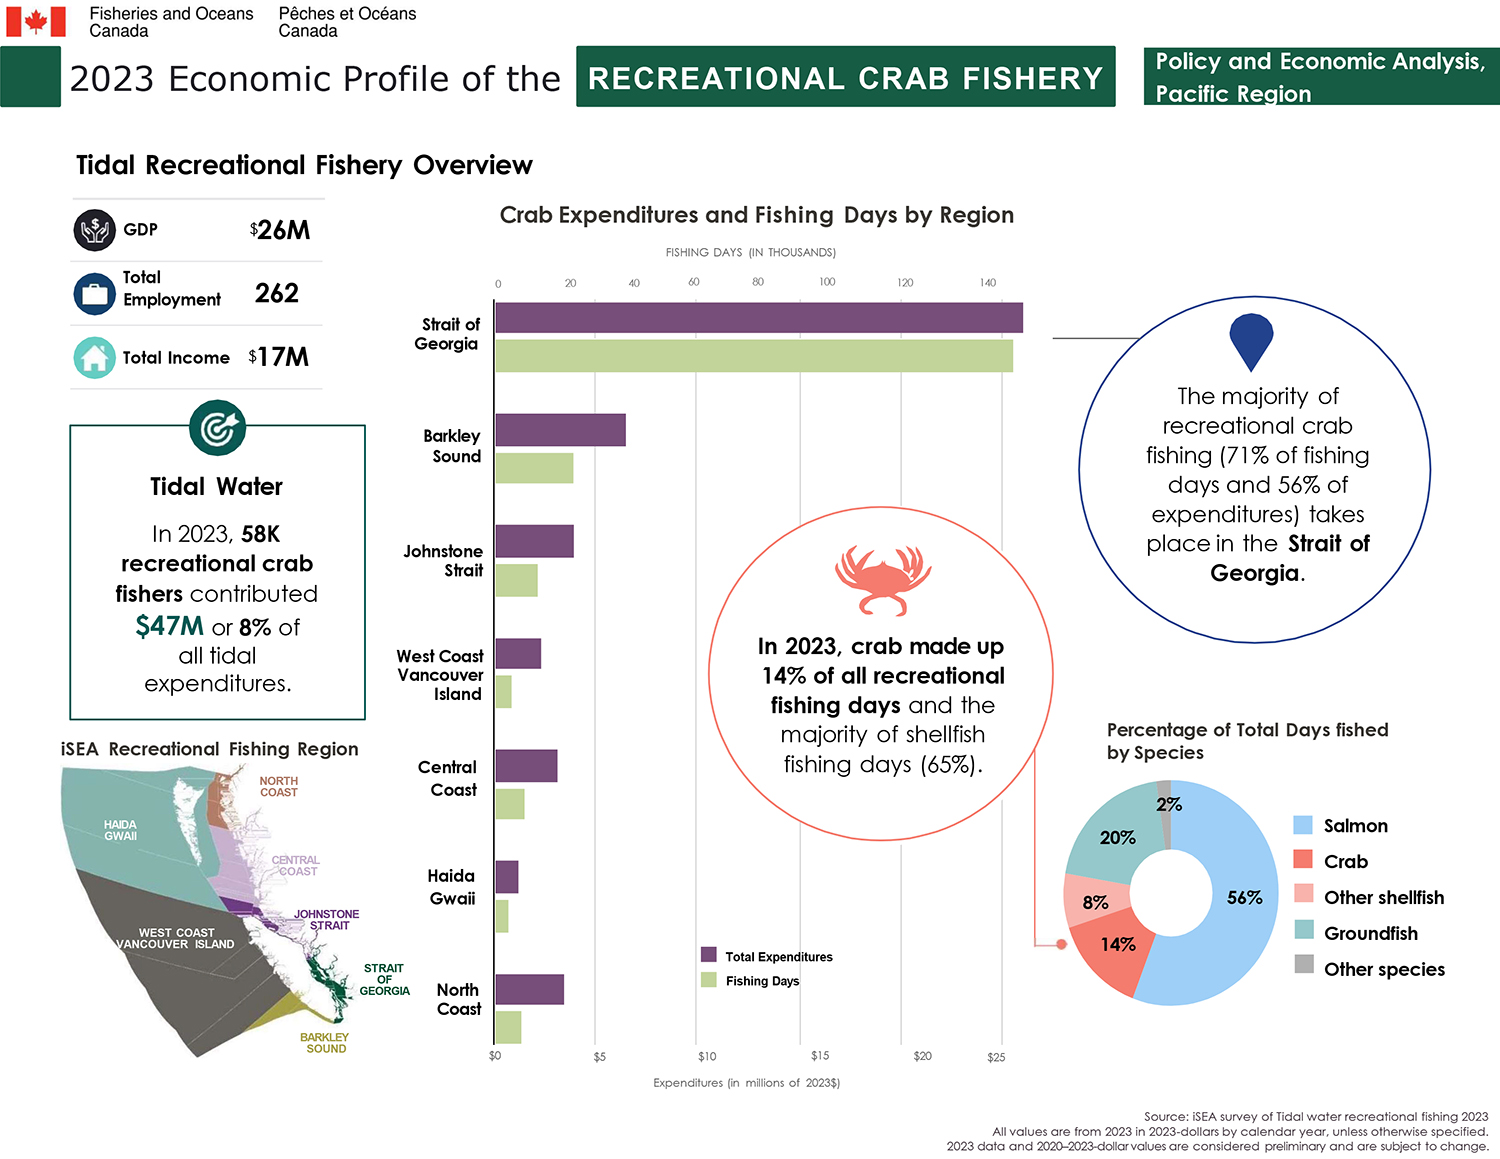
Tidal recreational fishery overview
Key metrics
- GDP ($26M)
- Total employment (262)
- Total income ($17M)
Tidal water
In 2023, 58K recreational crab fishers contributed $47M or 8% of all tidal expenditures.
Crab expenditures and fishing days by region chart
Total expenditures
- Strait of Georgia $26M
- Barkley Sound $6M
- Johnstone Strait $4M
- West Coast Vancouver Island $2M
- Central Coast $3M
- Haida Gwaii $1M
- North Coast $4M
Fishing days
- Strait of Georgia 136,004
- Barkley Sound 20,066
- Johnstone Strait 11,338
- West Coast Vancouver Island 4,498
- Central Coast 7,680
- Haida Gwaii 3,616
- North Coast 7,720
The majority of recreational crab fishing (71% of fishing days and 56% of expenditures) takes place in the Strait of Georgia.
In 2023, crab made up 14% of all recreational fishing days and the majority of shellfish fishing days (65%).
Percentage of total days fished by species chart
- Salmon (56%)
- Crab (14%)
- Other shellfish (8%)
- Groundfish (20%)
- Other species (2%)
Footnotes
- Source: iSEA survey of Tidal water recreational fishing 2023
- All values are from 2023 in 2023-dollars by calendar year, unless otherwise specified.
- 2023 data and 2020–2023-dollar values are considered preliminary and are subject to change.
Data
The commercial data and the recreational data that informed this work can be downloaded here.
- Date modified: