
Pacific oyster fishery
The following profile provides the socioeconomic context of the Pacific oyster fishery in British Columbia. It includes an overview of the commercial sector. This overview is based on data collected from DFO commercial harvest logbooks and sale slips, public reports, and DFO surveys on harvest prices.
Long text version
2023 Economic profile of the wild Pacific oyster fishery
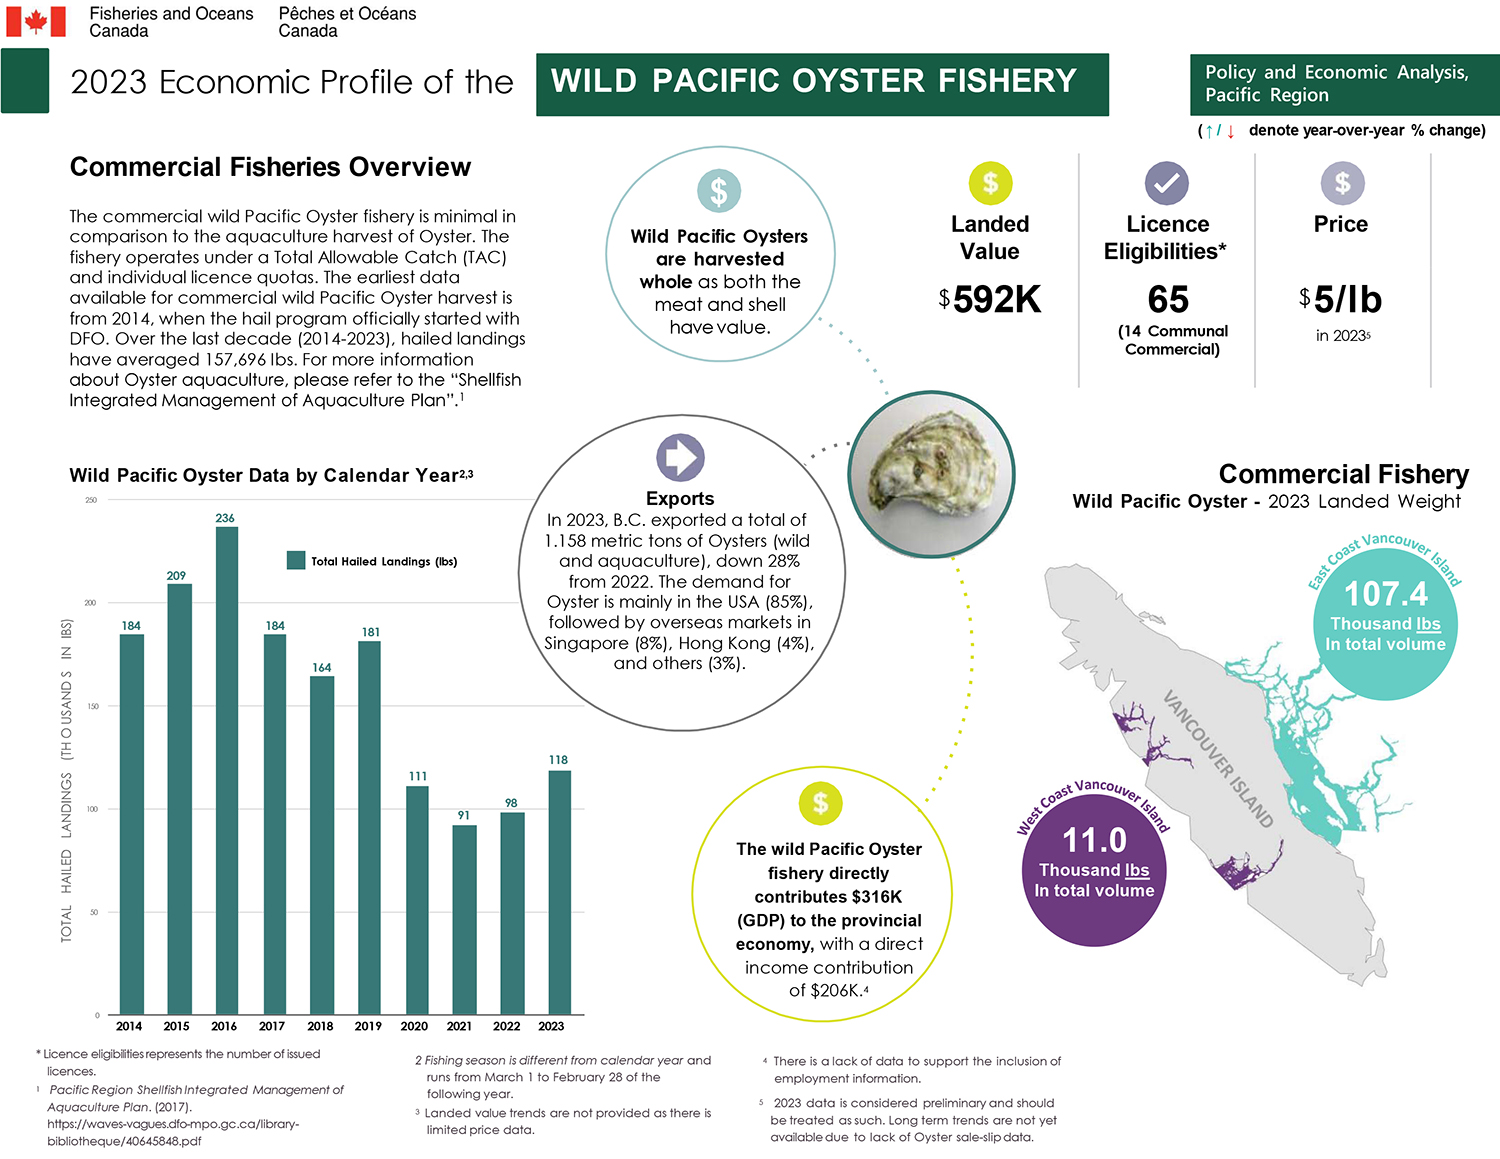
Commercial fisheries overview
The commercial wild Pacific oyster fishery is minimal in comparison to the aquaculture harvest of oyster. The fishery operates under a Total Allowable Catch (TAC) and individual licence quotas. The earliest data available for commercial wild Pacific oyster harvest is from 2014, when the hail program officially started with DFO. Over the last decade (2014-2023), hailed landings have averaged 157,696 lbs. For more information about oyster aquaculture, please refer to the “Shellfish Integrated Management of Aquaculture Plan”Footnote 1.
Key metrics for the wild Pacific oyster fishery, all values are from 2023 and in 2023 dollars
- Landed value ($592K)
- Licence eligibilities (65, with 14 communal commercial licences)
- Price ($5/lb) in 2023Footnote 5
Annual wild Pacific oyster landing by calendar year chartFootnote 2 Footnote 3
Total hailed landings (in lbs)
- 2014 – 184K lbs
- 2015 – 209K lbs
- 2016 – 236K lbs
- 2017 – 184K lbs
- 2018 – 164K lbs
- 2019 – 181K lbs
- 2020 – 111K lbs
- 2021 – 91K lbs
- 2022 – 98K lbs
- 2023 – 118K lbs
Commercial fishery wild pacific oyster - 2023 landed weight map
- East Coast Vancouver Island (107.4K lbs in total volume)
- West Coast Vancouver Island (11K lbs in total volume)
Exports: In 2023, B.C. exported a total of 1.158 metric tons of Oysters (wild and aquaculture), down 28% from 2022. The demand for Oyster is mainly in the USA (85%), followed by overseas markets in Singapore (8%), Hong Kong (4%), and others (3%).
Wild Pacific Oysters are harvested whole as both the meat and shell have value.
The wild Pacific Oyster fishery directly contributes $316K (GDP) to the provincial economy, with a direct income contribution of $206K.Footnote 4
Footnotes
- *Licence eligibilities represents the number of issued licences.
Data
The commercial data that informed this work can be downloaded here.
- Date modified: