
Prawn fishery
The following profile provides the socioeconomic context of the prawn fishery in British Columbia. It includes an overview of the commercial and recreational sectors. This overview is based on data collected from DFO commercial harvest logbooks and sale slips, public reports, and DFO surveys on harvest prices and recreational fisheries.
Long text version
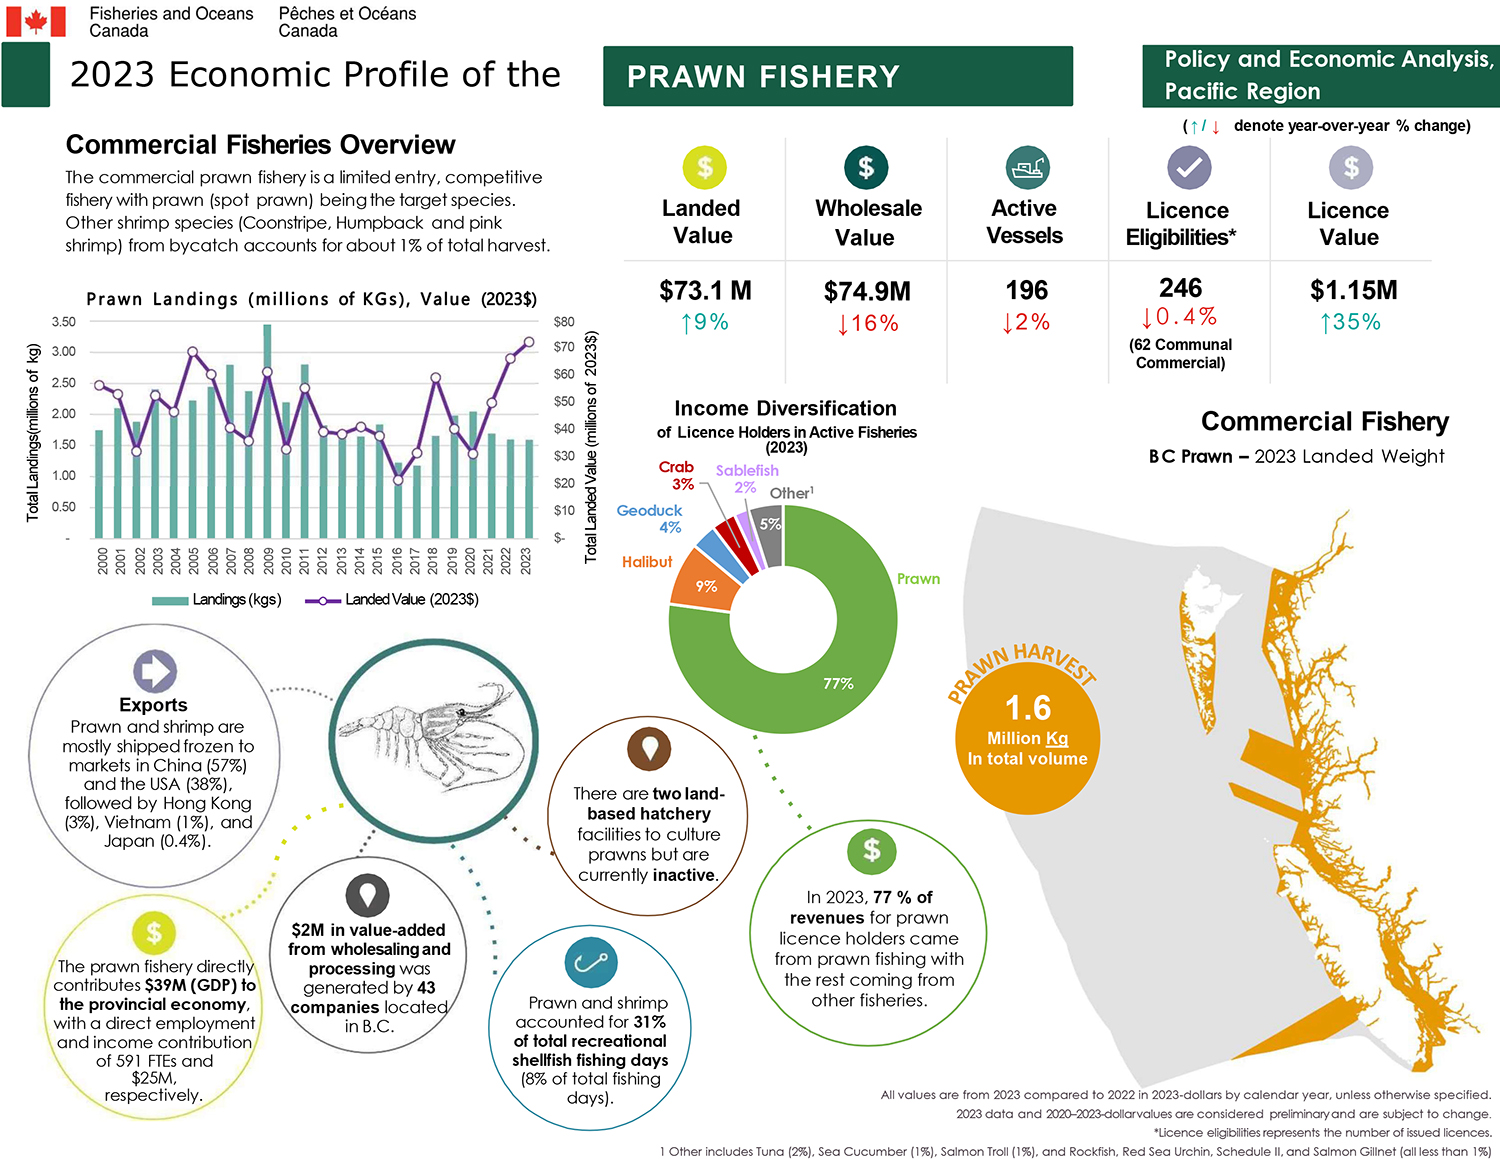
2023 Economic profile of the prawn fishery
Commercial fisheries overview
The commercial prawn fishery is a limited entry, competitive fishery with prawn (spot prawn) being the target species. Other shrimp species (Coonstripe, Humpback and pink shrimp) from bycatch accounts for about 1% of total harvest.
Key metrics for the prawn fishery, all values are from 2023 and in 2023 dollars:
- Landed value ($73.1M), increased by 9% since 2022
- Wholesale value ($74.9M), decreased by 16% since 2022
- Active vessels (196), decreased by 2% since 2022
- Licence eligibilities (246, with 62 communal commercial licences), decreased by 0.4% since 2022
- Licence value ($1.15M), increased by 35% since 2022
Annual prawn landings and value chart
Landings (in kilograms)
- 2000 - 1.7M kg
- 2001 - 2.1M kg
- 2002 - 1.9M kg
- 2003 - 2.4M kg
- 2004 - 2.0M kg
- 2005 - 2.2M kg
- 2006 - 2.4M kg
- 2007 - 2.8M kg
- 2008 - 2.4M kg
- 2009 - 3.4M kg
- 2010 - 2.2M kg
- 2011 - 2.8M kg
- 2012 - 1.8M kg
- 2013 - 1.7M kg
- 2014 - 1.6M kg
- 2015 - 1.8M kg
- 2016 - 1.2M kg
- 2017 - 1.2M kg
- 2018 - 1.7M kg
- 2019 - 2.0M kg
- 2020 - 2.0M kg
- 2021 - 1.7M kg
- 2022 - 1.6M kg
- 2023 - 1.6M kg
Landed value (in 2023$)
- 2000 - $56M
- 2001 - $53M
- 2002 - $32M
- 2003 - $53M
- 2004 - $47M
- 2005 - $69M
- 2006 - $60M
- 2007 - $41M
- 2008 - $36M
- 2009 - $61M
- 2010 - $33M
- 2011 - $56M
- 2012 - $39M
- 2013 - $39M
- 2014 - $41M
- 2015 - $38M
- 2016 - $22M
- 2017 - $32M
- 2018 - $59M
- 2019 - $40M
- 2020 - $31M
- 2021 - $50M
- 2022 - $66M
- 2023 - $73M
Commercial fishery BC prawn - 2023 landed weight map
- Prawn harvest: 1.6 million kilograms in total volume
Income diversification of licence holders in active fisheries (2023)
In 2023, 77% of revenues for prawn licence holders came from prawn fishing with the rest coming from other fisheries. Halibut (9%), Geoduck (4%), Crab (3%), Sablefish (2%), Tuna (2%), Sea Cucumber (1%), Salmon Troll (1%), and Rockfish, Red Sea Urchin, Schedule II, and Salmon Gillnet (all less than 1%).
Exports: Prawn and shrimp are mostly shipped frozen to markets in China (57%) and the USA (38%), followed by Hong Kong (3%), Vietnam (1%), and Japan (0.4%).
$2M in value-added from wholesaling and processing was generated by 43 companies located in B.C.
The prawn fishery directly contributes $39M (GDP) to the provincial economy, with a direct employment and income contribution of 591 FTEs and $25M respectively.
There are two land-based hatchery facilities to culture prawns but are currently inactive.
Prawn and shrimp accounted for 31% of total recreational shellfish fishing days (8% of total fishing days).
Footnotes
- All values are from 2023 compared to 2022 in 2023-dollars by calendar year, unless otherwise specified.
- 2023 data and 2020–2023-dollar values are considered preliminary and are subject to change.
- Licence eligibilities represents the number of issued licences.
- 1 other includes Tuna (2%), Sea Cucumber (1%), Salmon Troll (1%), and Rockfish, Red Sea Urchin, Schedule II, and Salmon Gillnet (all less than 1%)
Data
The commercial data and the recreational data that informed this work can be downloaded here.
- Date modified: