
Red sea urchin fishery
The following profile provides the socioeconomic context of the red sea urchin fishery in British Columbia. It includes an overview of the commercial sector. This overview is based on data collected from DFO commercial harvest logbooks and sale slips, public reports, and DFO surveys on harvest prices.
Long text version
2023 Economic profile of the red sea urchin fishery
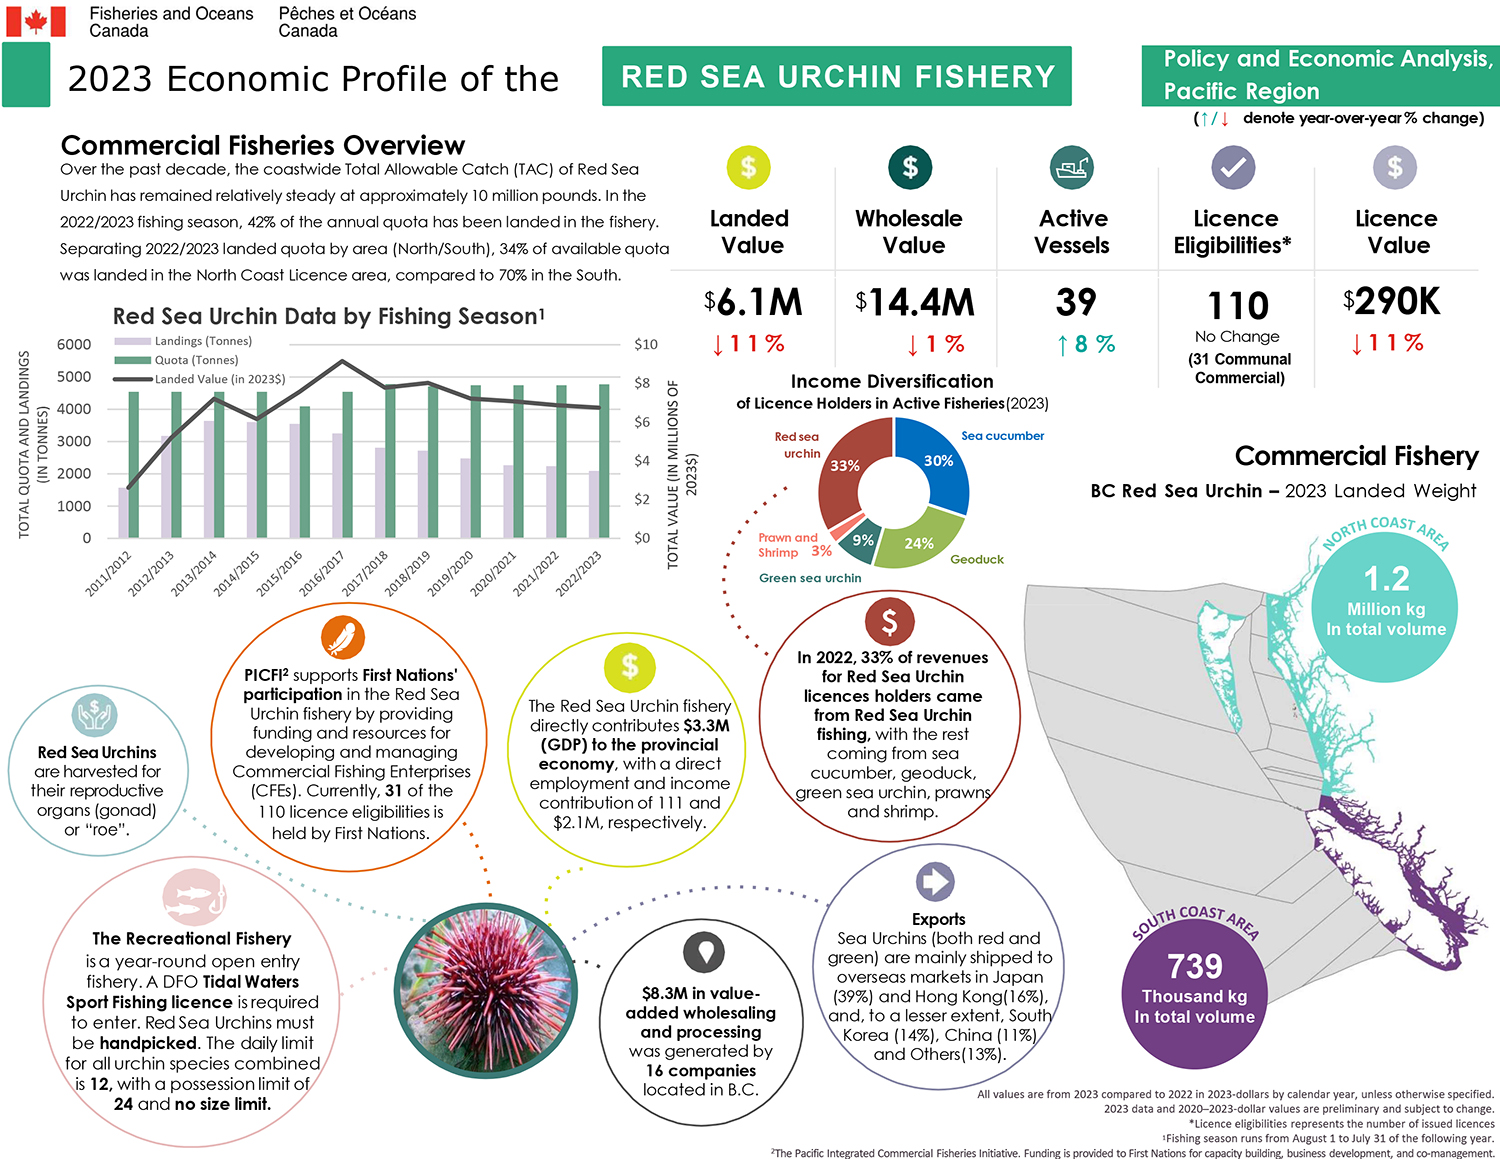
Commercial fisheries overview
Over the past decade, the coastwide Total Allowable Catch (TAC) of red sea urchin has remained relatively steady at approximately 10 million pounds. In the 2022/2023/ fishing season, 42% of the annual quota has been landed in the fishery. Separating 2022/2023/ landed quota by area (North/South), 34% of available quota was landed in the North Coast Licence area, compared to 70% in the South.
Key metrics for the red sea urchin, all the values are from 2023 in 2023 dollars:
- Landed value ($6.1M), decreased by 11% since 2022
- Wholesale value ($14.4M), decreased by 1 % since 2022
- Active vessels (39), decreased by 8% since 2022
- Licence eligibilities (110, 31 of these are communal commercial licences), no changes since 2022
- Licence value ($290K), decreased by 11% since 2022
Red sea urchin data by fishing seasonFootnote 1 chart
Landings (lbs)
- 2011 - 5.5M lbs
- 2012 - 6.6M lbs
- 2013 - 7.5M lbs
- 2014 - 8.2M lbs
- 2015 - 8.6M lbs
- 2016 - 7.2M lbs
- 2017 - 6.5M lbs
- 2018 - 5.9M lbs
- 2019 - 6.4M lbs
- 2020 - 4.9M lbs
- 2021 - 4.9M lbs
- 2022 - 4.9M lbs
- 2023 - 4.4M lbs
Quota (lbs)
- 2011- 10M lbs
- 2012 - 10M lbs
- 2013 - 10M lbs
- 2014 - 10M lbs
- 2015 - 10M lbs
- 2016 - 9M lbs
- 2017 - 10M lbs
- 2018 - 10.5M lbs
- 2019 - 10.4M lbs
- 2020 - 10.5M lbs
- 2021 - 10.5M lbs
- 2022 - 10.5M lbs
- 2023 - 10.3M lbs
Landed value (2023$)
- 2011 - $4.1M
- 2012 - $5.0M
- 2013 - $6.8M
- 2014 - $6.2M
- 2015 - $7.2M
- 2016 - $8.5M
- 2017 - $8.1M
- 2018 - $7.6M
- 2019 - $8.5M
- 2020 - $7.0M
- 2021 - $6.7M
- 2022 - $6.9M
- 2023 - $6.1M
Commercial fishery BC red sea urchin - 2023 landed weight map
- North Area: 1.2M kilograms in total volume
- South Area: 739K kilograms in total volume
Income distribution of red sea urchin licence holders in active fisheries (2023)
In 2023, 33% of revenues for red sea urchin licences holders came from red sea urchin fishing, with the rest coming from sea cucumber (30%), geoduck (24%), green sea urchin (9%), prawns and shrimp (3%).
Exports: sea urchins (both red and green) are mainly shipped to overseas markets in Japan (39%) and Hong Kong (16%), and, to a lesser extent, South Korea (14%), China (11%) and Others (13%).
$8.3M in value-added wholesaling and processing was generated by 16 companies located in B.C.
The red sea urchin fishery directly contributes $3.3M (GDP) to the provincial economy, with a direct employment and income contribution of 111 and $2.1M, respectively.
Red Sea Urchins are harvested for their reproductive organs (gonad) or “roe”.
PICFIFootnote 2 supports First Nations participation in the Red Sea Urchin fishery by providing funding and resources for developing and managing Commercial Fishing Enterprises (CFEs). Currently, 31 of the 110 licence eligibilities is held by First Nations.
The Recreational Fishery is a year-round open entry fishery. A DFO Tidal Waters Sport Fishing licence is required to enter. Red Sea Urchins must be handpicked. The daily limit for all urchin species combined is 12, with a possession limit of 24 and no size limit.
Footnotes
- All values are from 2023 compared to 2022 in 2023-dollars by calendar year, unless otherwise specified.
- 2023 data and 2020–2023-dollar values are preliminary and subject to change.
- Licence eligibilities represents the number of issued licences.
Data
The commercial data that informed this work can be downloaded here.
- Date modified: