
Tuna fishery
The following profile provides the socioeconomic context of the tuna fishery in British Columbia. It includes an overview of the commercial and recreational sectors. This overview is based on data collected from DFO commercial harvest logbooks and sale slips, public reports, and DFO surveys on harvest prices and recreational fisheries.
Long text version
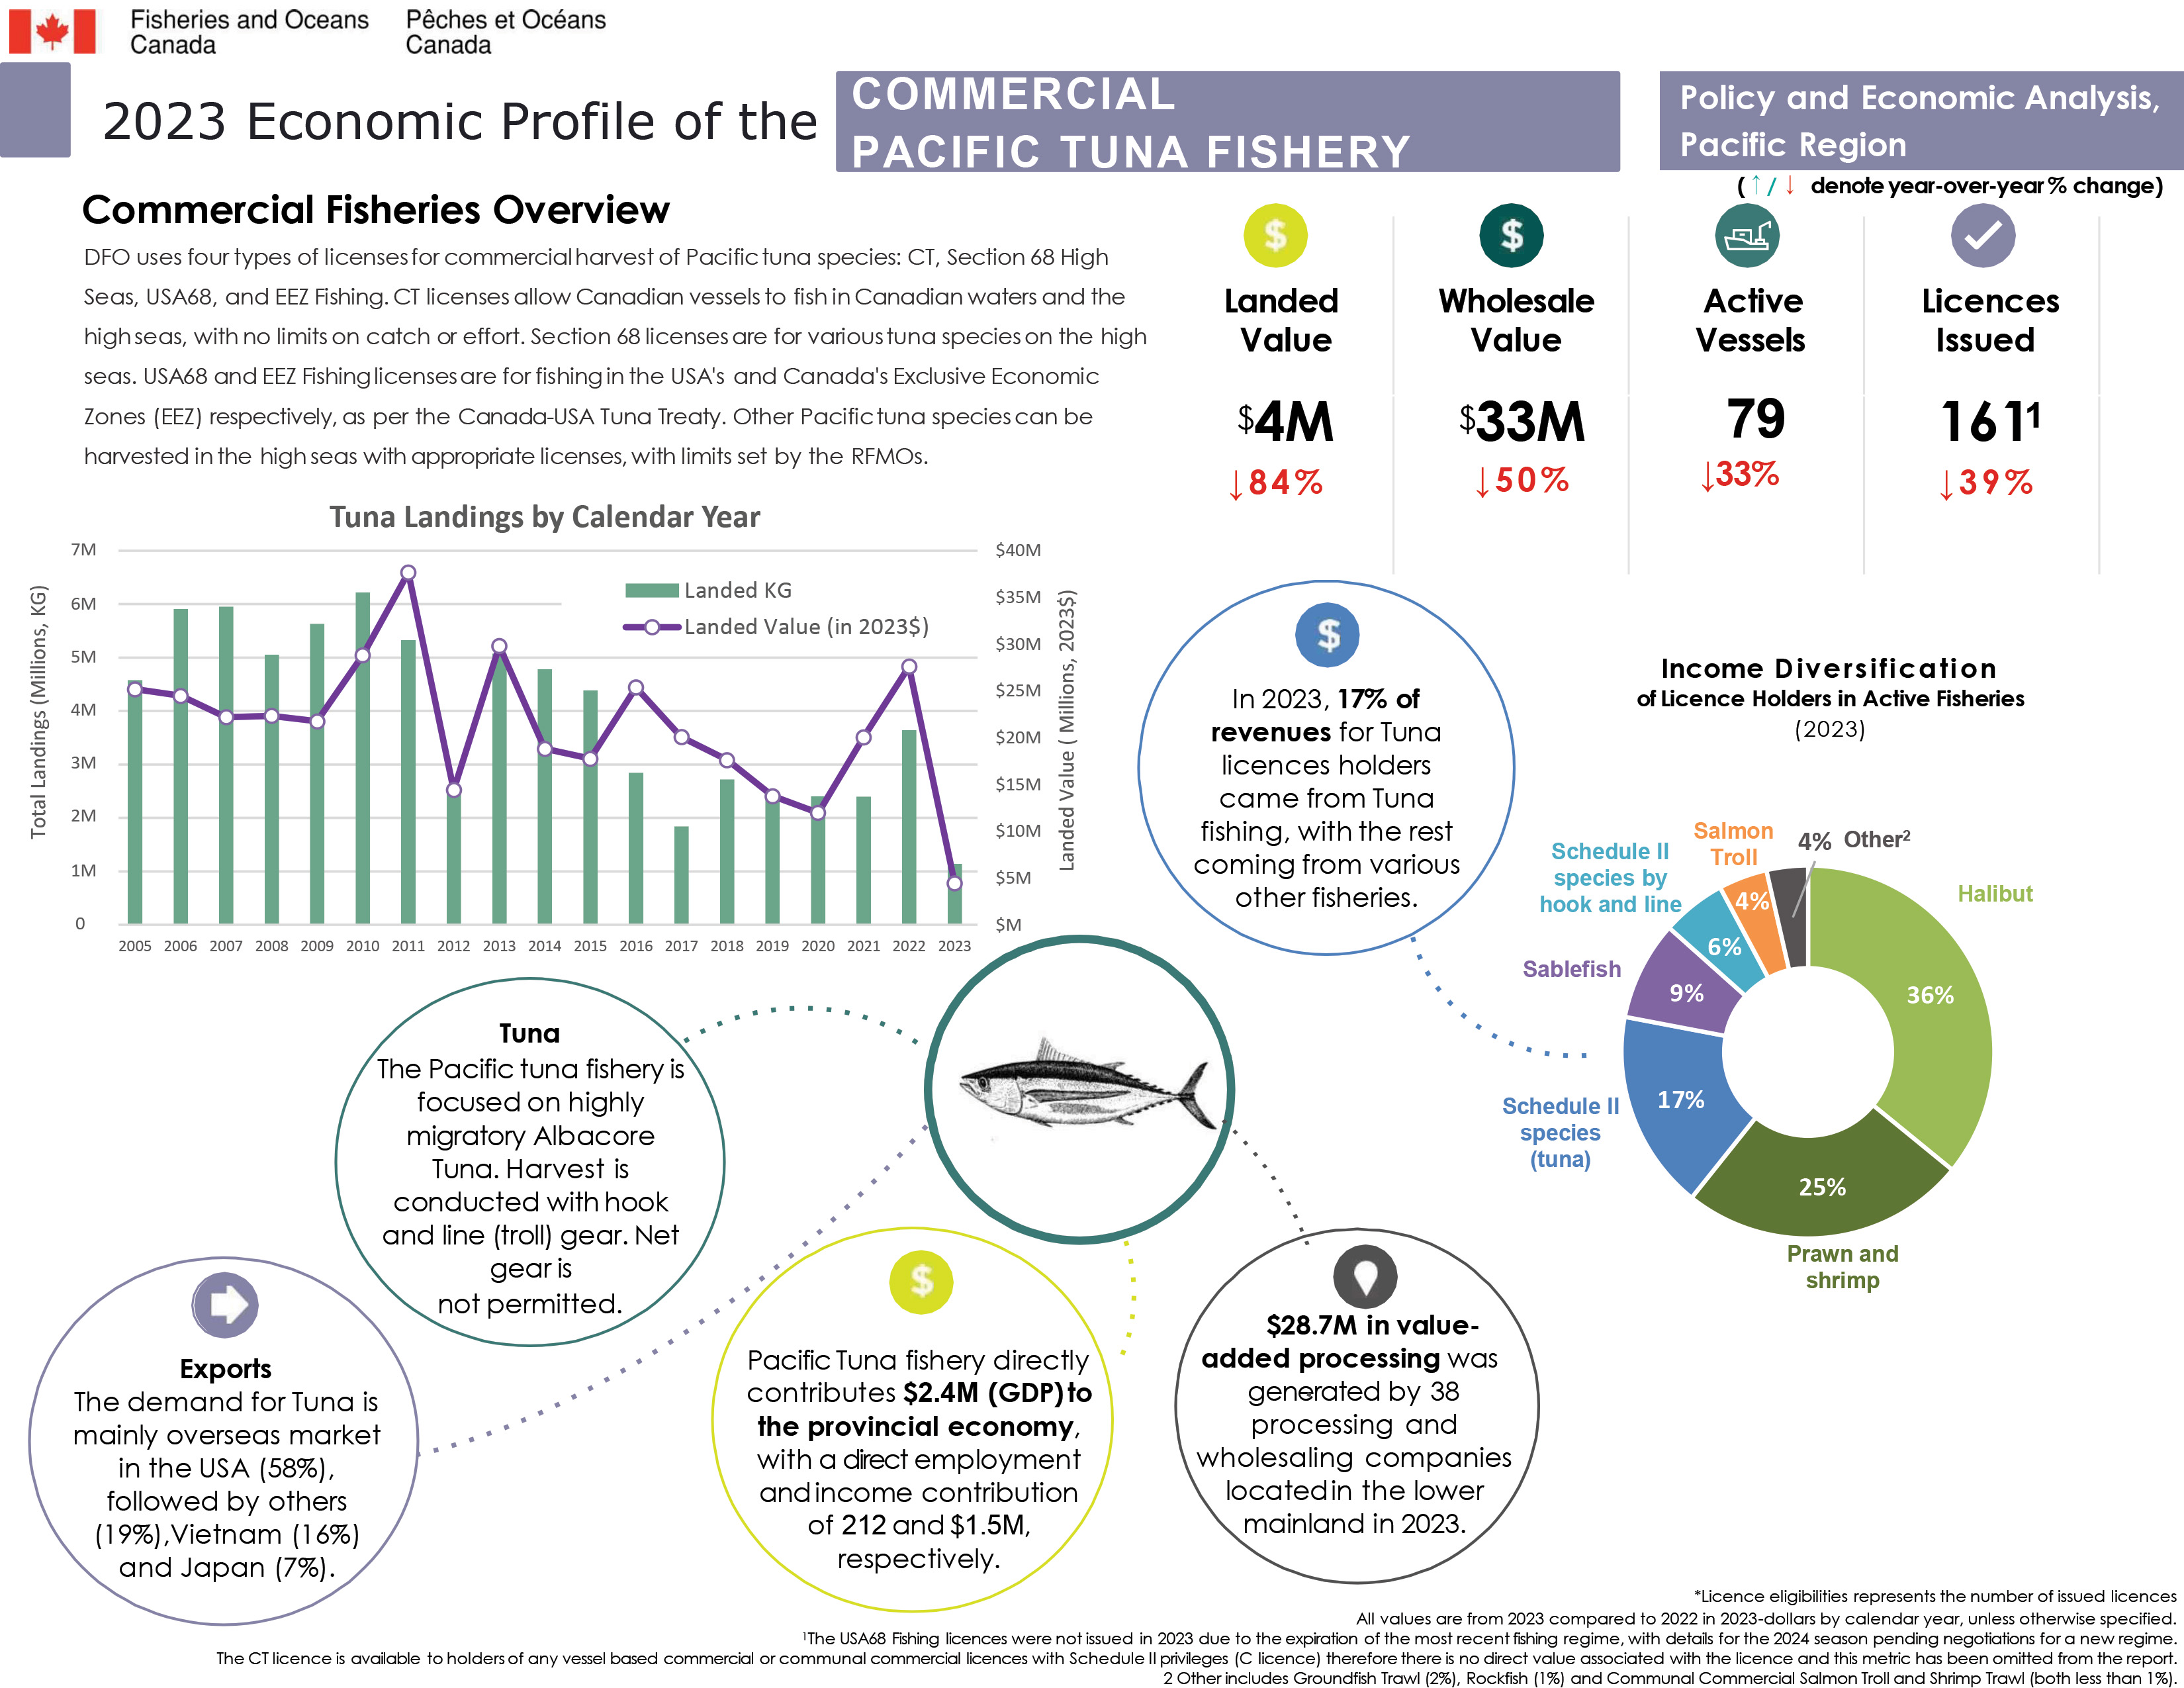
Commercial fisheries overview
DFO uses four types of licenses for commercial harvest of Pacific tuna species: CT, Section 68 High Seas, USA68, and EEZ Fishing. CT licenses allow Canadian vessels to fish in Canadian waters and the high seas, with no limits on catch or effort. Section 68 licenses are for various tuna species on the high seas. USA68 and EEZ Fishing licenses are for fishing in the USA's and Canada's Exclusive Economic Zones (EEZ) respectively, as per the Canada-USA Tuna Treaty. Other Pacific tuna species can be harvested in the high seas with appropriate licenses, with limits set by the RFMOs.
Key metrics of the Pacific Tuna Fishery, all values are from 2023 in 2023 dollars:
- Landed value ($4M), decreased by 84% since 2022
- Wholesale value ($33M), decreased by 50% since 2022
- Active vessels (79), decreased by 33% since 2022
- Licences issued (1611), decreased by 39% since 2022
Tuna landings by calendar year chart
Landed kilograms
- 2005 – 4.57M KG
- 2006 – 5.91M KG
- 2007 – 5.95M KG
- 2008 – 5.05M KG
- 2009 – 5.63M KG
- 2010 – 6.22M KG
- 2011 – 5.32M KG
- 2012 – 2.48M KG
- 2013 – 5.07M KG
- 2014 – 4.78M KG
- 2015 – 4.38M KG
- 2016 – 2.84M KG
- 2017 – 1.84M KG
- 2018 – 2.72M KG
- 2019 – 2.39M KG
- 2020 – 2.41M KG
- 2021 – 2.40M KG
- 2022 – 3.64M KG
- 2023 – 1.14M KG
Landed value (in 2023$)
- 2005 - $25.2M
- 2006 - $24.5M
- 2007 - $22.2M
- 2008 - $22.3M
- 2009 - $21.7M
- 2010 – $28.8M
- 2011 - $37.6M
- 2012 - $14.4M
- 2013 - $29.8M
- 2014 - $18.8M
- 2015 - $17.7M
- 2016 - $25.4M
- 2017 - $20.1M
- 2018 - $17.6M
- 2019 - $13.7M
- 2020 - $11.9M
- 2021 - $20.0M
- 2022 - $27.6M
- 2023 - $4.4M
Income diversification of licence holders in active fisheries (2023)
In 2023, 17% of revenues for tuna licence holders came from tuna fishing, with the rest coming from Halibut (36%), Prawn and Shrimp (25%), Sablefish (9%), Schedule II (6%), Salmon by Troll (4%), and a combined 4% from Groundfish Trawl (2%), Rockfish (1%), and Communal Commercial Salmon Troll and Shrimp Trawl (both less than 1%).
Exports: The demand for Tuna is mainly overseas market in the USA (58%), followed by others (19%),Vietnam(16%) and Japan(7%).
$28.7M in value-added processing was generated by 38 processing and wholesaling companies located in the lower mainland in 2023.
Pacific Tuna fishery directly contributes $2.4M (GDP) to the provincial economy, with a direct employment and income contribution of 212 and $1.5M, respectively.
The Pacific tuna fishery is focused on highly migratory Albacore Tuna. Harvest is conducted with hook and line (troll) gear. Net gear is not permitted.
Footnotes:
- Licence eligibilities represents the number of issued licences.
- All values are from 2023 compared to 2022 in 2023-dollars by calendar year, unless otherwise specified.
- 1The USA68 Fishing licences were not issued in 2023 due to the expiration of the most recent fishing regime, with details for the 2024 season pending negotiations for a new regime.
- The CT licence is available to holders of any vessel based commercial or communal commercial licences with Schedule II privileges (C licence) therefore there is no direct value associated with the licence and this metric has been omitted from the report.
Long text version
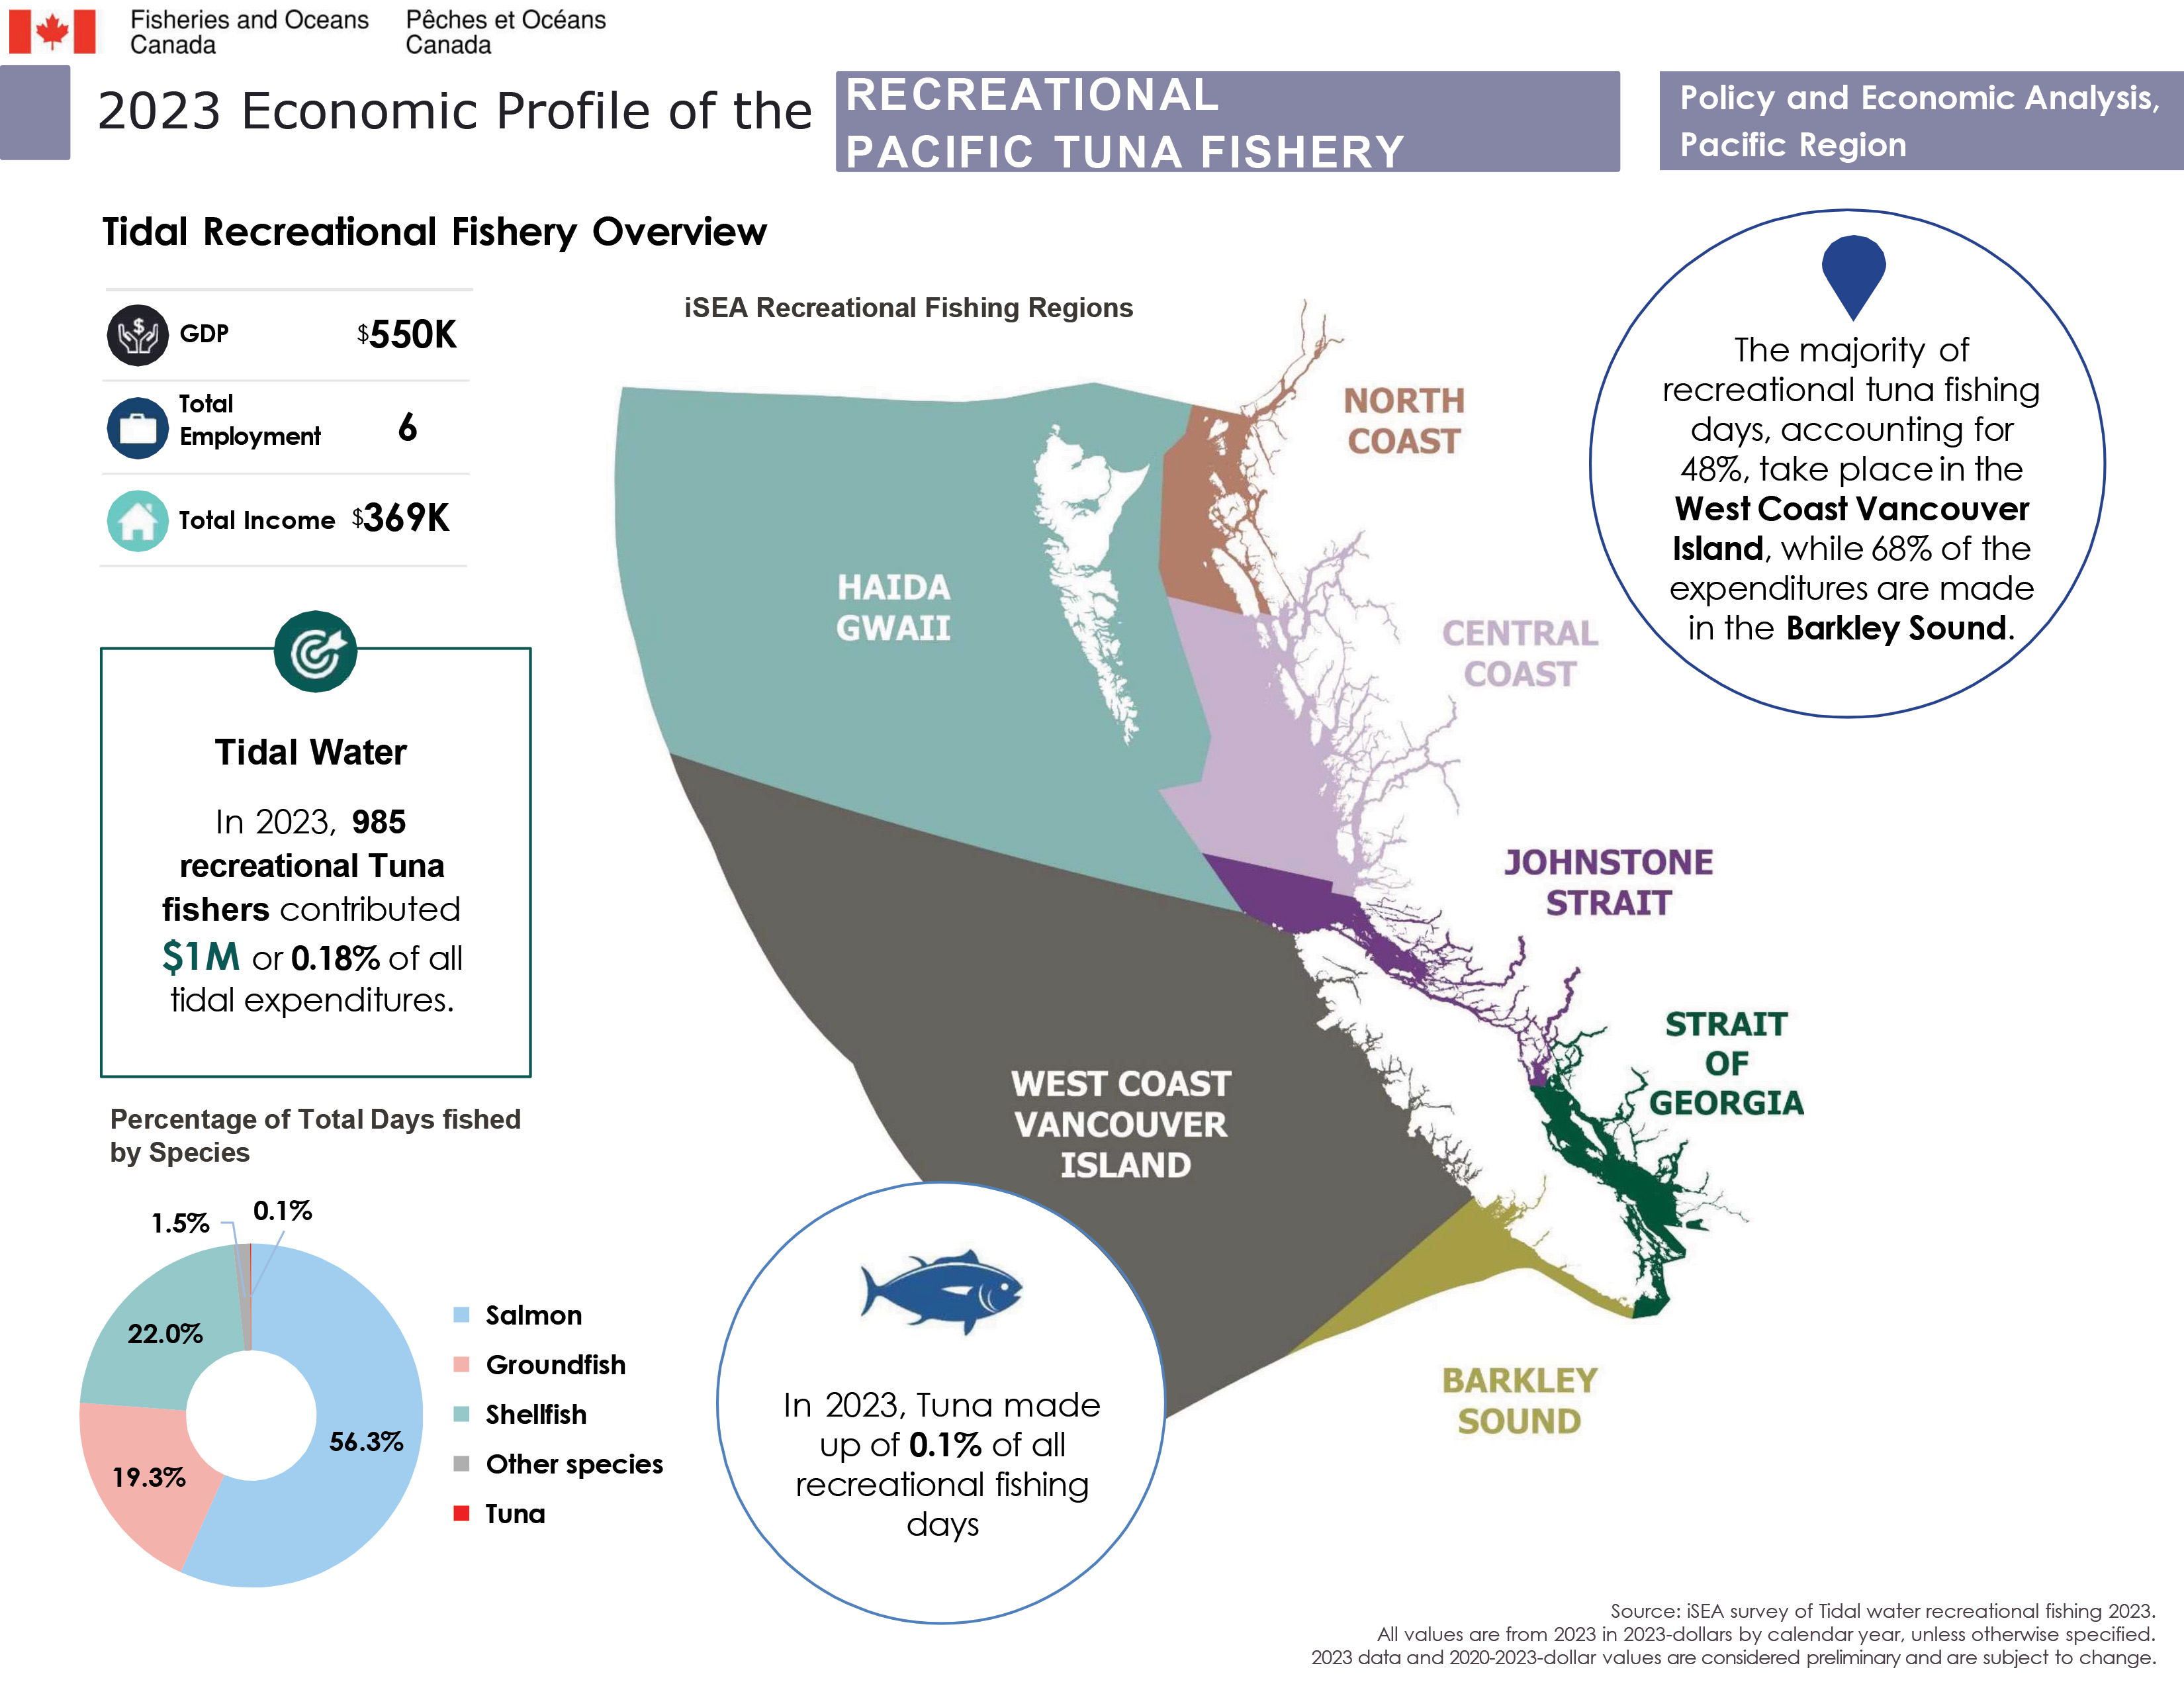
Tidal recreational fishery overview
Key metrics
- GDP ($550K)
- Total employment (6)
- Total income ($369K)
In 2023, 985 recreational tuna fishers contributed $1M or 0.18% of all tidal expenditures.
Percentage of total days fished by species
- Salmon 56.3%
- Groundfish 19.3%
- Shellfish 22.0%
- Other species 1.5%
- Tuna 0.1%
In 2023, tuna made up of 0.1% of all recreational fishing days.
The majority of recreational tuna fishing days, accounting for 48%, take place in the West Coast Vancouver Island, while 68% of the expenditures are made in the Barkley Sound.
Footnotes:
- Source: iSEA survey of Tidal water recreational fishing 2023.
- All values are from 2023 in 2023-dollars by calendar year, unless otherwise specified.
- 2023 data and 2020-2023-dollar values are considered preliminary and are subject to change.
Data
The commercial data and the recreational data that informed this work can be downloaded here.
- Date modified: