
All Pacific commercial fisheries
This profile provides a sector-wide overview of the economic contributions of Pacific commercial wild-capture fisheries, drawing primarily on data from DFO logbooks, sale slips, surveys, and public reports and data.
Long text version
2024 economic profile of all BC commercial fisheries
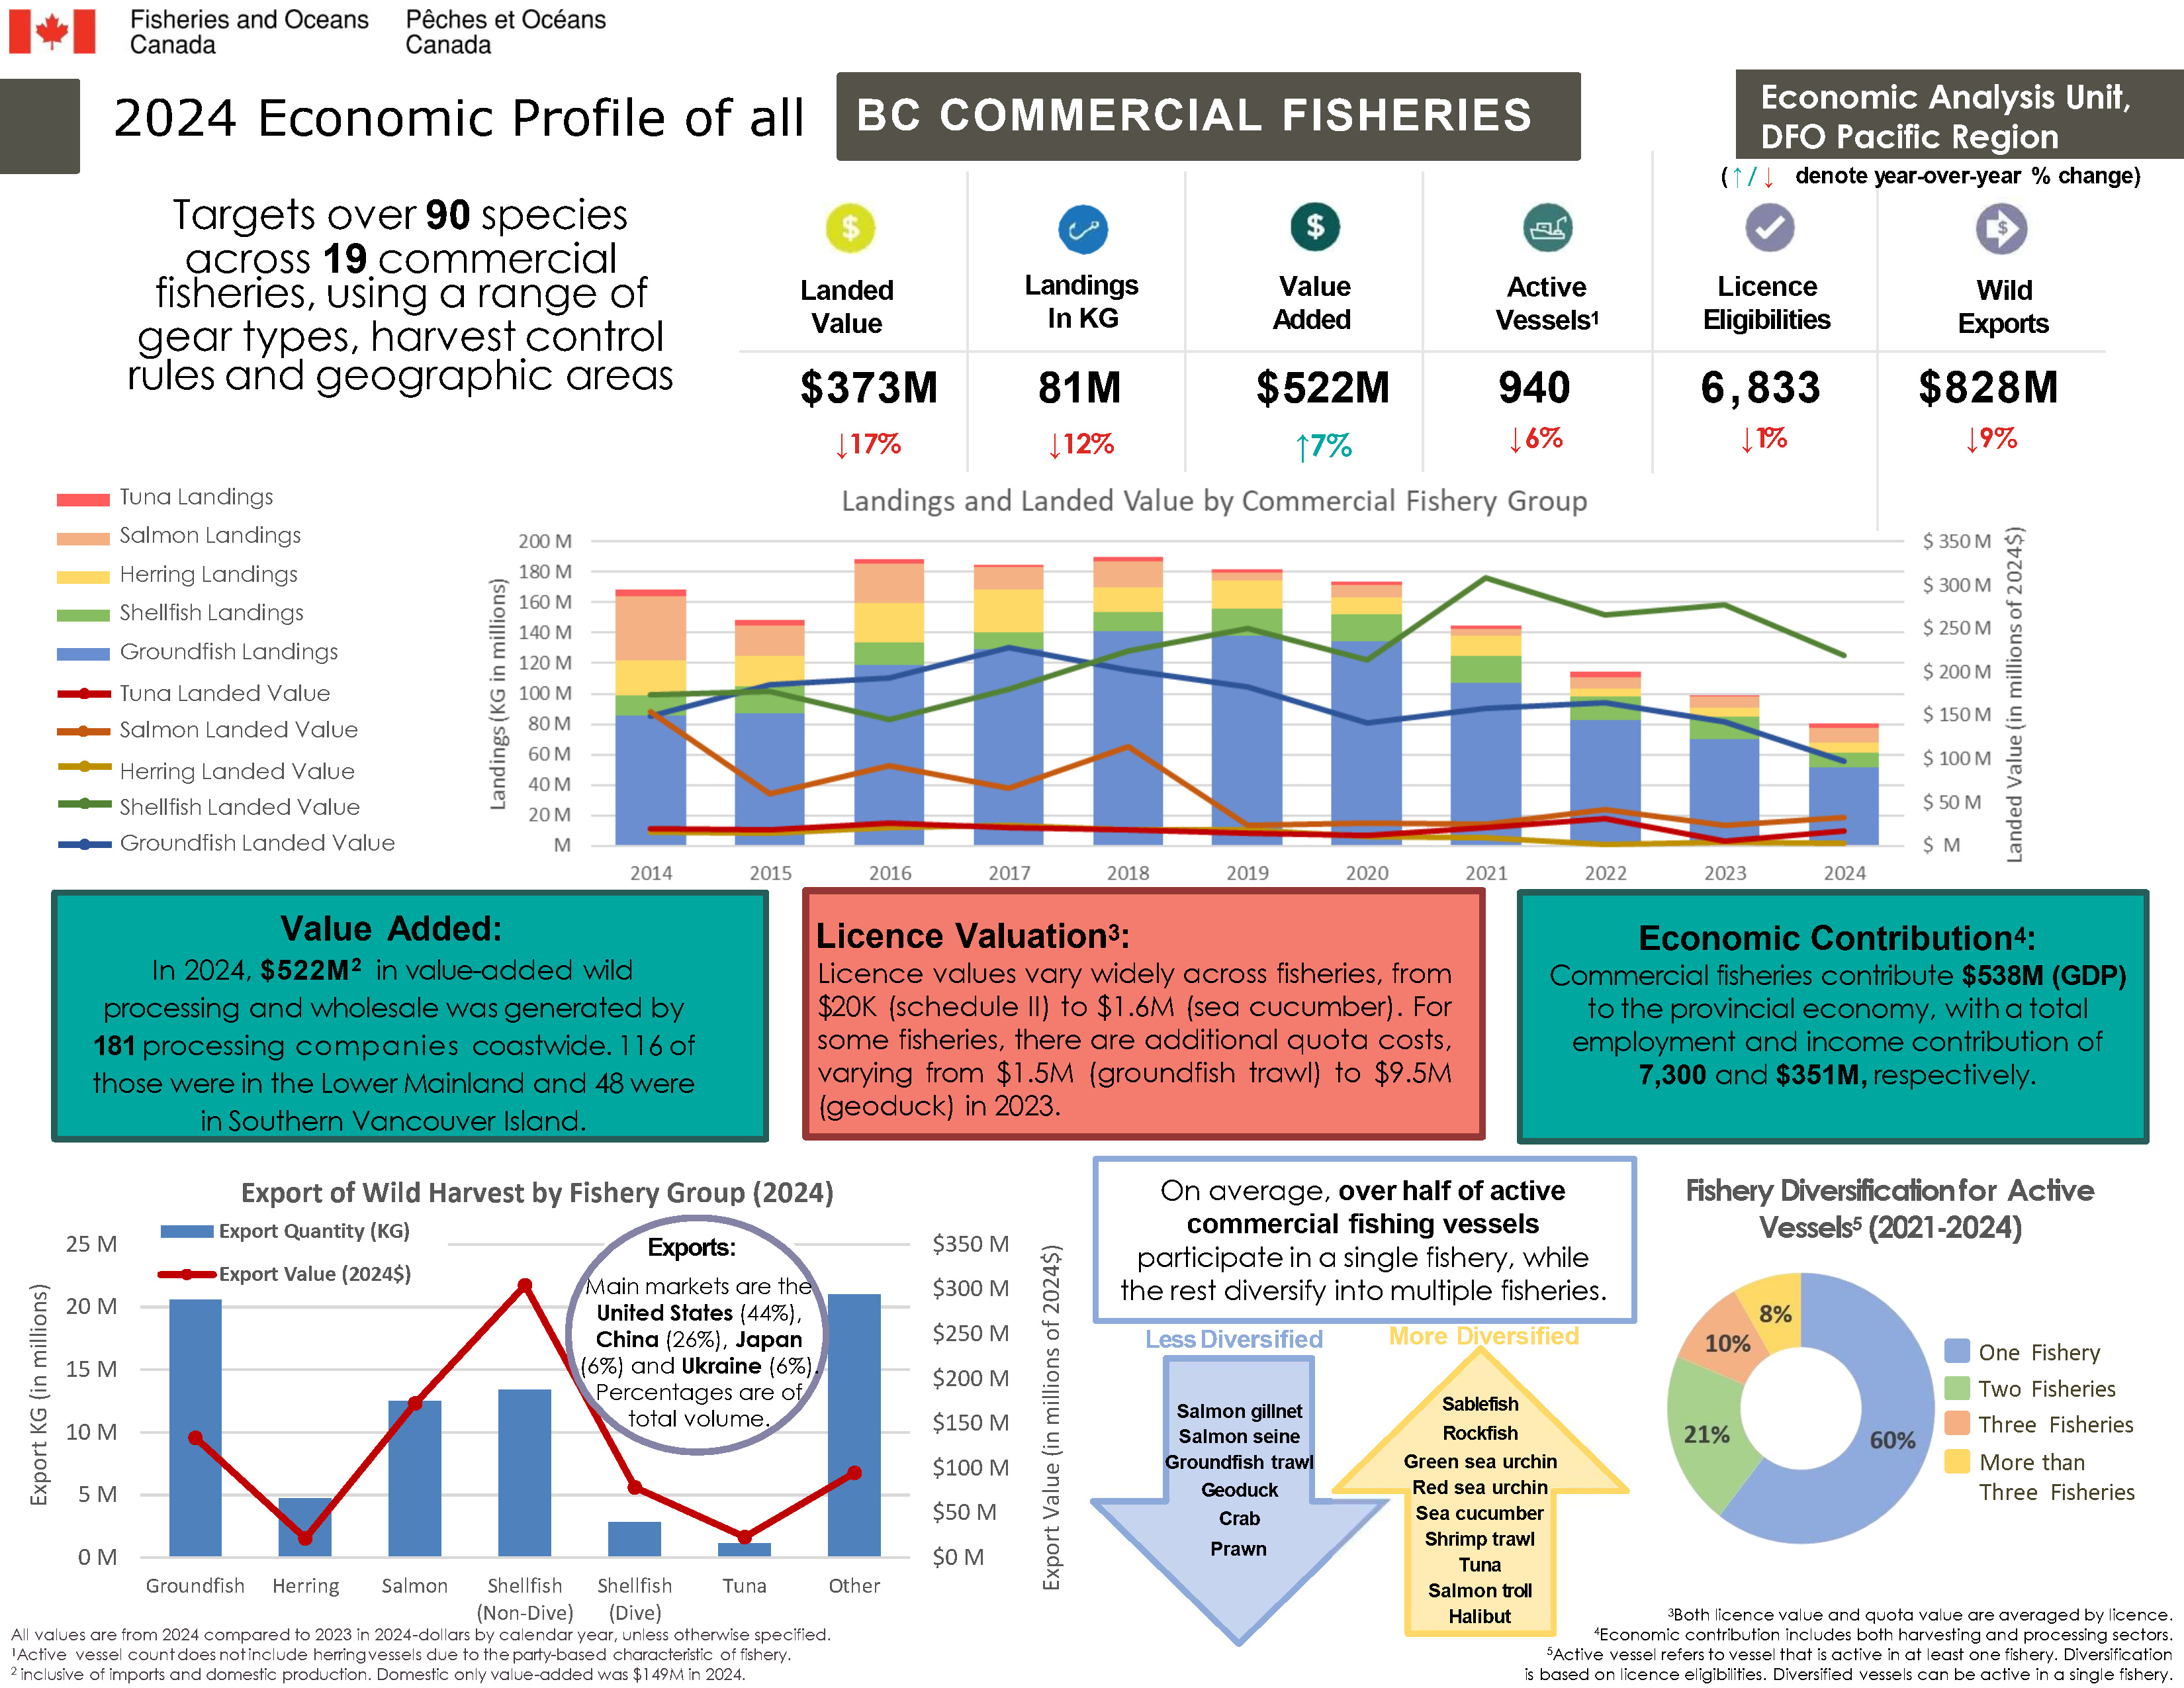
The commercial fisheries targets over 90 species across 19 commercial fisheries, using a range of gear types, harvest control rules and geographic areas.
All values are from 2024 compared to 2023 in 2024-dollars by calendar year, unless otherwise specified.
Key metrics (values are in 2024 dollars)
Up and down arrows denote year-over-year percentage change.
- Landed value ($373M), decreased by 17% since 2023
- Landings in kilograms (81M), decreased by 12% since 2023
- Value-added from processing ($522M), increased by 7% since 2023
- Active vessels (940) decreased by 6% since 2023. Active vessel count does not include herring vessels due to the party-based characteristic of fishery.
- Licence eligibilities (6,833), decreased by 1% since 2023
- Wild exports ($828M, decreased by 9% since 2023)
Landings (in kilograms) and landed value (in 2024 dollars) by commercial fishery group
Landings (in kilograms)
Tuna landings
- 2013 - 5.1M KG
- 2014 - 4.8M KG
- 2015 - 4.4M KG
- 2016 - 2.8M KG
- 2017 - 1.8M KG
- 2018 - 2.7M KG
- 2019 - 2.4M KG
- 2020 - 2.4M KG
- 2021 - 2.4M KG
- 2022 - 3.6M KG
- 2023 - 1.1M KG
- 2024 - 2.9M KG
Salmon landings
- 2013 - 30M KG
- 2014 - 42M KG
- 2015 - 20M KG
- 2016 - 26M KG
- 2017 - 15M KG
- 2018 - 17M KG
- 2019 - 5M KG
- 2020 - 8M KG
- 2021 - 4M KG
- 2022 - 8M KG
- 2023 - 7M KG
- 2024 - 9M KG
Herring landings
- 2013 - 19M KG
- 2014 - 23M KG
- 2015 - 20M KG
- 2016 - 26M KG
- 2017 - 28M KG
- 2018 - 16M KG
- 2019 - 19M KG
- 2020 - 11M KG
- 2021 - 14M KG
- 2022 - 5M KG
- 2023 - 6M KG
- 2024 - 7M KG
Shellfish landings
- 2013 - 13M KG
- 2014 - 13M KG
- 2015 - 18M KG
- 2016 - 15M KG
- 2017 - 12M KG
- 2018 - 13M KG
- 2019 - 18M KG
- 2020 - 17M KG
- 2021 - 18M KG
- 2022 - 16M KG
- 2023 - 14M KG
- 2024 - 10M KG
Groundfish landings
- 2013 - 98M KG
- 2014 - 86M KG
- 2015 - 88M KG
- 2016 - 120M KG
- 2017 - 130M KG
- 2018 - 142M KG
- 2019 - 139M KG
- 2020 - 135M KG
- 2021 - 107M KG
- 2022 - 83M KG
- 2023 - 71M KG
- 2024 - 51M KG
Landed value (in 2024 dollars)
Tuna landed value
- 2013 - $30M
- 2014 - $19M
- 2015 - $18M
- 2016 - $25M
- 2017 - $20M
- 2018 - $18M
- 2019 - $14M
- 2020 - $12M
- 2021 - $20M
- 2022 - $31M
- 2023 - $6M
- 2024 - $17M
Salmon landed value
- 2013 - $51M
- 2014 - $150M
- 2015 - $58M
- 2016 - $90M
- 2017 - $65M
- 2018 - $111M
- 2019 - $22M
- 2020 - $25M
- 2021 - $24M
- 2022 - $41M
- 2023 - $23M
- 2024 - $32M
Herring landed value
- 2013 - $10M
- 2014 - $15M
- 2015 - $14M
- 2016 - $21M
- 2017 - $23M
- 2018 - $17M
- 2019 - $18M
- 2020 - $10M
- 2021 - $9M
- 2022 - $2M
- 2023 - $4M
- 2024 - $2M
Shellfish landed value
- 2013 - $154M
- 2014 - $168M
- 2015 - $172M
- 2016 - $140M
- 2017 - $174M
- 2018 - $217M
- 2019 - $243M
- 2020 - $205M
- 2021 - $298M
- 2022 - $258M
- 2023 - $268M
- 2024 - $221M
Groundfish landed value
- 2013 - $155M
- 2014 - $149M
- 2015 - $185M
- 2016 - $192M
- 2017 - $228M
- 2018 - $202M
- 2019 - $183M
- 2020 - $140M
- 2021 - $164M
- 2022 - $168M
- 2023 - $148M
- 2024 - $98M
Value added
In 2024, $522M in value-added wild processing and wholesale was generated by 181 processing plants coastwide. 116 of those were in the Lower Mainland and 48 were in southern Vancouver Island. This is inclusive of imports and domestic production. Domestic only value-added was $149M in 2024.
Licence valuation
Licence values vary widely across fisheries, from $20K (schedule II) to $1.6M (sea cucumber). For some fisheries, there are additional quota costs, varying from $1.5M (groundfish trawl) to $9.5M (geoduck) in 2023. Both licence value and quota value are averaged by licence.
Economic contribution
Commercial fisheries contributed $538M (GDP) to the provincial economy, with a total employment and income contribution of 7,300 and $351M, respectively. Economic contribution includes both harvesting and processing sectors.
Export of wild harvest by fishery group (2024)
Export quantity (in kilograms)
- Groundfish - 21M KG
- Herring - 4.7M KG
- Salmon – 12.5M KG
- Shellfish (non-dive) - 13M KG
- Shellfish (dive) - 2.8M KG
- Tuna 1.1M KG
- Other 21M KG
Export value (in 2024 dollars)
- Groundfish - $134M
- Herring - $22M
- Salmon - $173M
- Shellfish (non-dive) - $304M
- Shellfish (dive) - $79M
- Tuna - $23M
- Other - $95M
Exports: main markets are the United States (44%), China (26%), Japan (6%), and Ukraine (6%). Percentages are of total volume.
On average, over half of active commercial fishing vessels participate in a single fishery, while the rest diversify into multiple fisheries.
Less diversified fisheries:
- Salmon gillnet
- Salmon seine
- Groundfish trawl
- Geoduck
- Crab
- Prawn
More diversified fisheries:
- Sablefish
- Rockfish
- Green sea urchin
- Red sea urchin
- Sea cucumber
- Shrimp trawl
- Tuna
- Salmon troll
- Halibut
Fishery diversification for active vessels (2021-2024)
Active vessel refers to a vessel that is active in at least one fishery. Diversification is based on licence eligibilities. Diversified vessels can be active in a single fishery.
- One fishery 60%
- Two fisheries 21%
- Three fisheries 10%
- More than three fisheries 8%
Long text version
2024 economic profile of all BC commercial fisheries
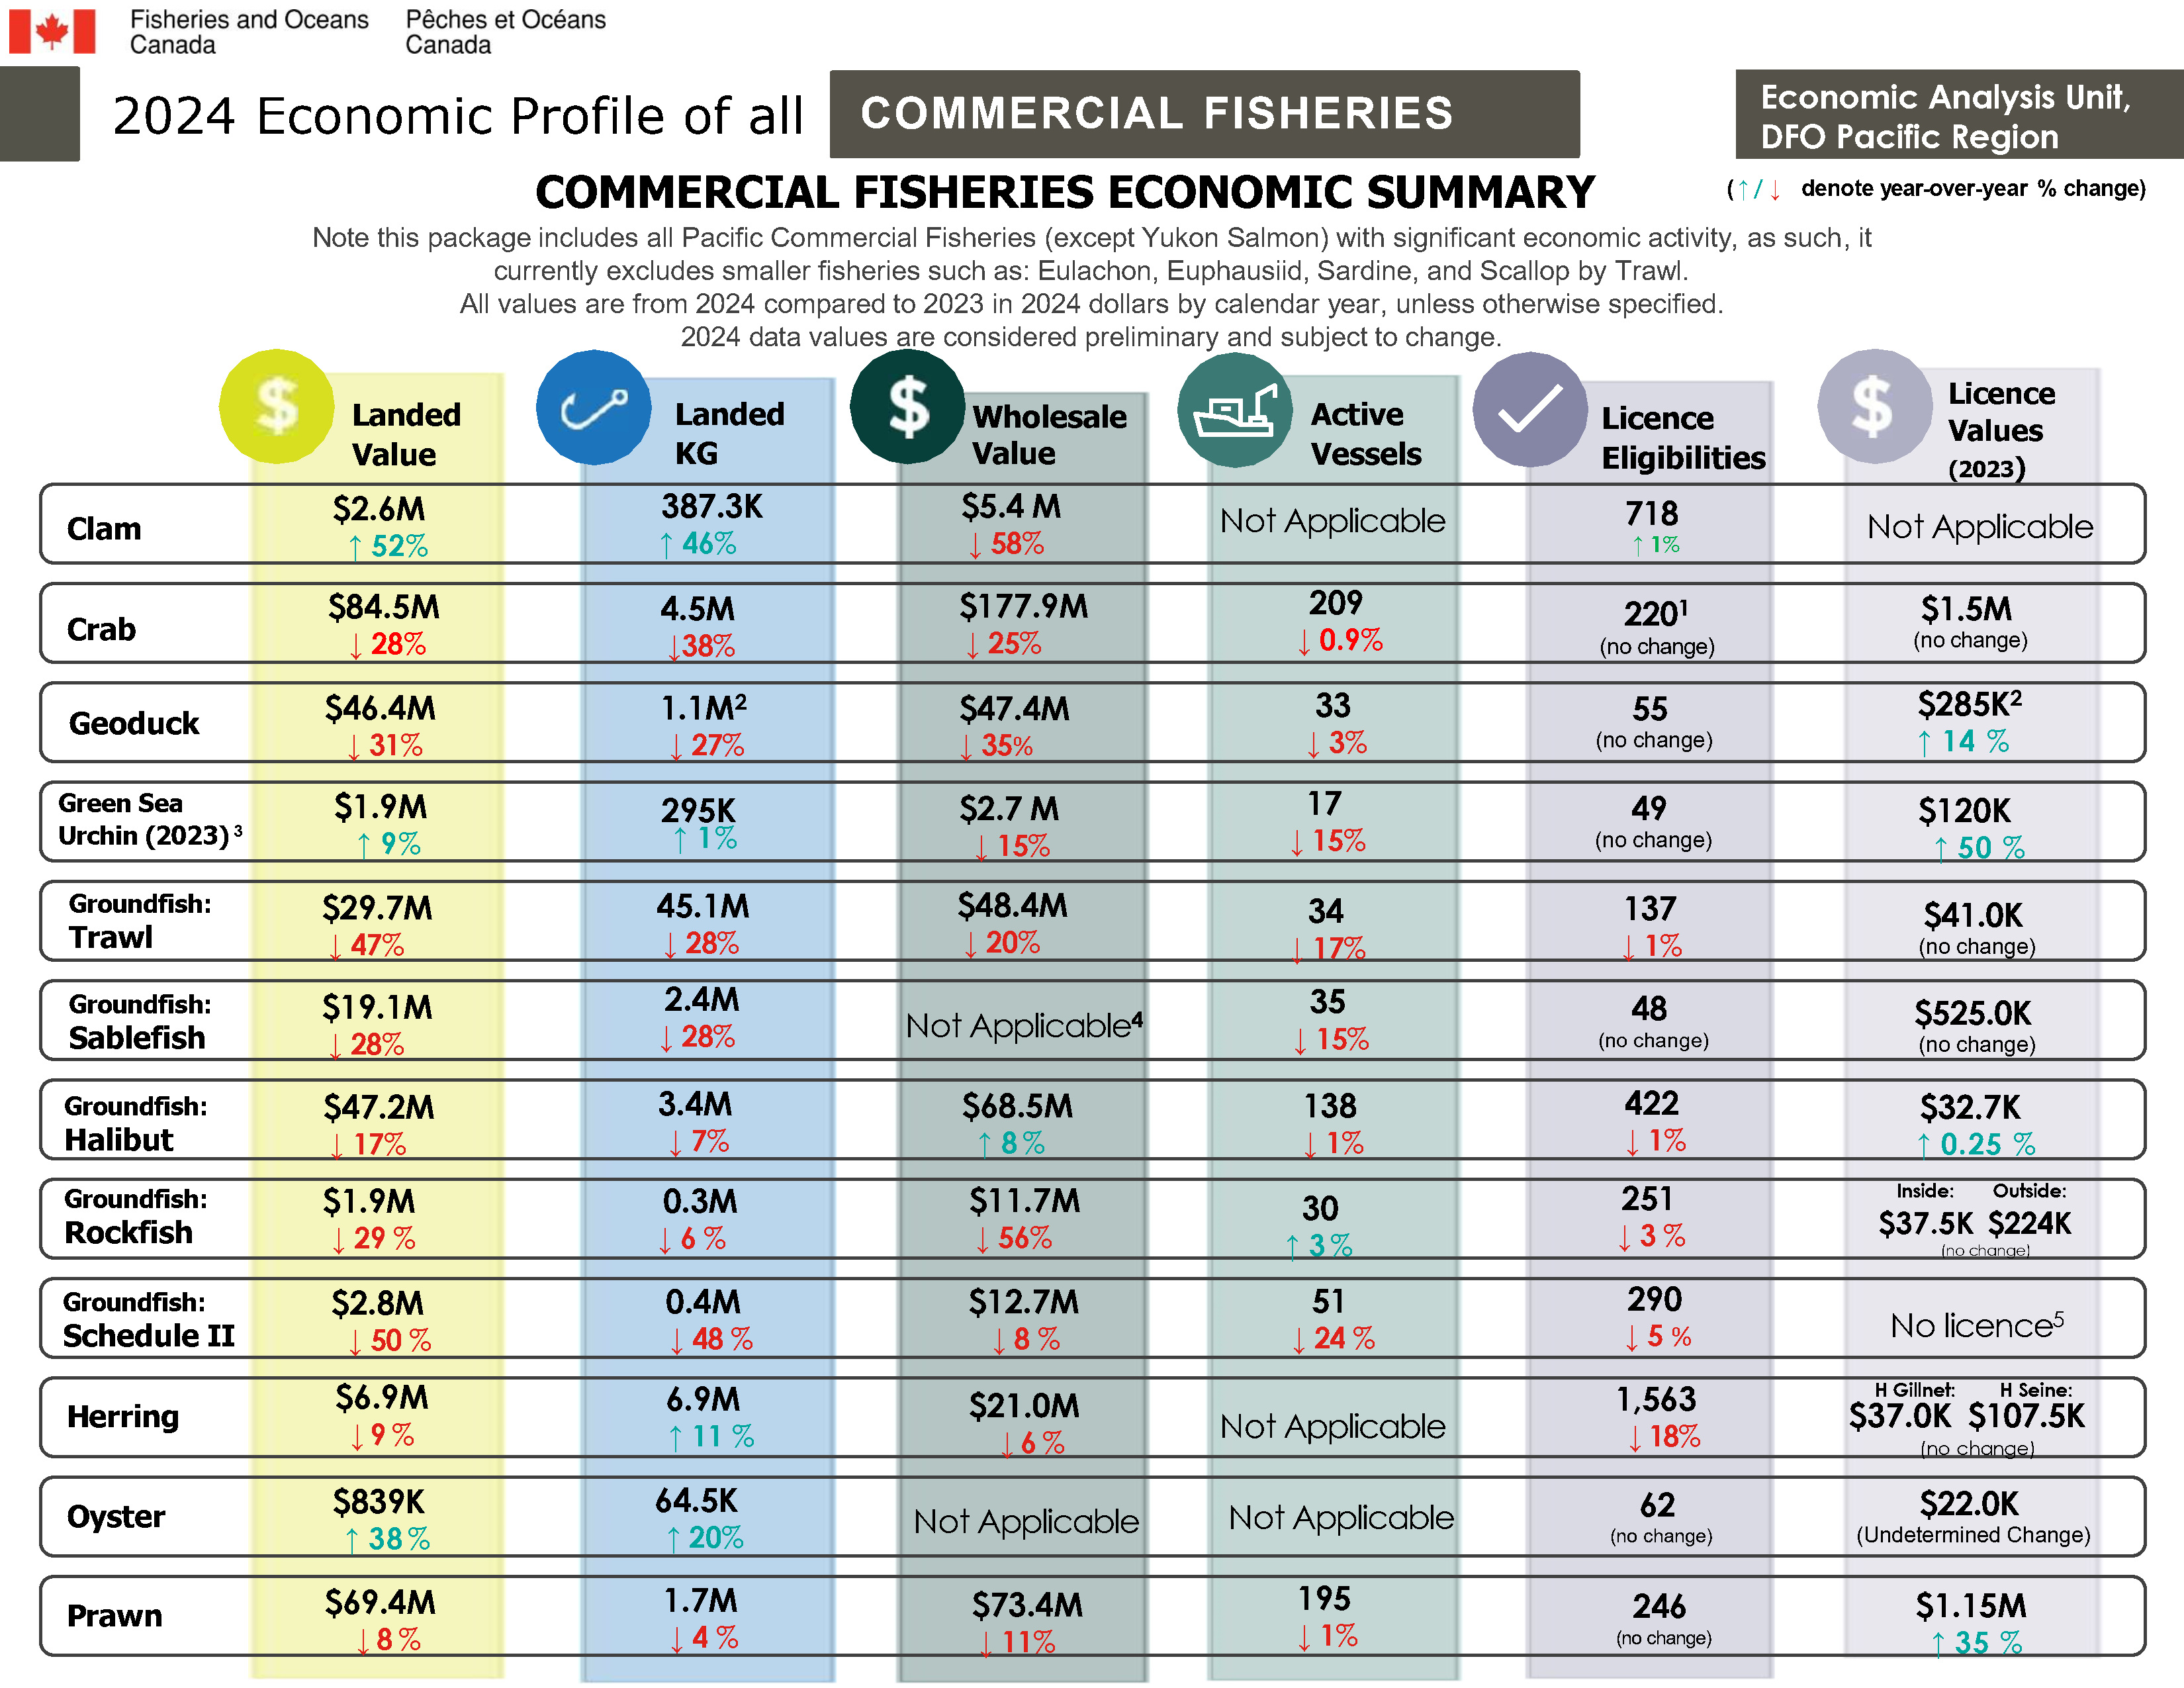
Commercial fisheries economic summary
Note this package includes all Pacific Commercial Fisheries with significant economic activity, as such, it currently excludes smaller fisheries such as: Eulachon, Euphausiid, Sardine, and Scallop by Trawl.
All values are from 2024 compared to 2023 in 2024-dollars by calendar year, unless otherwise specified.
2024 data and dollar values are considered preliminary and subject to change.
Up and down arrows denote year-over-year percentage change.
Key commercial fisheries summary table:
Clam
- Landed value: $2.6M (increased by 52% since 2023)
- Landed KG: 387.3K KG (increased by 46% since 2023)
- Wholesale value: $5.4M (decreased by 58% since 2023)
- Active vessels: not applicable
- Licence eligibilities: 718 (increased by 1% since 2023). This total excludes retired licences which are still within DFO’s inventory.
- Licence values (2023$): Not applicable
Crab
- Landed value: $84.5M (decreased by 28% since 2023)
- Landed KG: 4.5M KG (decreased by 38% since 2023)
- Wholesale value: $177.9M (decreased by 25% since 2023)
- Active vessels: 209 (decreased by 0.9% since 2023)
- Licence eligibilities: 220 (no change since 2023)
Total eligible licences, some licences are not issued to mitigate for the 5N court decision. - Licence values (2023$): $1.5M (no change since 2022)
Geoduck
- Landed value: $46.4M (decreased by 31% since 2023)
- Landed KG: 1.1M KG (decreased by 27% since 2023)
- Wholesale value: $47.4M (decreased by 35% since 2023)
- Active vessels: 33 (decreased by 3% since 2023)
- Licence eligibilities: 55 (no change since 2023)
- Licence values (2023$): $285K (increased by 14% since 2022). Licence value is the value without quota which is generally considered more valuable at $925K a block.
Green sea urchin (values for this fishery are from 2023 compared to 2022 in 2024 dollars by calendar year)
- Landed value: $1.9M (increased by 9% since 2022)
- Landed KG: 295K (increased by 1% since 2022)
- Wholesale value: $2.7M (decreased by 15% since 2022)
- Active vessels: 17 (decreased by 15% since 2022)
- Licence eligibilities: 49 (no change since 2022)
- Licence values (2023$): $120K (increased by 50% since 2022)
Groundfish: trawl
- Landed value: $29.7M (decreased by 47% since 2023)
- Landed KG: 45.1M KG (decreased by 28% since 2023)
- Wholesale value: $48.4M (decreased by 20% since 2023)
- Active vessels: 34 (decreased by 17% since 2023)
- Licence eligibilities: 137 (decreased by 1% since 2023)
- Licence values (2023$): $41.0K (no change since 2022)
Groundfish: sablefish
- Landed value: $19.1M (decreased by 28% since 2023)
- Landed KG: 2.4M KG (decreased by 28% since 2023)
- Wholesale value: not applicable due to incomplete data
- Active vessels: 35 (decreased by 15% since 2023)
- Licence eligibilities: 48 (no change since 2023)
- Licence values (2023$): $525.0K (no change since 2022)
Groundfish: halibut
- Landed value: $47.2M (decreased by 17% since 2023)
- Landed KG: 3.4M KG (decreased by 7% since 2023)
- Wholesale value: $68.5M (increased by 8% since 2023)
- Active vessels: 138 (decreased by 1% since 2023)
- Licence eligibilities: 422 (decreased by 1% since 2023)
- Licence values (2023$): $32.7K (increased by 0.25% since 2022)
Groundfish: rockfish
- Landed value: $1.9M (decreased by 29% since 2023)
- Landed KG: 0.3M KG (decreased by 6% since 2023)
- Wholesale value: $11.7M (decreased by 56% since 2023)
- Active vessels: 30 (increased by 3% since 2023)
- Licence eligibilities: 251 (decreased by 3% since 2023)
- Licence values (2023$): inside: $37.5K. Outside: $224K (no change since 2022)
Groundfish: schedule II
- Landed value: $2.8M (decreased by 50% since 2023)
- Landed KG: 0.4M KG (decreased by 48% since 2023)
- Wholesale value: $12.7M (decreased by 8% since 2023)
- Active vessels: 51 (decreased by 24% since 2023)
- Licence eligibilities: 290 (decreased by 5% since 2023)
- Licence values: no licence. Schedule II is managed by quota
Herring
- Landed value: $6.9M (decreased by 9% since 2023)
- Landed KG: 6.9M KG (increased by 11% since 2023)
- Wholesale value: $21.0M (decreased by 6% since 2023)
- Active vessels: not applicable
- Licence eligibilities: 1,563 (decreased by 18% since 2023)
- Licence values (2023$): Herring gillnet: $37.0K. Herring seine: $107.5K (no change since 2022)
Oyster
- Landed value: $839K (increased by 38% since 2023)
- Landed KG: 64.5K KG (increased by 20% since 2023)
- Wholesale value: not applicable
- Active vessels: not applicable
- Licence eligibilities: 62 (no change since 2023)
- Licence values (2023$): $22.0K (undetermined change)
Prawn
- Landed value: $69.4 (decreased by 8% since 2023)
- Landed KG: 1.7M KG (decreased by 4% since 2023)
- Wholesale value: $73.4M (decreased by 11% since 2023)
- Active vessels: 195 (decreased by 1% since 2023)
- Licence eligibilities: 246 (no change since 2023)
- Licence values (2023$): $1.15M (increased by 35% since 2022)
Long text version
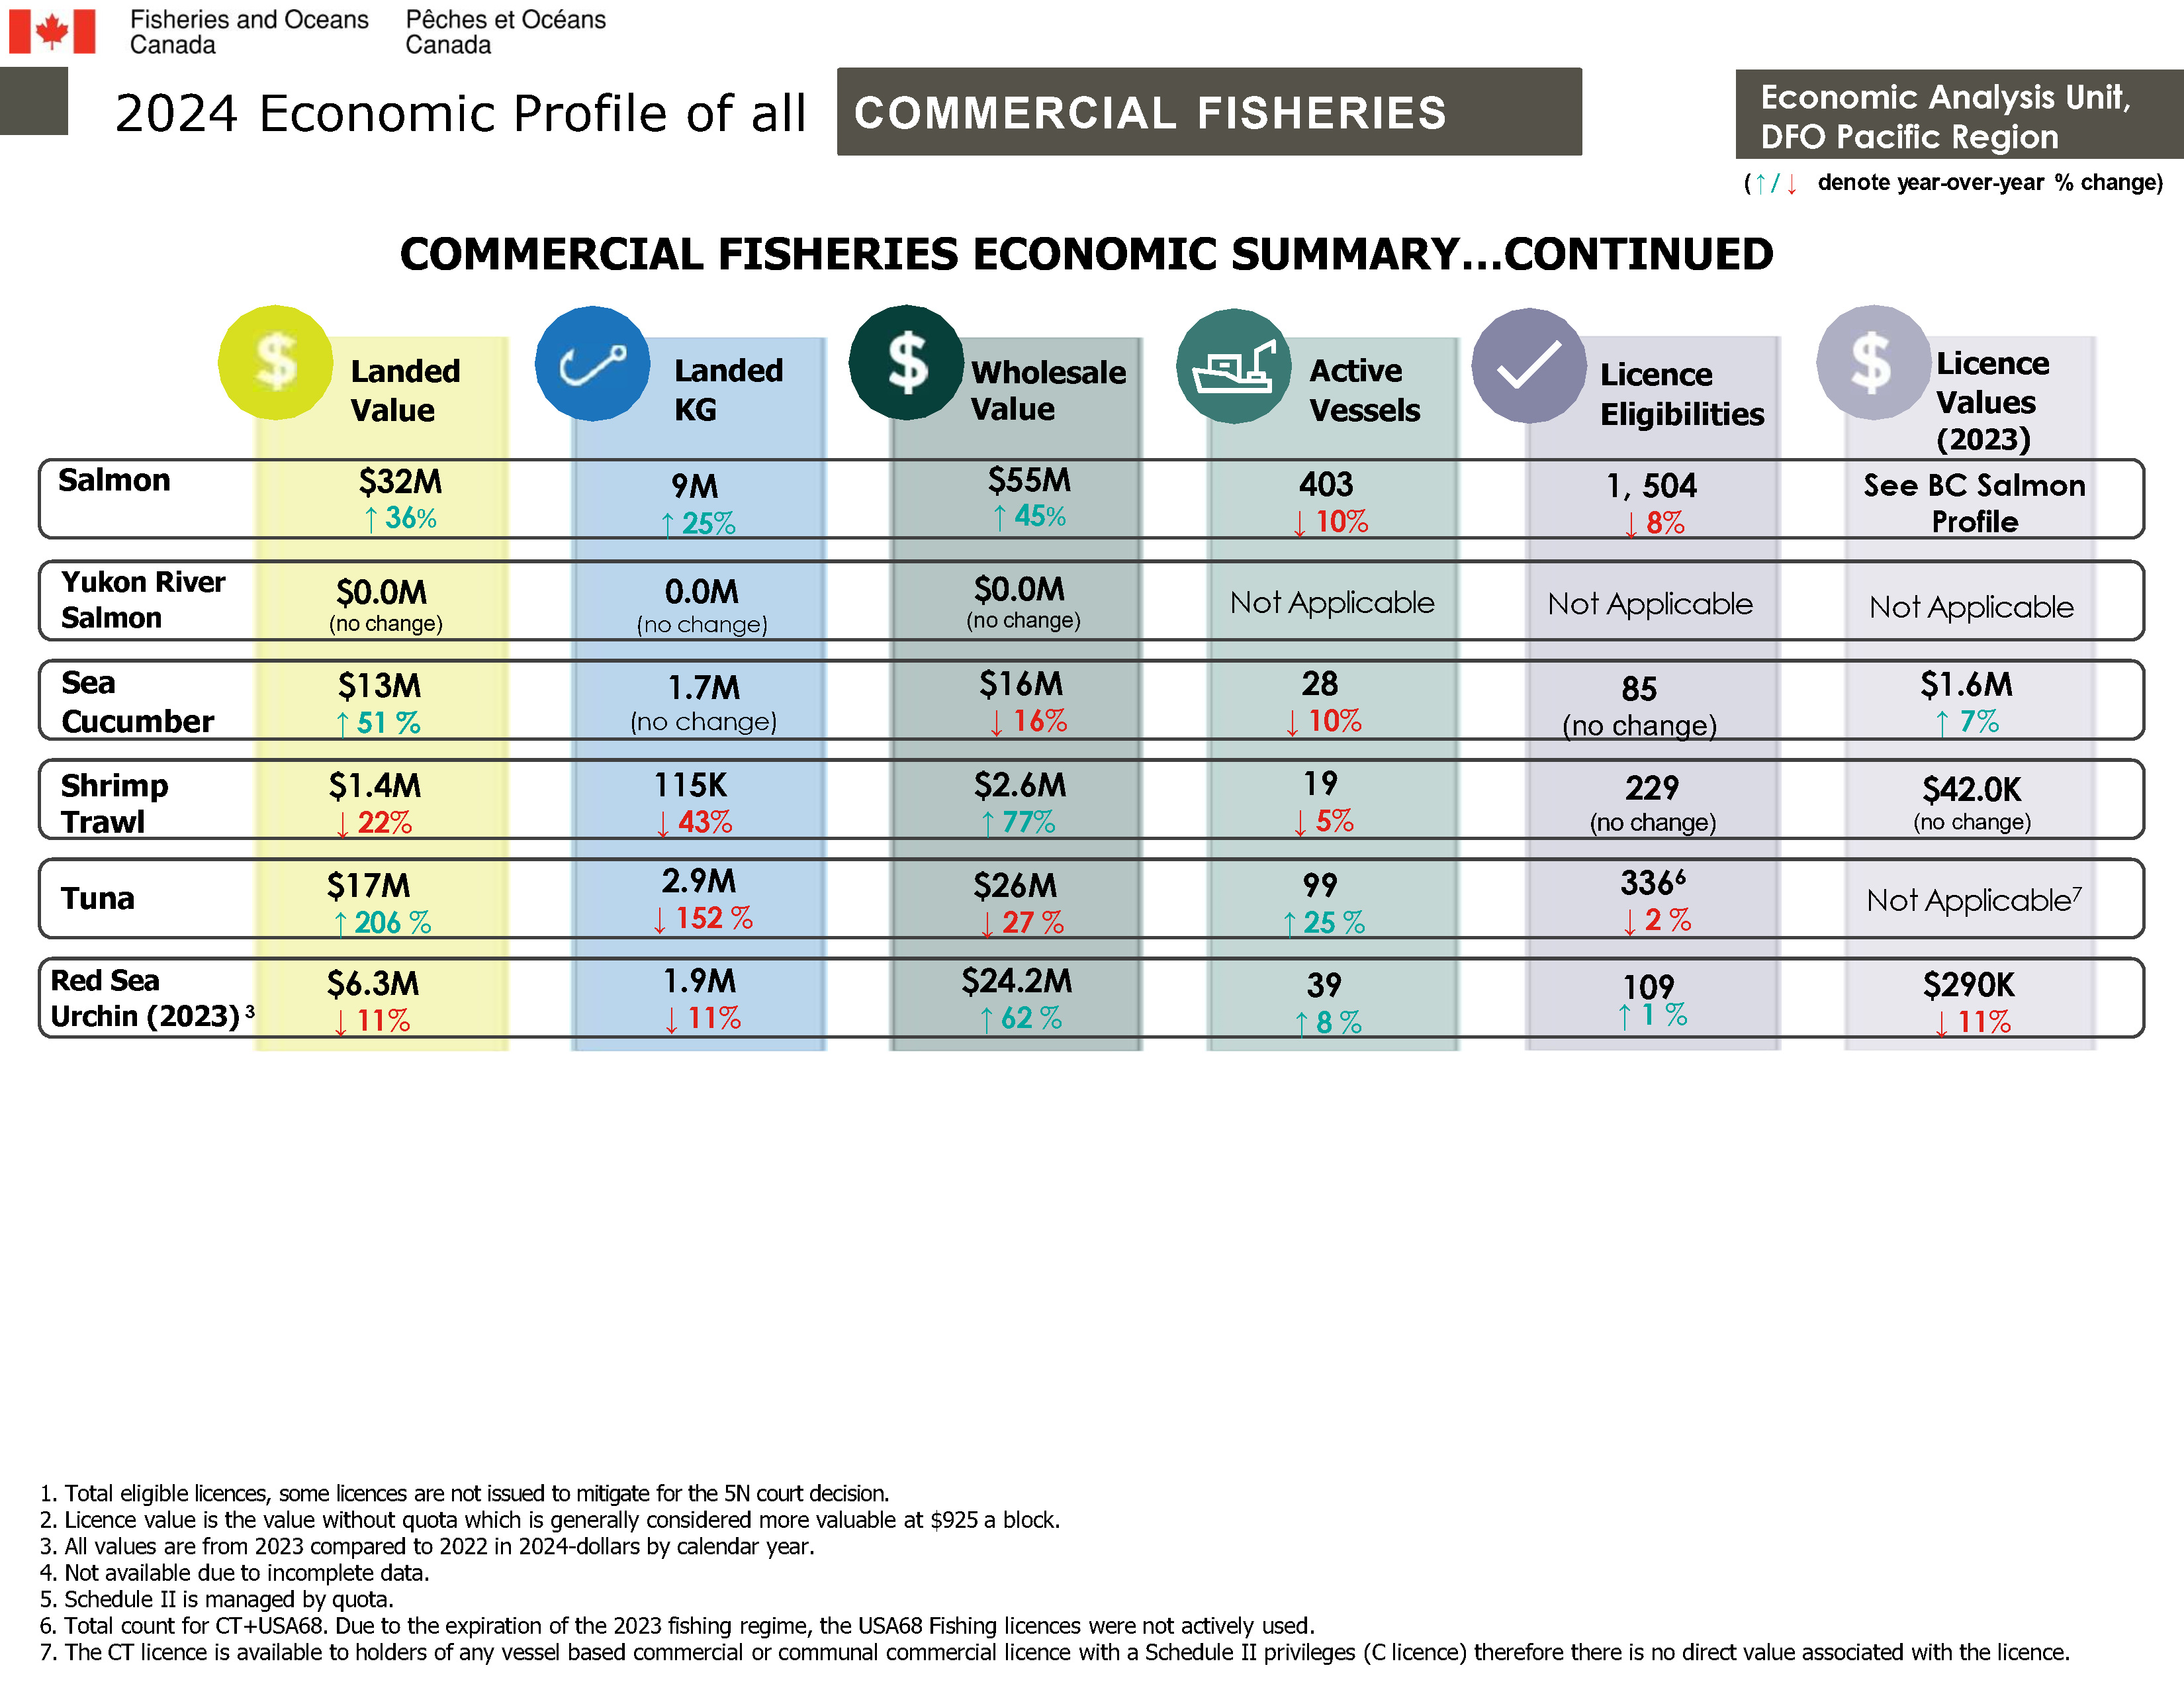
Commercial fisheries economic summary…continued
Salmon
- Landed value: $32.0M (increased by 36% since 2022)
- Landed KG: 9.0M KG (increased by 25% since 2022)
- Wholesale value: $55M (increased by 45% since 2022
- Active vessels: 403 (decreased by 10% since 2022)
- Licence eligibilities: 1,504 (decreased by 8% since 2022)
- Licence values: see BC salmon profile
Yukon river salmon
- Landed value: $0.0M (no change since 2022)
- Landed KG: 0.0M KG (no change since 2022)
- Wholesale value: $0.0M (no change since 2022)
- Active vessels: not applicable
- Licence eligibilities: not applicable
- Licence values: not applicable
Sea cucumber
- Landed value: $13M (increased by 51% since 2023)
- Landed KG: 1.7M KG (no change since 2023)
- Wholesale value: $16M (decreased by 16% since 2023)
- Active vessels: 28 (decreased by 10% since 2023)
- Licence eligibilities: 85 (no change since 2023)
- Licence values (2023$): $1.6M (increased by 7% since 2022)
Shrimp trawl
- Landed value: $1.4M (decreased by 22% since 2023)
- Landed KG: 115K (decreased by 43% since 2023)
- Wholesale value: $2.6M (increased by 77% since 2023)
- Active vessels: 19 (decreased by 5% since 2023)
- Licence eligibilities: 229 (no change since 2023)
- Licence values (2023$): $42.0K (no change since 2022)
Tuna
- Landed value: $17M (increased by 206% since 2023)
- Landed KG: 2.9M KG (decreased by 152% since 2023)
- Wholesale value: $26M (decreased by 27% since 2023)
- Active vessels: 99 (increased by 25% since 2023)
- Licence eligibilities: 336 (decreased by 2% since 2023); total count for CT+USA68. Due to the expiration of the 2023 fishing regime, the USA68 Fishing licences were not actively used.
- Licence values (2023$): not applicable. The CT licence is available to holders of any vessel based commercial or communal commercial licence with a schedule II privileges (C licence) therefore there is no direct value associated with the licence.
Red sea urchin (all values are from 2023 compared to 2022 in 2024-dollars by calendar year)
- Landed value: $6.3M (decreased by 11% since 2022)
- Landed KG: 1.9M KG (decreased by 11% since 2022)
- Wholesale value: $24.2M (increased by 62% since 2022)
- Active vessels: 39 (increased by 8% since 2022)
- Licence eligibilities: 109 (increased by 1% since 2022)
- Licence values (2023$): $290K (decreased by 11% since 2022)
Long text version
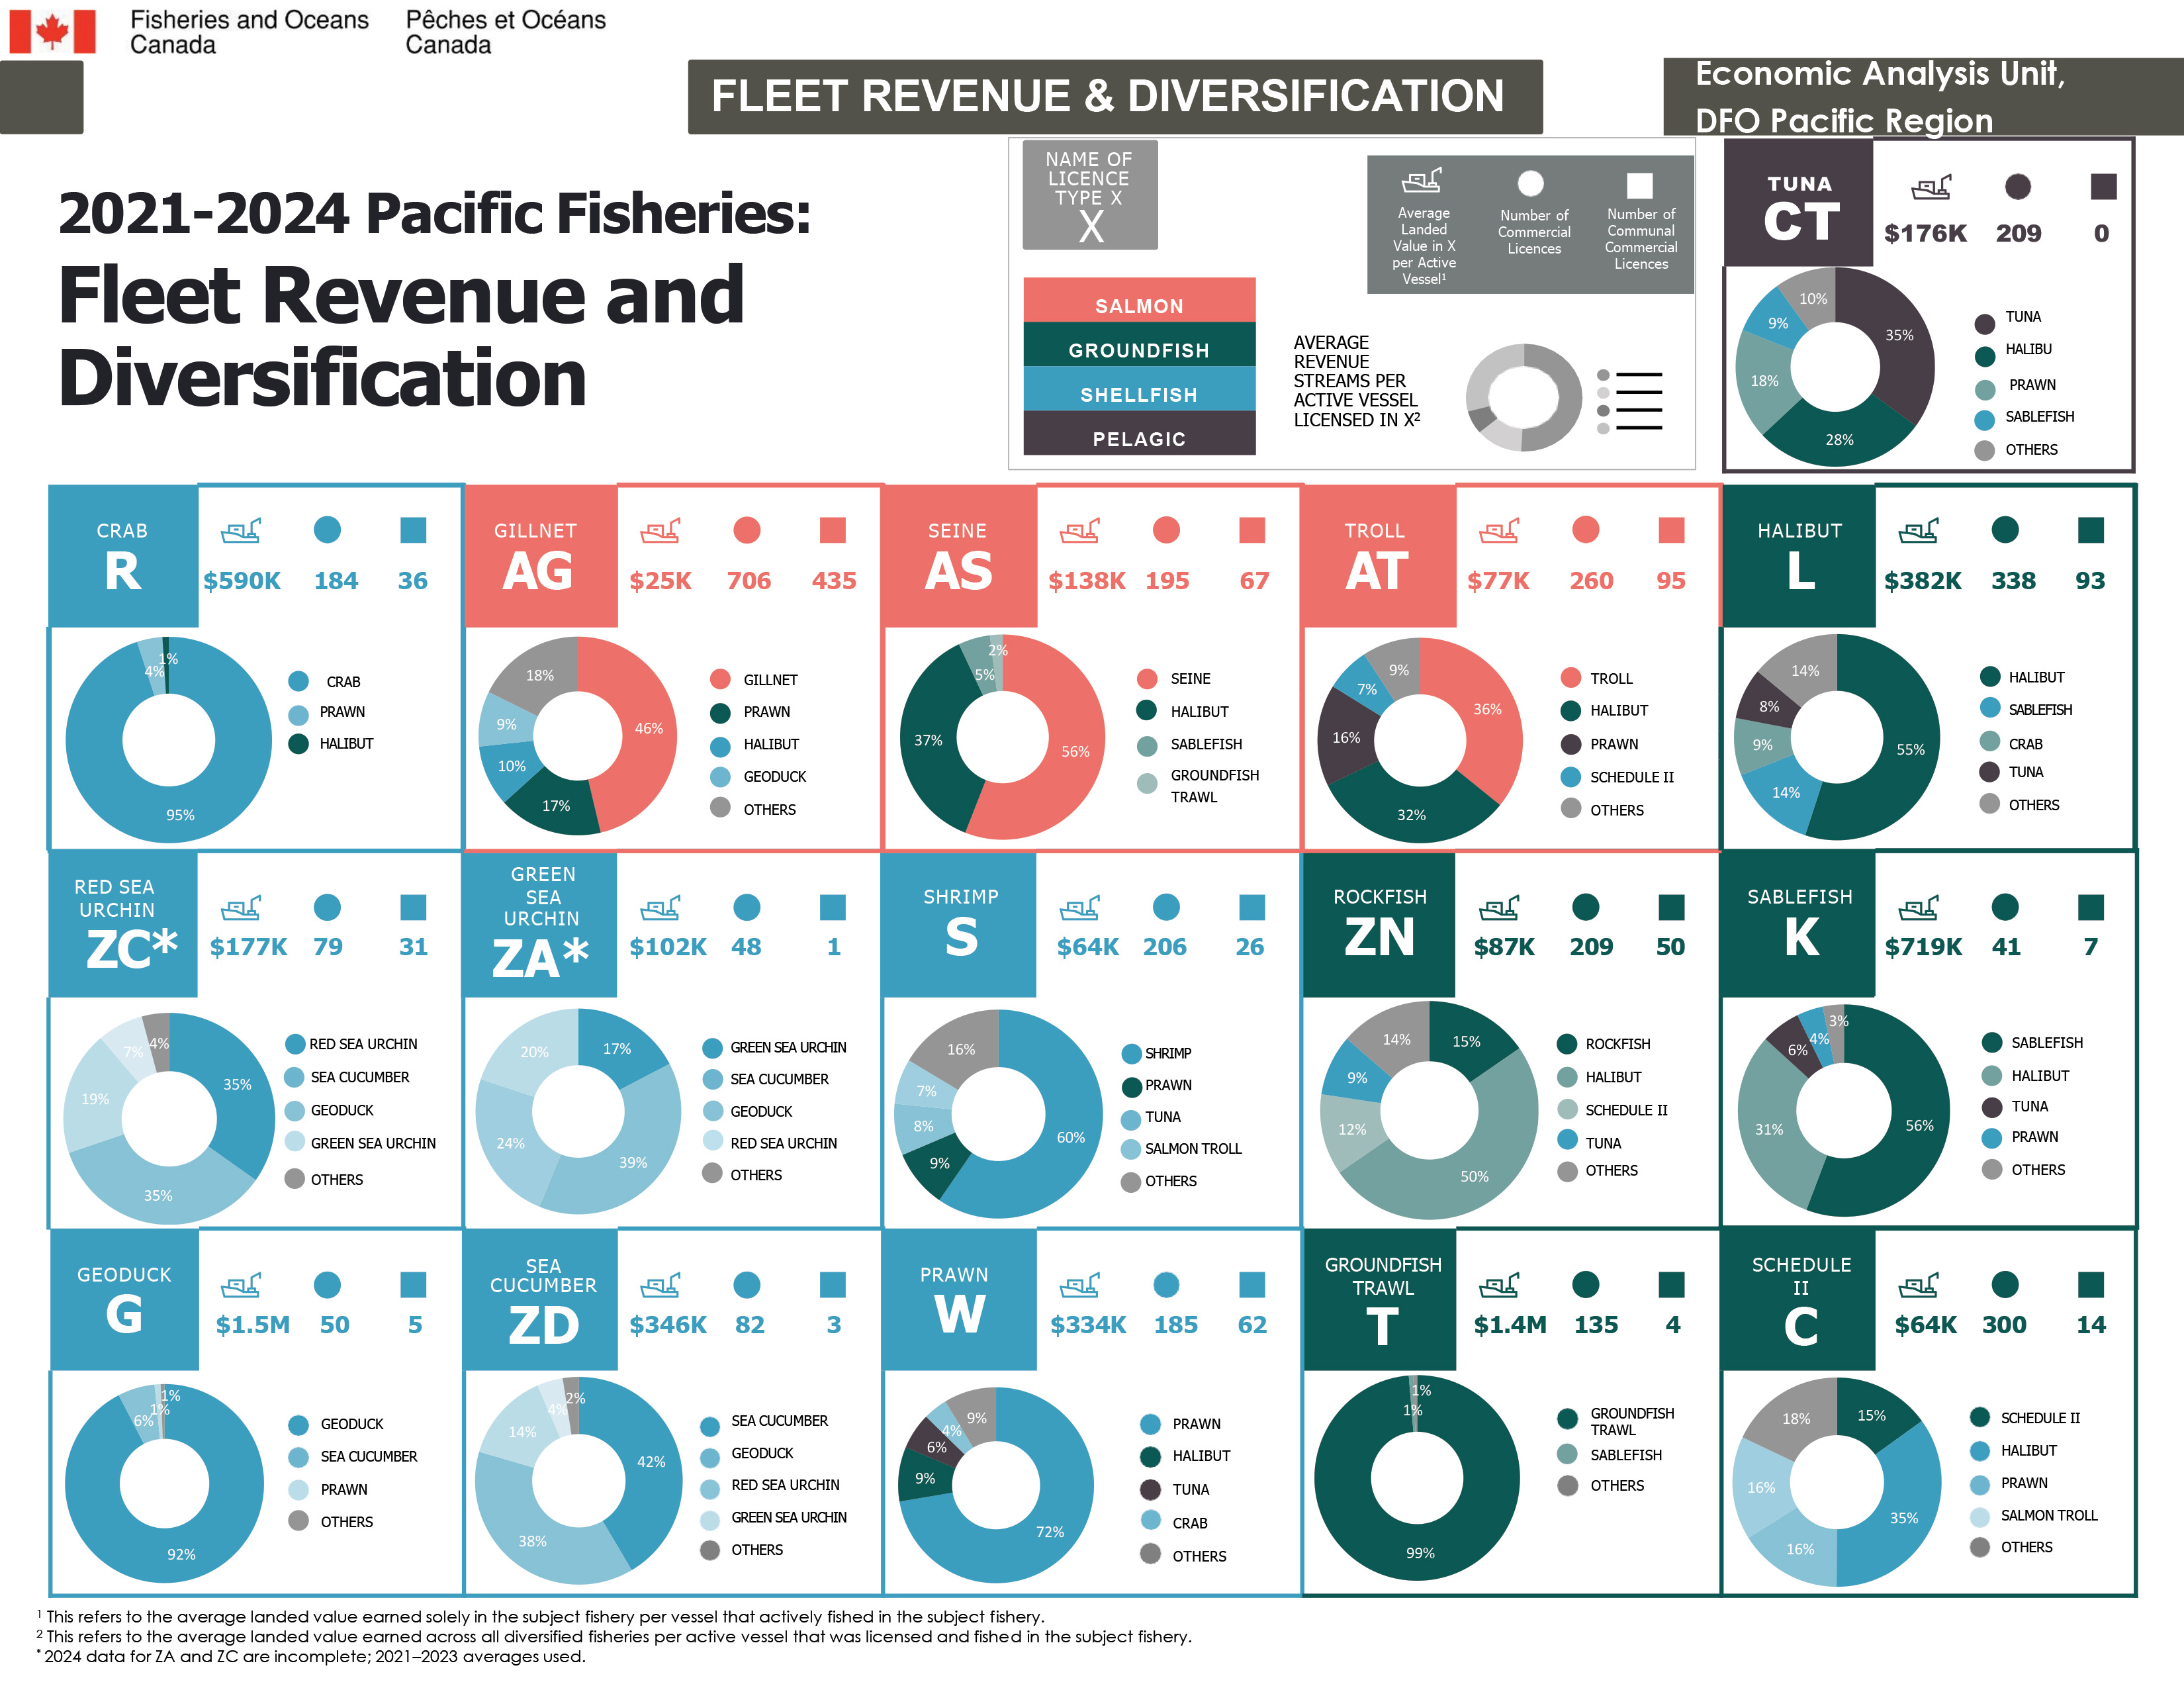
Fleet revenue and diversification
2021-2024 Pacific fisheries: fleet tevenue and diversification
All information is based on an average of four calendar years (2021-2024), with dollar values expressed in 2024 dollars unless otherwise specified.
Average landed value in per active vessel refers to the average landed value earned solely in the subject fishery per vessel that actively fished in the subject fishery.
Average revenue streams per active vessel licenced in a fishery refers to the average landed value earned across all diversified fisheries per active vessel that was licensed and fished in the subject fishery.
Pelagic
Tuna - licence prefix CT
- Average landed value per active vessel: $176,000
- Number of commercial licences: 209
- Number of communal commercial licences: 0
- Average revenue streams:
- Tuna: 35%
- Halibut: 28%
- Sablefish: 18%
- Prawn: 9%
- Others: 10%
Shellfish
Crab - licence prefix R
- Average landed value per active vessel: $590,000
- Number of commercial licences: 184
- Number of communal commercial licences: 36
- Average revenue streams:
- Crab: 95%
- Prawn: 4%
- Halibut: 1%
Red sea urchin - licence prefix ZC. 2024 data for ZC are incomplete; 2021–2023 averages are used
- Average landed value per active vessel: $177,000
- Number of commercial licences: 79
- Number of communal commercial licences: 31
- Average revenue streams:
- Red sea urchin: 35%
- Sea cucumber: 35%
- Geoduck: 19%
- Green sea urchin: 7%
- Others: 4%
Green sea urchin - licence prefix ZA (2024 data for ZA and ZC are incomplete; 2021–2023 averages used)
- Average landed value per active vessel: $102,000
- Number of commercial licences: 48
- Number of communal commercial licences: 1
- Average revenue streams:
- Green sea urchin: 17%
- Sea cucumber: 39%
- Geoduck: 24%
- Red sea urchin: 20%
Shrimp - licence prefix S
- Average landed value per active vessel: $64,000
- Number of commercial licences: 206
- Number of communal commercial licences: 26
- Average revenue streams:
- Shrimp: 60%
- Prawn: 9%
- Tuna: 8%
- Salmon Troll: 7%
- Others: 16%
Geoduck - licence prefix G
- Average landed value per active vessel: $1.5M
- Number of commercial licences: 50
- Number of communal commercial licences: 5
- Average revenue streams:
- Geoduck: 92%
- Sea cucumber: 6%
- Prawn: 1%
- Others: 1%
Sea cucumber - licence prefix ZD
- Average landed value per active vessel: $346,000
- Number of commercial licences: 82
- Number of communal commercial licences: 3
- Average revenue streams:
- Sea cucumber: 42%
- Geoduck: 38%
- Red sea urchin: 14%
- Green sea urchin: 4%
- Others: 2%
Prawn - licence prefix W
- Average landed value per active vessel: $334,000
- Number of commercial licences: 185
- Number of communal commercial licences: 62
- Average revenue streams:
- Prawn: 72%
- Halibut: 9%
- Tuna: 6%
- Crab: 4%
- Others: 9%
Salmon
Gillnet - licence prefix AG
- Average landed value per active vessel: $25,000
- Number of commercial licences: 706
- Number of communal commercial licences: 435
- Average revenue streams:
- Gillnet: 46%
- Prawn: 17%
- Halibut: 10%
- Geoduck: 9%
- Others: 18%
Seine - licence prefix AS
- Average landed value per active vessel: $138,000
- Number of commercial licences: 195
- Number of communal commercial licences: 67
- Average revenue streams:
- Seine: 56%
- Halibut: 37%
- Sablefish: 5%
- Groundfish trawl: 2%
Troll - licence prefix AT
- Average landed value per active vessel: $77,000
- Number of commercial licences: 260
- Number of communal commercial licences: 95
- Average revenue streams:
- Troll: 36%
- Halibut: 32%
- Prawn: 16%
- Schedule II: 7%
- Others: 9%
Groundfish
Halibut - licence prefix L
- Average landed value per active vessel: $382,000
- Number of commercial licences: 338
- Number of communal commercial licences: 93
- Average revenue streams:
- Halibut: 55%
- Sablefish: 14%
- Crab: 9%
- Tuna: 8%
- Others: 14%
Rockfish - licence prefix ZN
- Average landed value per active vessel: $87,000
- Number of commercial licences: 209
- Number of communal commercial licences: 50
- Average revenue streams:
- Rockfish: 15%
- Halibut: 50%
- Schedule II: 12%
- Tuna: 9%
- Others: 14%
Sablefish - licence prefix K
- Average landed value per active vessel: $719,000
- Number of commercial licences: 41
- Number of communal commercial licences: 7
- Average revenue streams:
- Sablefish: 56%
- Halibut: 31%
- Tuna: 6%
- Prawn: 4%
- Others: 3%
Groundfish trawl - licence prefix T
- Average landed value per active vessel: $1.4M
- Number of commercial licences: 135
- Number of communal commercial licences: 4
- Average revenue streams:
- Groundfish trawl: 99%
- Sablefish: 1%
- Others: 1%
Schedule II - licence prefix C
- Average landed value per active vessel: $64,000
- Number of commercial licences: 300
- Number of communal commercial licences: 14
- Average revenue streams:
- Schedule II: 5%
- Halibut: 35%
- Prawn: 16%
- Salmon Troll: 16%
- Others: 18%
Long text version
2024 economic profile of BC commercial licence holders
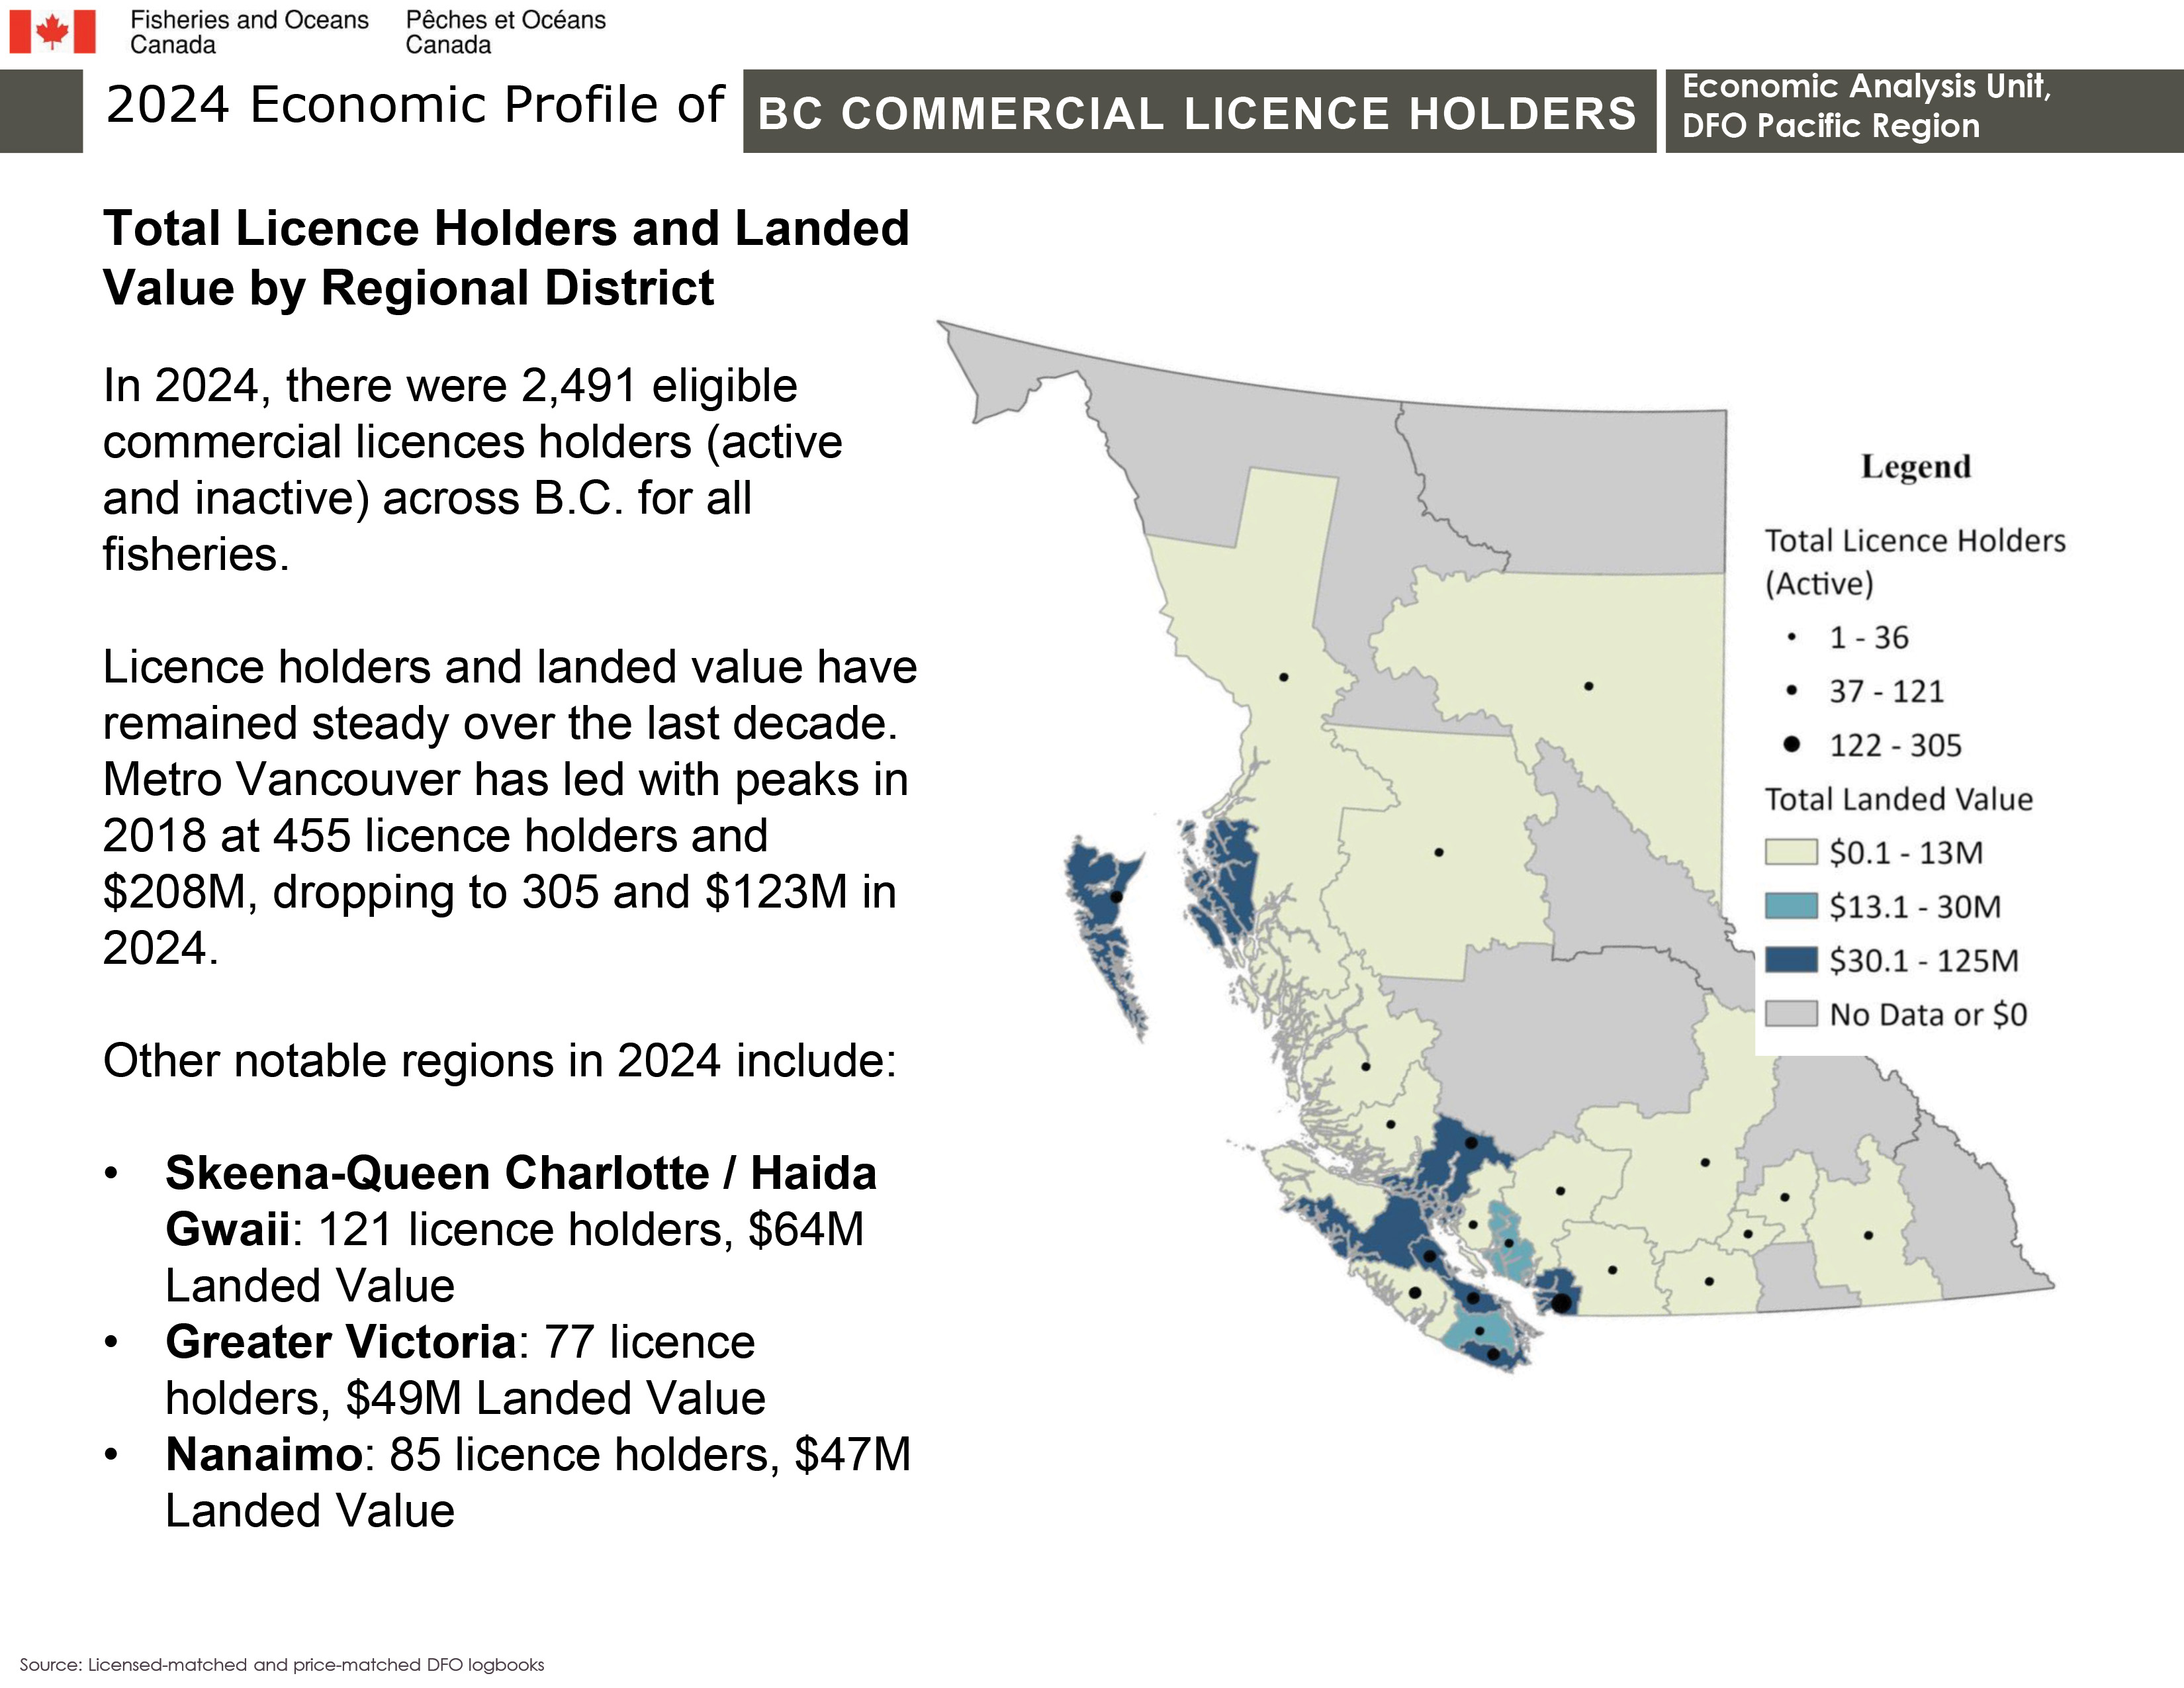
Total licence holders and landed value by regional district in 2024
In 2024, there were 2,491 eligible commercial licences holders (active and inactive) across B.C. for all fisheries.
Licence holders and landed value have remained steady over the last decade. Metro Vancouver has led with peaks in 2018 at 455 licence holders and $208M, dropping to 305 and $123M in 2024.
Other notable regions in 2024 include:
- Skeena-Queen Charlotte / Haida Gwaii: 121 licence holders, $64M landed value
- Greater Victoria: 77 licence holders, $49M landed value
- Nanaimo: 85 licence holders, $47 landed value
Total landed value collectively earned by active licence holders in the identified regions
| Regional district | Active license holders | Landed value (2024 $) |
|---|---|---|
| Alberni-Clayoquot | 37 – 121 | $0.1 – $13M |
| Bulkley-Nechako | 1 – 36 | $0.1 – $13M |
| Capital | 37 – 121 | $30.1 – $125M |
| Central Coast | 1 – 36 | $0.1 – $13M |
| Central Kootenay | 1 – 36 | $0.1 – $13M |
| Central Okanagan | 1 – 36 | $0.1 – $13M |
| Comox Valley | 37 – 121 | $30.1 – $125M |
| Cowichan Valley | 1 – 36 | $0.1 – $13M |
| Fraser Valley | 1 – 36 | $0.1 – $13M |
| Kitimat-Stikine | 1 – 36 | $0.1 – $13M |
| Metro Vancouver | 122 – 305 | $30.1 – $125M |
| Mount Waddington | 1 – 36 | $0.1 – $13M |
| Nanaimo | 37 – 121 | $30.1 – $125M |
| North Coast | 37 – 121 | $30.1 – $125M |
| North Okanagan | 1 – 36 | $0.1 – $13M |
| Okanagan-Similkameen | 1 – 36 | $0.1 – $13M |
| Peace River | 1 – 36 | $0.1 – $13M |
| Powell River | 1 – 36 | $0.1 – $13M |
| Squamish-Lillooet | 1 – 36 | $0.1 – $13M |
| Strathcona | 37 – 121 | $30.1 – $125M |
| Sunshine Coast | 1 – 36 | $13.1 – $30M |
| Thompson-Nicola | 1 – 36 | $0.1 – $13M |
Source: licensed-matched and price-matched DFO logbooks
Long text version
2024 economic profile of the Small Craft Harbours (SCH) in BC
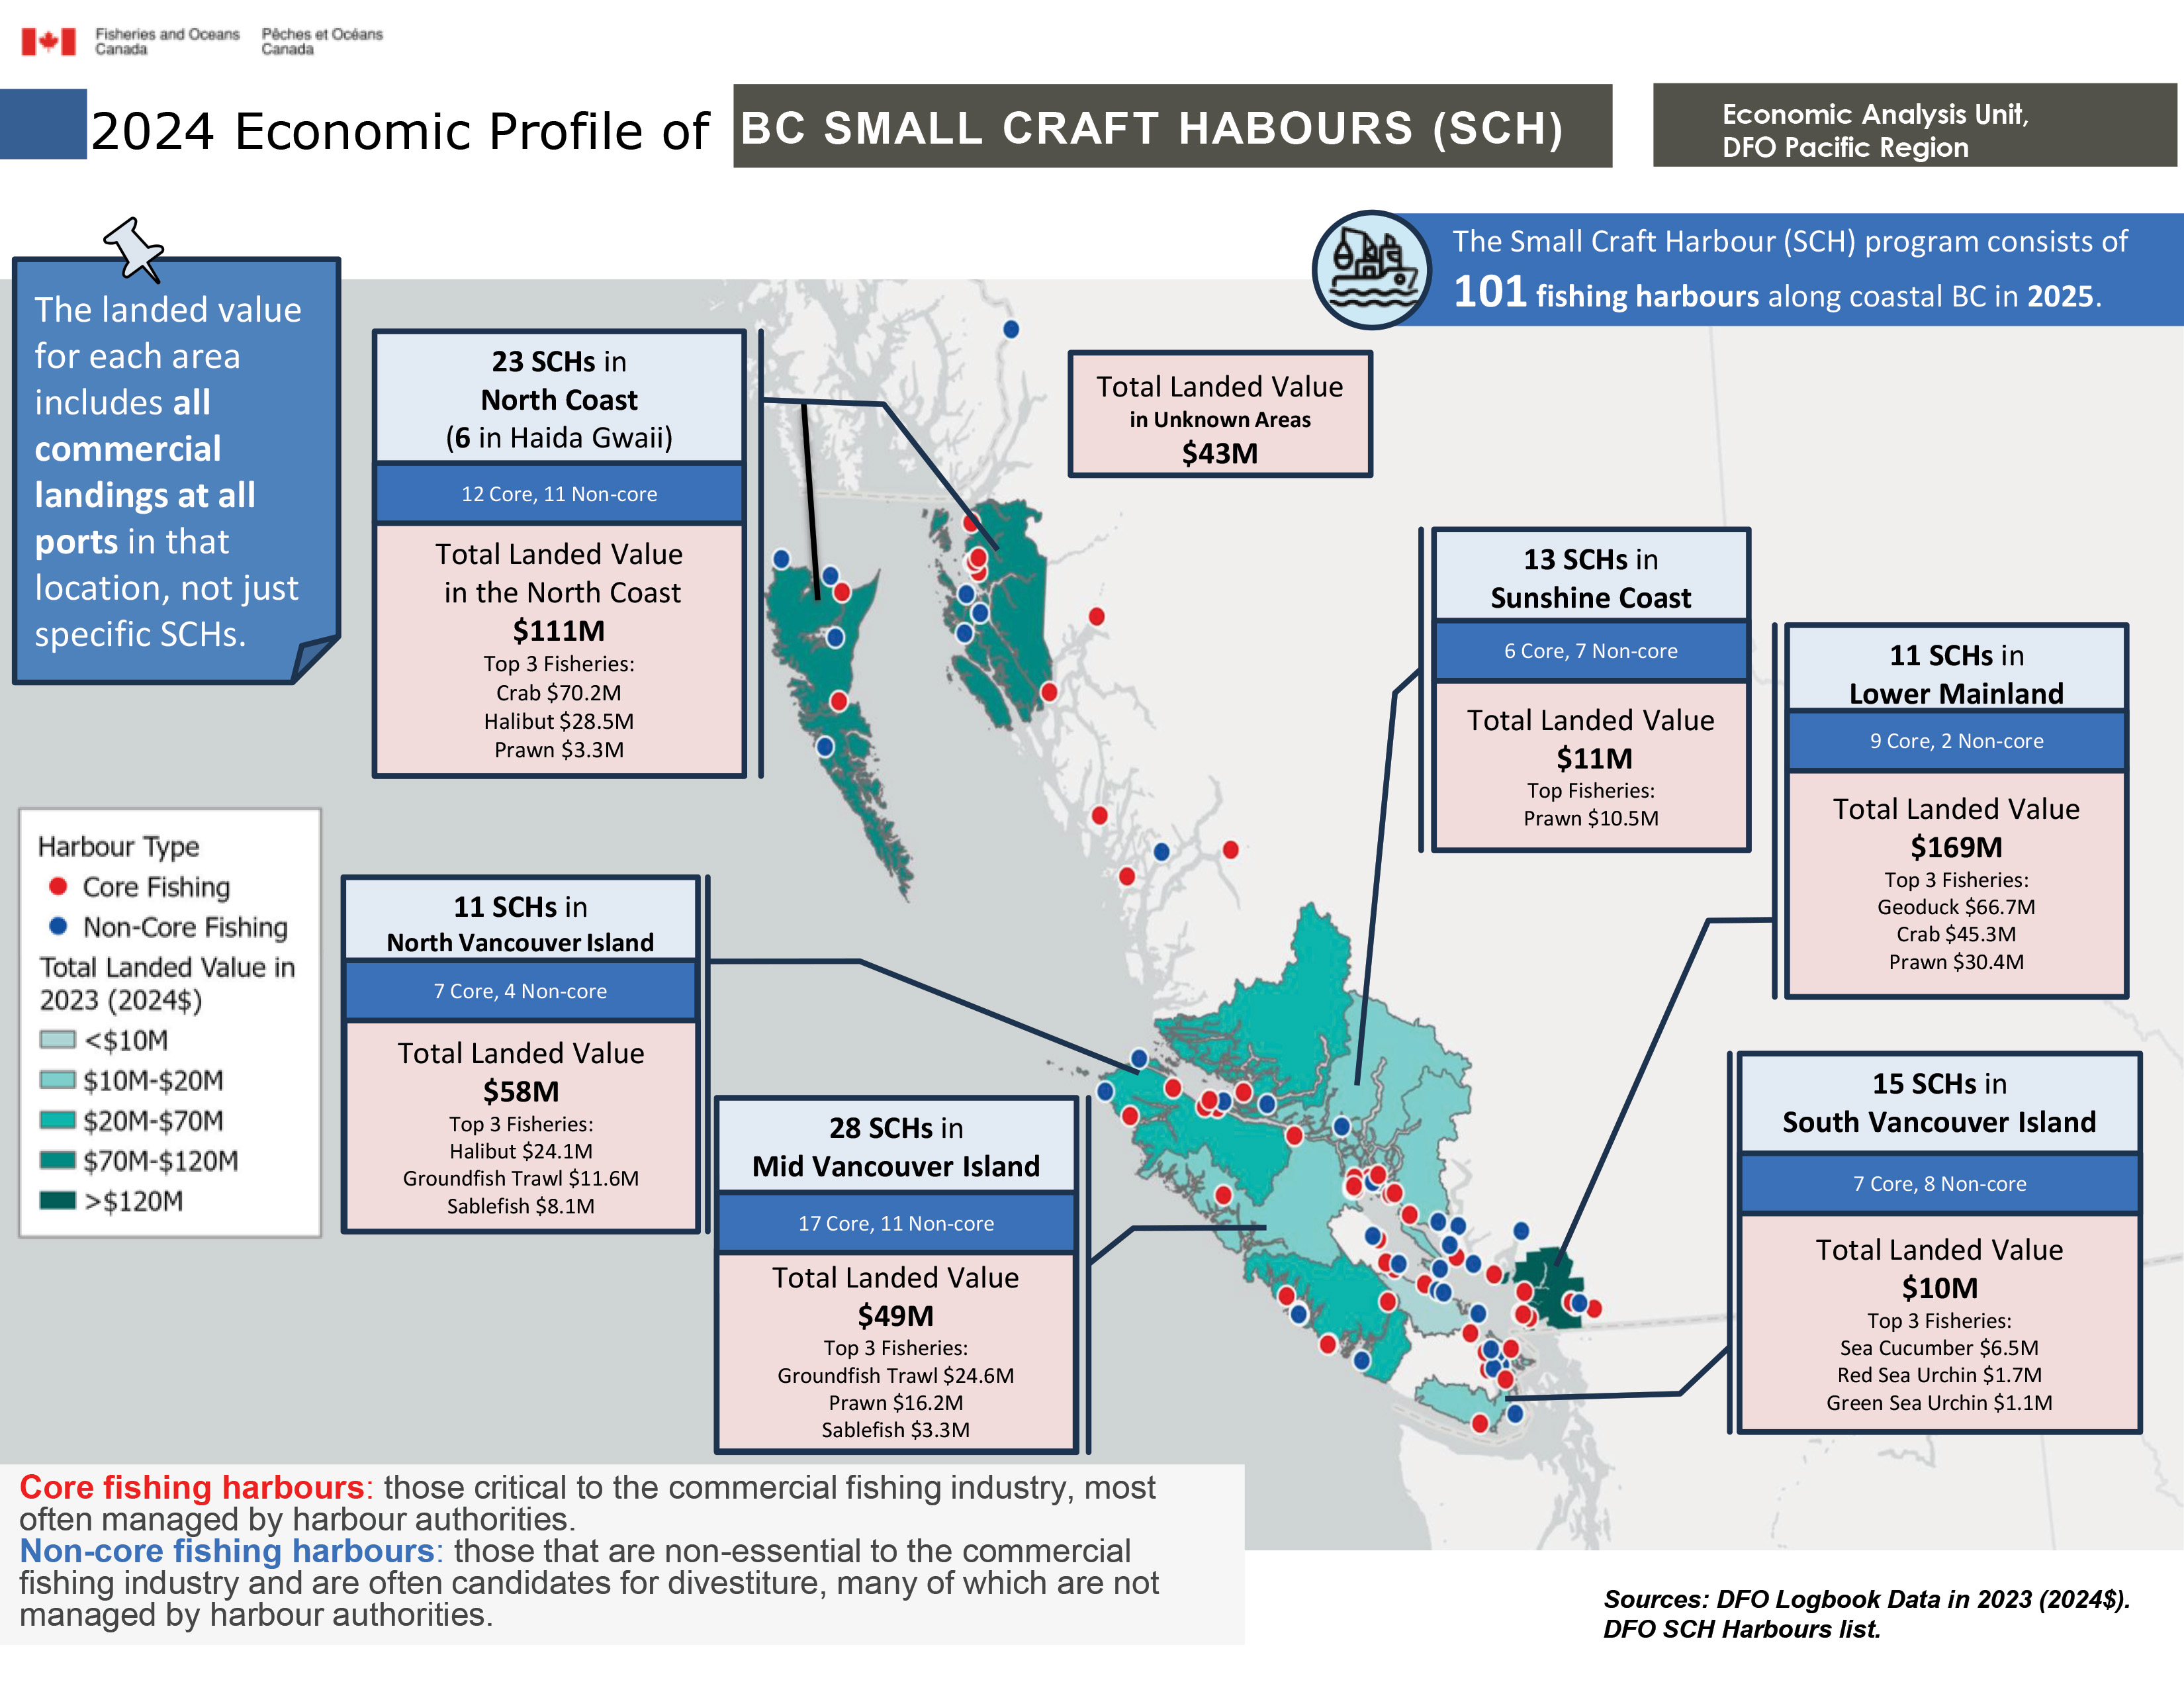
The Small Craft Harbour (SCH) program consists of 101 fishing harbours along coastal BC in 2025.
Regional landed value and harbour statistics
The landed value for each area includes all commercial landings at all ports in that location, not just specific SCHs.
Harbour type definitions
- Core fishing harbours: those critical to the commercial fishing industry, most often managed by harbour authorities.
- Non-core fishing harbours: those that are non-essential to the commercial fishing industry and are often candidates for divestiture, many of which are not managed by harbour authorities.
North Coast
- Count: 23 SCHs including 6 in Haida Gwaii (12 core, 11 non-core)
- Total landed value: $111M
- Top 3 fisheries:
- Crab: $70.2M
- Halibut: $28.5M
- Prawn: $3.3M
North Vancouver Island
- Count: 11 SCHs (7 core, 4 non-core)
- Total landed value: $58M
- Top 3 fisheries:
- Halibut: $24.1M
- Groundfish trawl: $11.6M
- Sablefish: $8.1M
Mid Vancouver Island
- Count: 28 SCHs (17 core, 11 non-core)
- Total landed value: $49M
- Top 3 fisheries:
- Groundfish trawl: $24.6M
- Prawn: $16.2M
- Sablefish: $3.3M
Lower Mainland
- Count: 11 SCHs (9 core, 2 non-core)
- Total landed value: $169M
- Top 3 fisheries:
- Geoduck: $66.7M
- Crab: $45.3M
- Prawn: $30.4M
South Vancouver Island
- Count: 15 SCHs (7 core, 8 non-core)
- Total landed value: $10M
- Top 3 fisheries:
- Sea cucumber: $6.5M
- Red sea urchin: $1.7M
- Green sea urchin: $1.1M
Sunshine Coast
- Count: 13 SCHs (6 core, 7 non-core)
- Total landed value: $11M
- Top fishery: Prawn: $10.5M
Other totals
- Total landed value in unknown areas: $43M
Sources: DFO Logbook Data in 2023 (2024$); DFO SCH Harbours list.
- Date modified: