
Pacific wild fisheries processing, exports, supply and distribution
This profile provides an overview of the value chain of all Pacific commercial wild-capture fisheries, covering the processing sector, exports, and supply and distribution of BC Seafood.
Long text version
2024 Economic profile of BC wild seafood and fish processing sector
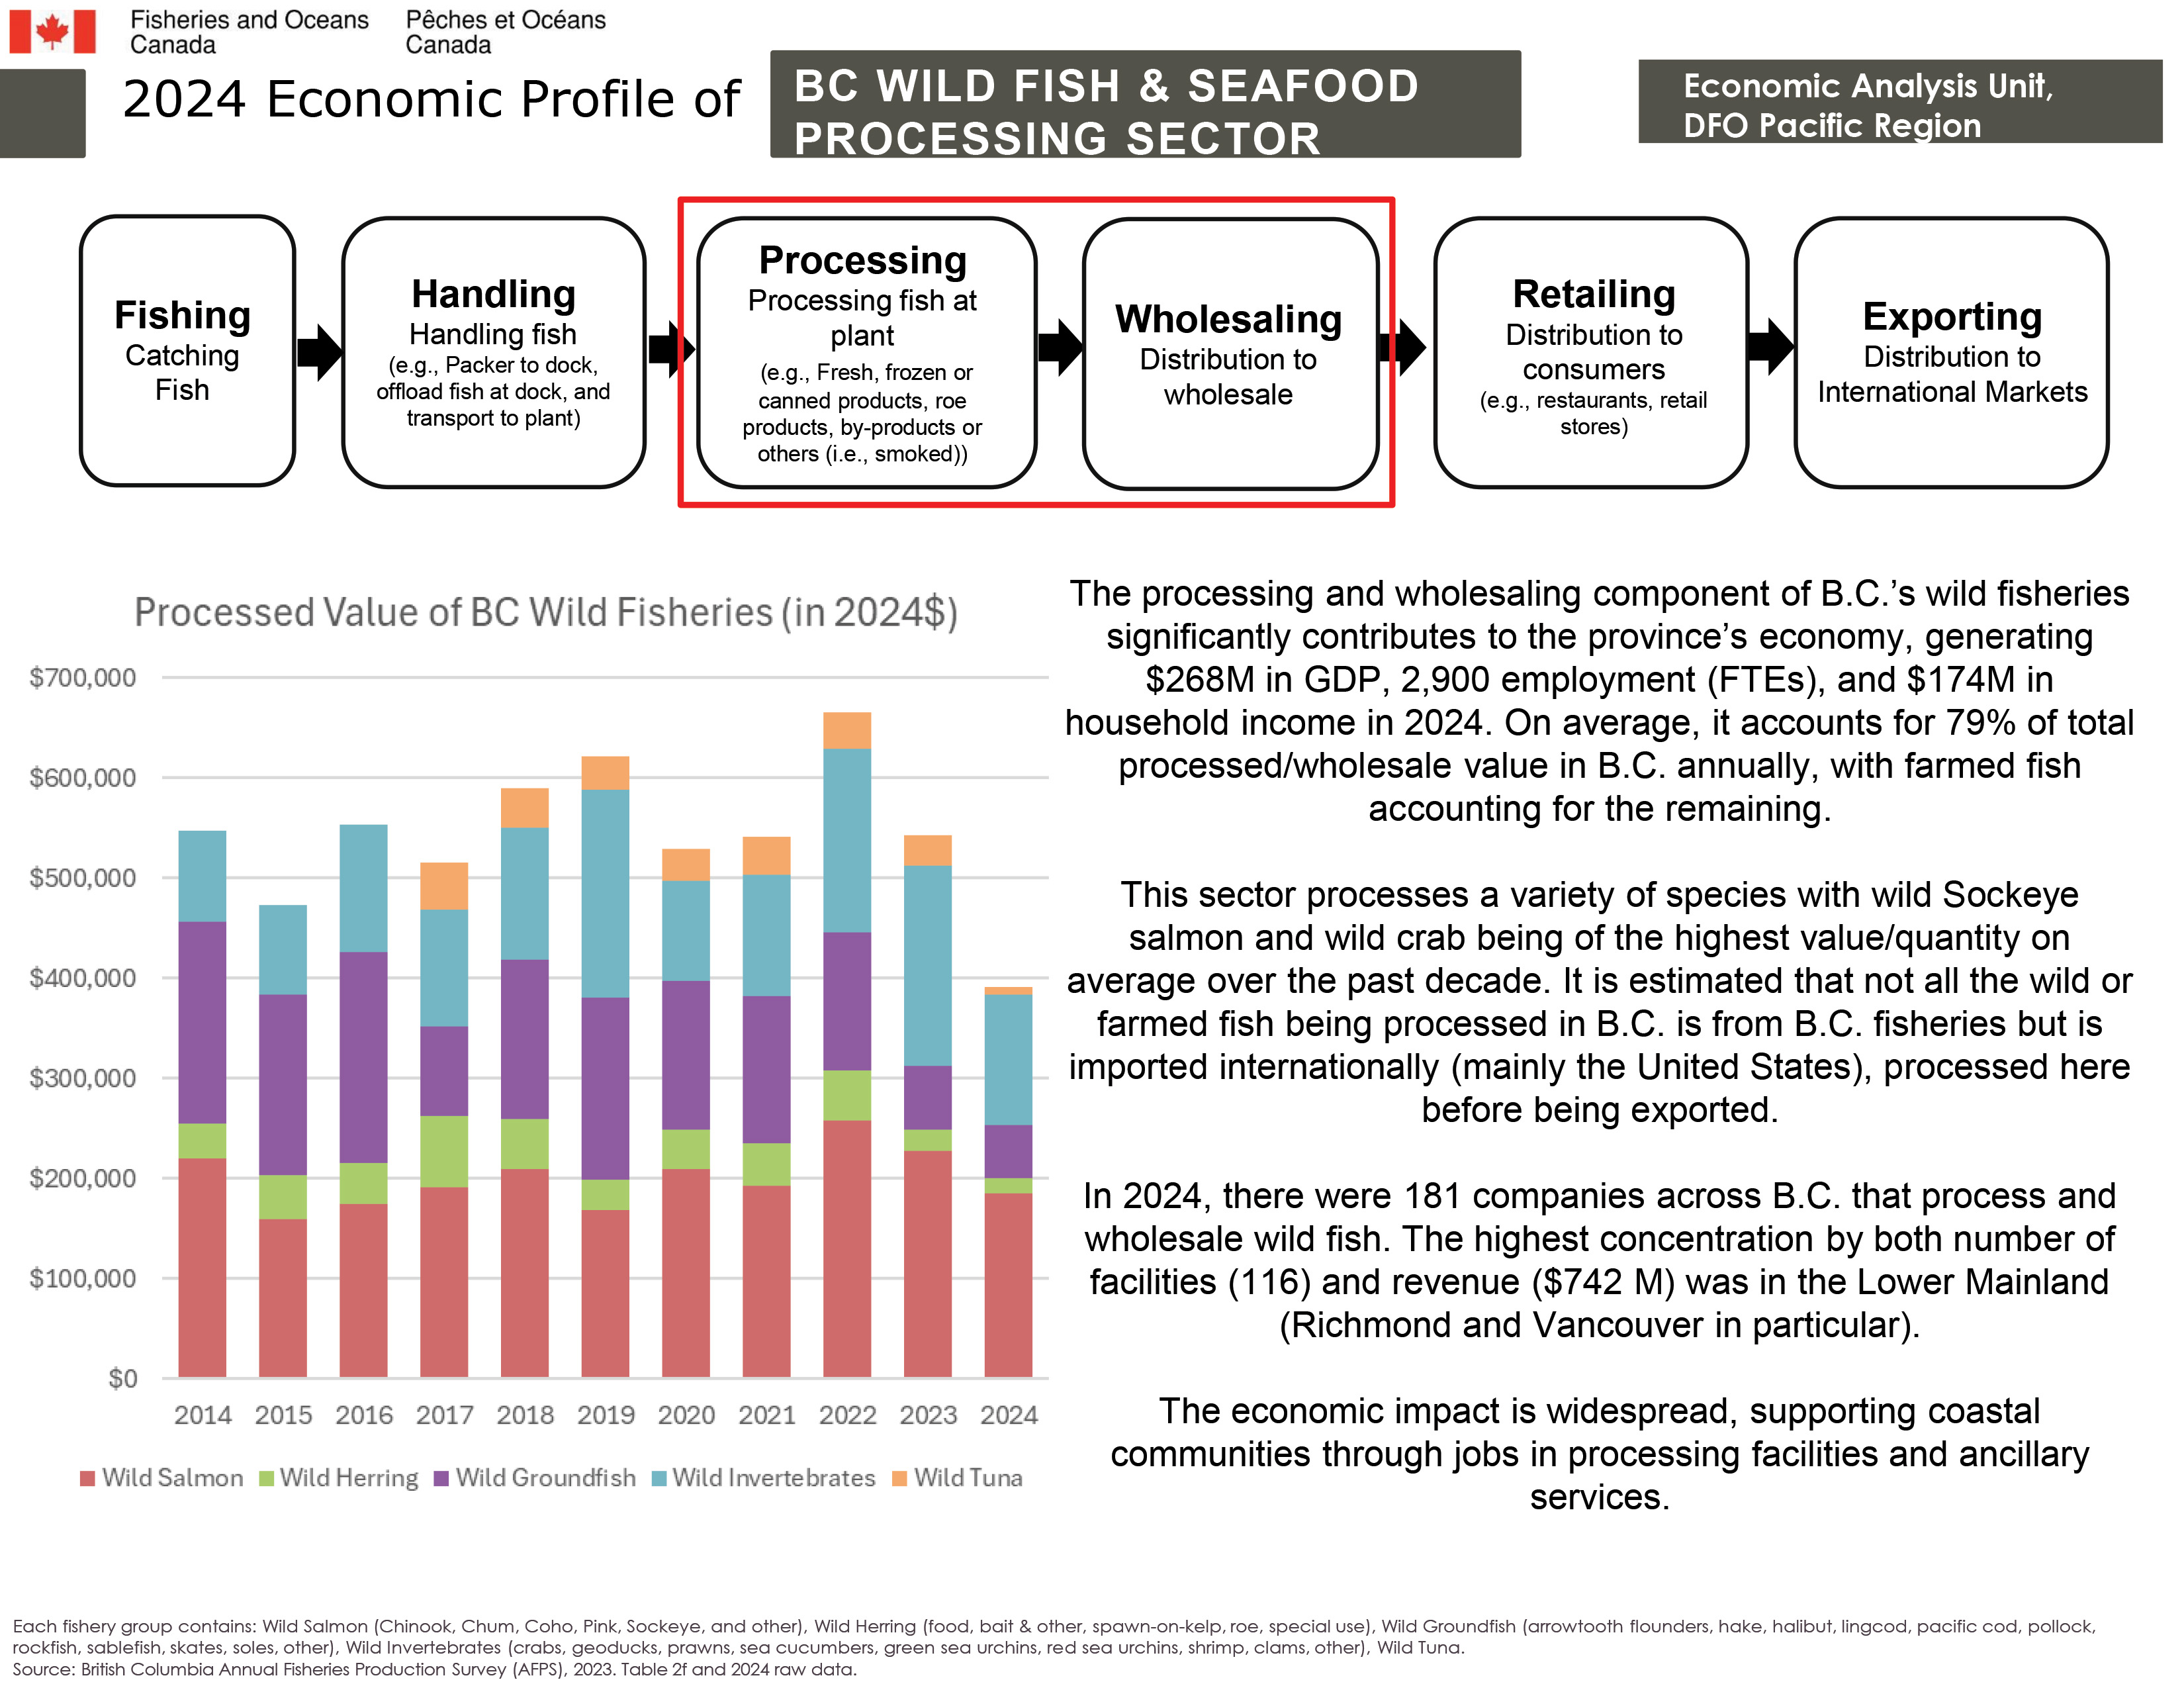
A sequential graphic showing the fishery value chain
- Fishing: including catching fish.
- Handling: including handling fish (e.g., packer to dock, offload fish at dock, and transport to plant).
- Processing: including processing fish at plant (e.g., fresh, frozen, or canned products, roe products, by-products, or others (i.e., smoked)).
- Wholesaling: including distribution to wholesale.
- Retailing: including distribution to customers (e.g., restaurants, retail stores).
- Exports: including distribution to international markets.
Chart of processed value of BC wild fisheries (in 2024$)
Each fishery group contains: wild salmon (Chinook, Chum, Coho, Pink, Sockeye, and other), wild herring (food, bait & other, spawn-on-kelp, roe, special use), wild groundfish (arrowtooth flounders, hake, halibut, lingcod, pacific cod, pollock, rockfish, sablefish, skates, soles, other), wild invertebrates (crabs, geoducks, prawns, sea cucumbers, green sea urchins, red sea urchins, shrimp, clams, other), wild tuna.
Wild salmon
- 2014 – $220K
- 2015 – $159K
- 2016 – $175K
- 2017 – $191K
- 2018 – $209K
- 2019 – $169K
- 2020 – $210K
- 2021 – $193K
- 2022 – $259K
- 2023 – $227K
- 2024 – $185K
Wild herring
- 2014 – $36K
- 2015 – $44K
- 2016 – $40K
- 2017 – $72K
- 2018 – $50K
- 2019 – $30K
- 2020 – $39K
- 2021 – $41K
- 2022 – $49K
- 2023 – $22K
- 2024 – $15K
Wild groundfish
- 2014 – $201K
- 2015 – $181K
- 2016 – $211K
- 2017 – $88K
- 2018 – $160K
- 2019 – $182K
- 2020 – $148K
- 2021 – $148K
- 2022 – $138K
- 2023 – $63K
- 2024 – $53K
Wild invertebrates
- 2014 – $90K
- 2015 – $89K
- 2016 – $128K
- 2017 – $117K
- 2018 – $132K
- 2019 – $208K
- 2020 – $100K
- 2021 – $121K
- 2022 – $183K
- 2023 – $200K
- 2024 – $131K
Wild tuna
- 2014 – N/A
- 2015 – N/A
- 2016 – N/A
- 2017 – $47K
- 2018 – $39K
- 2019 – $33K
- 2020 – $32K
- 2021 – $38K
- 2022 – $36K
- 2023 – $30K
- 2024 - $8K
The processing and wholesaling component of B.C.’s wild fisheries significantly contribute to the province’s economy, generating $268M in GDP, 2,900 in employment (FTEs), and $174M in household income in 2024. On average, it accounts for 79% of total value added from processing in B.C. annually, with farmed fish accounting for the remaining.
This sector processes a variety of species with wild Sockeye salmon and wild crab being of the highest value/quantity on average over the past decade. It is estimated that not all the wild or farmed fish being processed in B.C. is from B.C. fisheries but is imported internationally (mainly the United States), processed here before being exported.
In 2024, there were 181 companies across B.C. that process and wholesale wild fish. The highest concentration by both number of facilities (116) and revenue ($742 M) was in the Lower Mainland (Richmond and Vancouver in particular).
The economic impact is widespread, supporting coastal communities through jobs in processing facilities and ancillary services.
Source: British Columbia Annual Fisheries Production Survey (AFPS), 2024. Table 2f.
Long text version
2024 Economic profile of BC fisheries exports
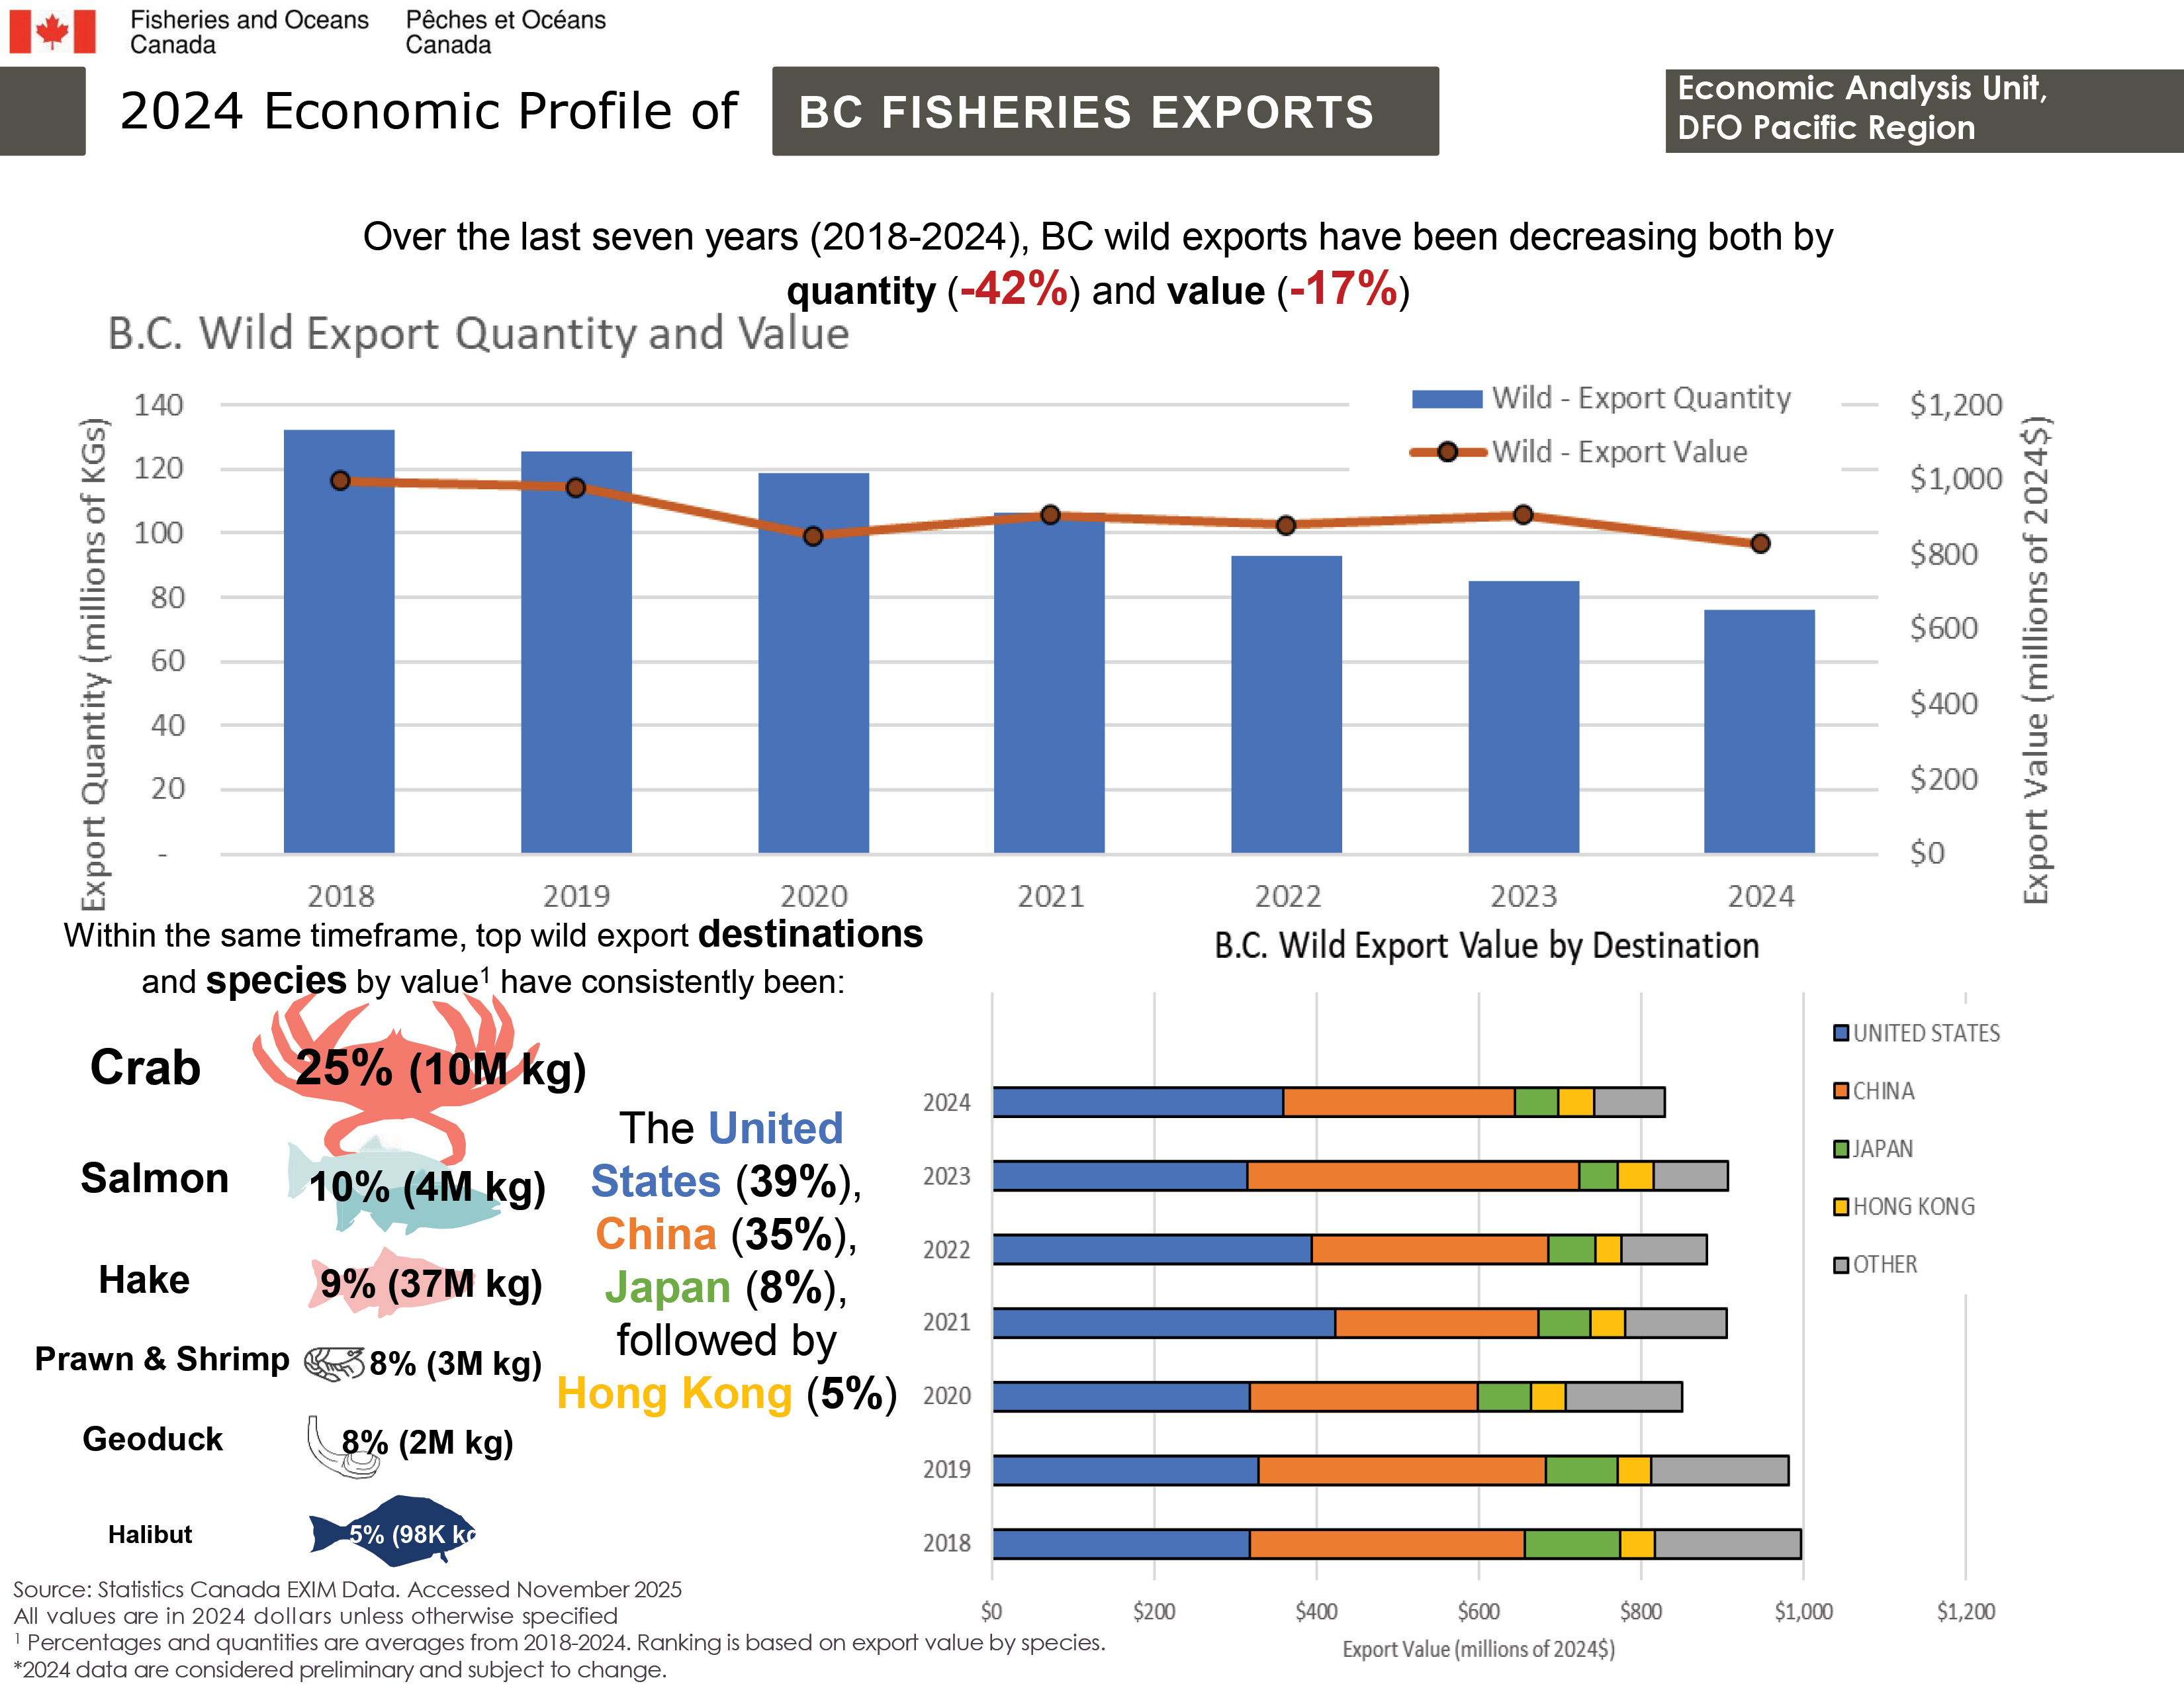
Over the last seven years (2018-2024), BC wild exports have been decreasing both by quantity (-42%) and value (-17%).
2024 data are considered preliminary and subject to change.
All values are in 2024 dollars unless otherwise specified.
Chart: B.C. wild export quantity and value
Wild export quantity (in kilograms)
- 2018 – 132M KG
- 2019 – 125M KG
- 2020 – 119M KG
- 2021 – 106M KG
- 2022 – 93M KG
- 2023 – 85M KG
- 2024 – 76M KG
Wild export value (in 2024$)
- 2018 – $997M
- 2019 – $982M
- 2020 – $851M
- 2021 – $906M
- 2022 – $880M
- 2023 – $906M
- 2024 – $828M
Within the same timeframe, top wild export destinations and species by value have consistently been:
Top wild export species, by percentage
- Crab – 25%
- Salmon – 10%
- Hake – 9%
- Shrimp & Prawn – 8%
- Geoduck – 8%
- Halibut – 5%
Top wild export species, by quantity in kilograms
- Crab – 10M KG
- Salmon – 4M KG
- Hake – 37M KG
- Shrimp & Prawn – 3M KG
- Geoduck – 2M KG
- Halibut – 98K KG
Top wild product export destinations, by percentage
- United States – 39%
- China – 35%
- Japan – 8%
- Hong Kong – 5%
Percentages and quantities are averages from 2018-2024. Ranking is based on export value by species.
Chart: B.C. wild export value by destination (in 2024 dollars)
United States
- 2018 – $318M
- 2019 – $329M
- 2020 – $317M
- 2021 – $422M
- 2022 – $394M
- 2023 – $315M
- 2024 – $359M
China
- 2018 – $339M
- 2019 – $353M
- 2020 – $282M
- 2021 – $250M
- 2022 – $292M
- 2023 – $409M
- 2024 – $286M
Japan
- 2018 – $118M
- 2019 – $89M
- 2020 – $65M
- 2021 – $65M
- 2022 – $58M
- 2023 – $47M
- 2024 – $54M
Hong Kong
- 2018 – $41M
- 2019 – $40M
- 2020 – $43M
- 2021 – $43M
- 2022 – $31M
- 2023 – $44M
- 2024 – $43M
Other
- 2018 – $181M
- 2019 – $170M
- 2020 – $144M
- 2021 – $125M
- 2022 – $106M
- 2023 – $91M
- 2024 – $87M
Source: Statistics Canada EXIM Data. Accessed November 2025.
Long text version
2024 Economic profile of supply and distribution of BC seafood
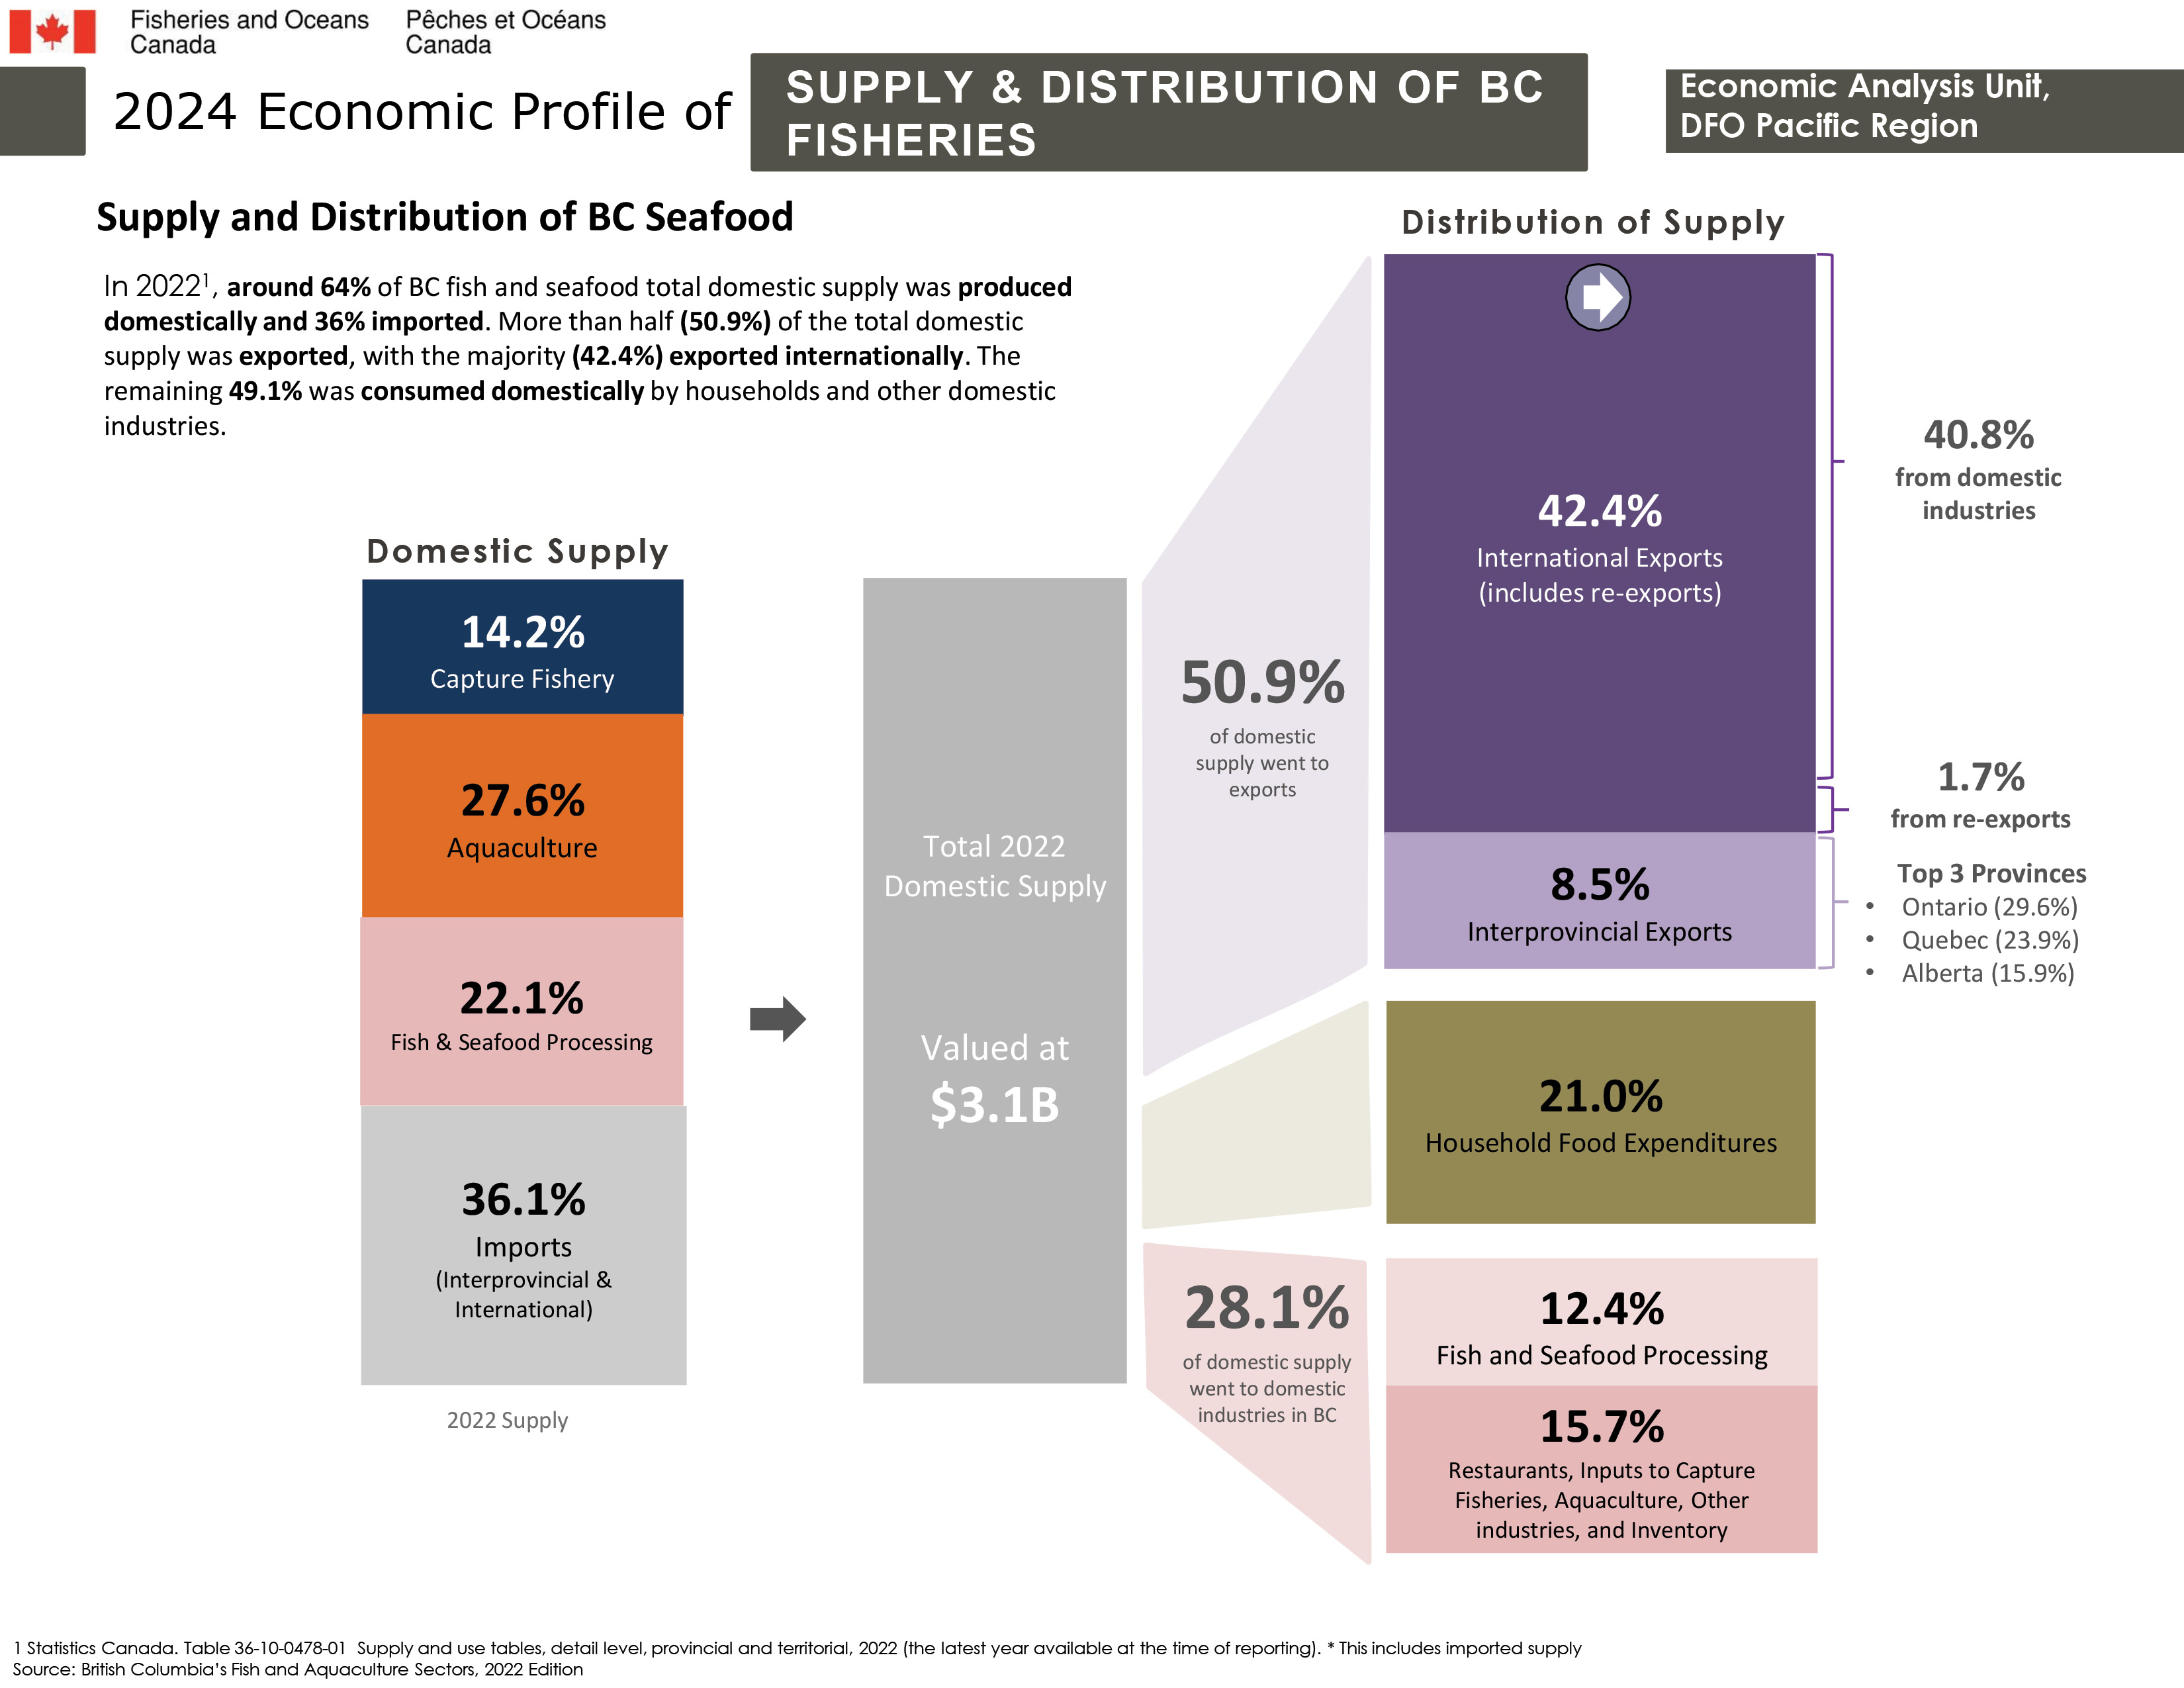
Supply and distribution of BC seafood
In 2022, around 64% of BC fish and seafood total domestic supply was produced domestically and 36% imported. More than half (50.9%) of the total domestic supply was exported*, with the majority (42.4%) exported internationally. The remaining 49.1% was consumed domestically by households and other domestic industries.
Domestic supply and distribution of supply source: Statistics Canada, Supply Use Tables, 2022 (the latest year available at the time of reporting). *This includes imported supply.
Source: British Columbia’s Fish and Aquaculture Sectors, 2022 Edition
Domestic Supply: Key metrics from 2022
- 14.2% of domestic supply comes from BC production in the capture fishery
- 27.6% of domestic supply comes from BC production from aquaculture
- 22.1% of domestic supply comes from BC fish and seafood processing
- 36.1% of domestic supply was from imports (both interprovincial and international)
- Total 2022 supply was valued at $3.1 Billion
Distribution of supply: Key metrics from 2022
- 50.9% of domestic supply went to exports. This includes 42.4% to international exports, of which 40.8% was from domestic industries and 1.7% from re-exports. 8.5% of domestic supply went to interprovincial exports, with the top 3 destinations being Ontario (29.6%), Quebec (23.9%) and Alberta (15.9%).
- 49.1% of domestic supply was consumed in of which:
- 21.0% of domestic supply went to household food expenditures
- 28.1% of domestic supply went to other domestic industries (12.4% to fish and seafood processing and the remaining 15.7% used by restaurants and as inputs to capture fisheries, aquaculture, other industries)
Source: Statistics Canada, Supply Use Tables, 2022 (the latest year available at the time of reporting).
- Date modified: