
Herring fishery
The following profile provides the socioeconomic context of the herring fishery in British Columbia. It includes an overview of the commercial sector. This overview is based on data collected from DFO commercial harvest logbooks and sale slips, public reports, and DFO surveys on harvest prices.
Long text version
2024 economic profile of the Pacific herring fishery
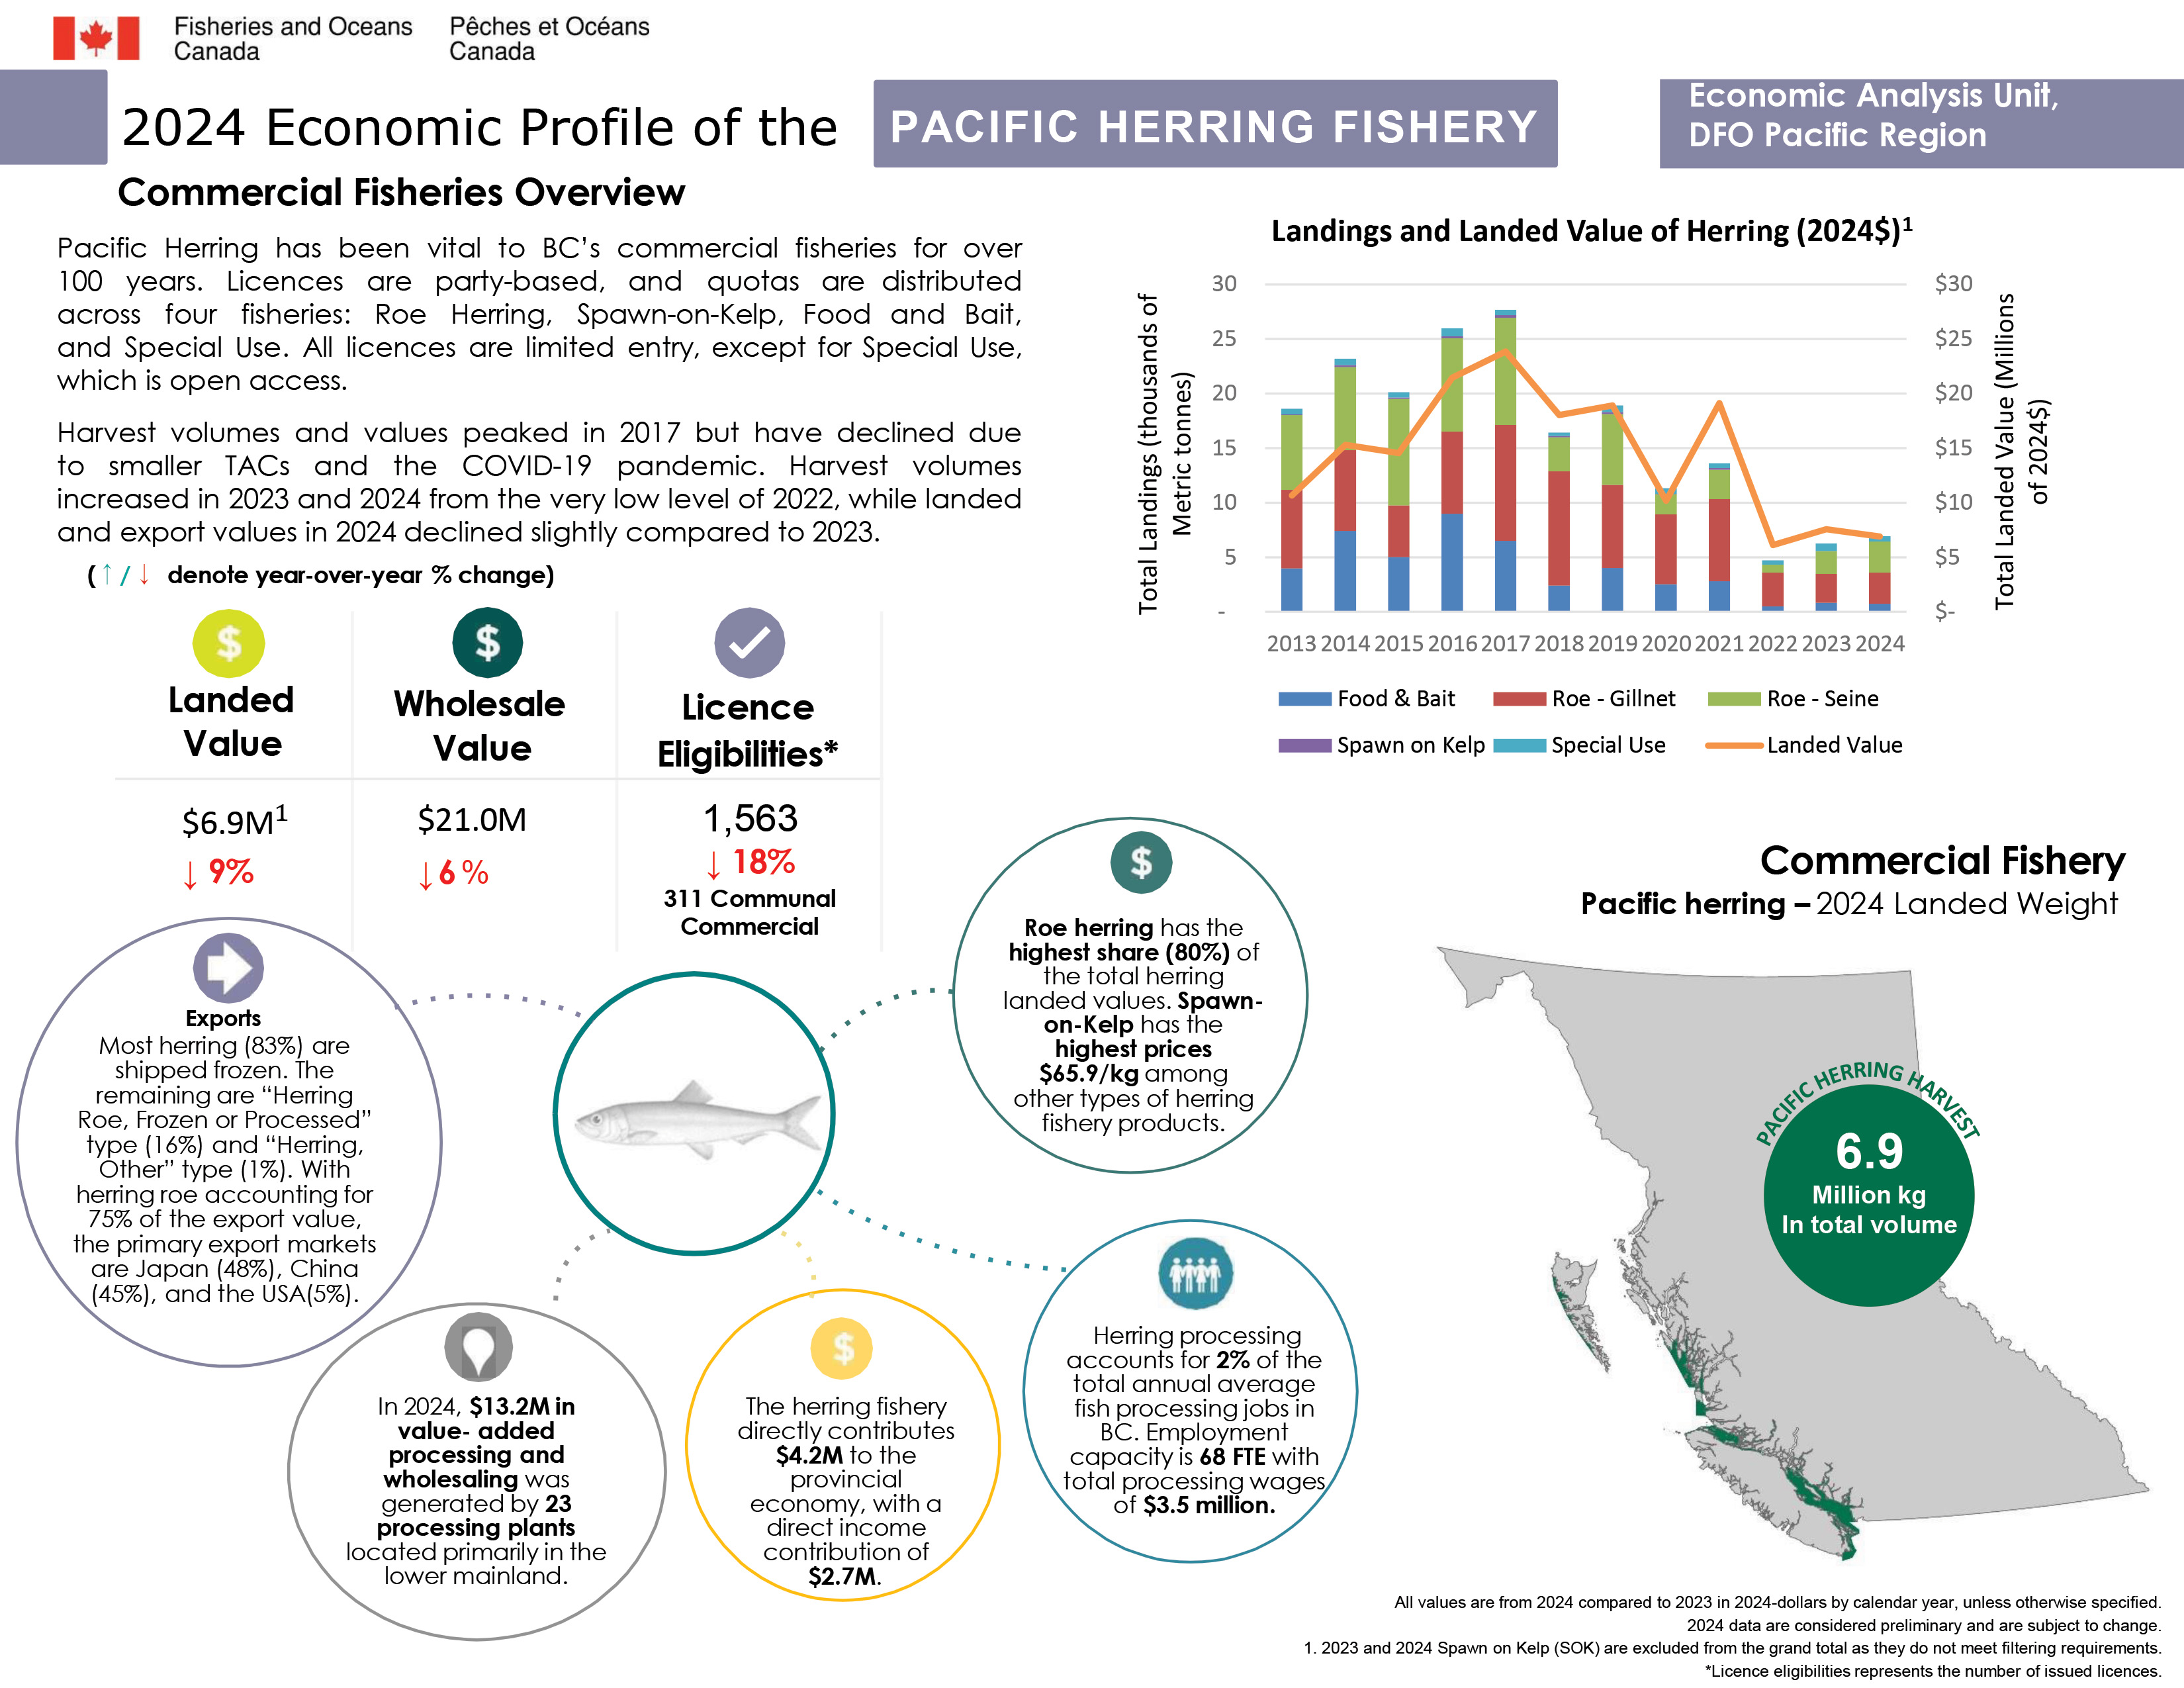
Commercial fisheries overview
Pacific herring has been vital to BC’s commercial fisheries for over 100 years. Licences are party-based, and quotas are distributed across four fisheries: roe herring, spawn-on-kelp, food and bait, and special use. All licences are limited entry, except for special use, which is open access.
Harvest volumes and values peaked in 2017 but have declined due to smaller Total Allowable Catch (TAC) and the COVID-19 pandemic. Harvest volumes increased in 2023 and 2024 from the very low level of 2022, while landed and export values in 2024 declined slightly compared to 2023.
All values are from 2024 compared to 2023 in 2024-dollars by calendar year, unless otherwise specified.
Key metrics for the herring fishery, all values are from 2024 and in 2024 dollars
- Landed value ($6.9M), decreased by 9% since 2023
- Wholesale value ($21.0 M), decreased by 6% since 2023
- Licence eligibilities (1,563, with 311 communal commercial licences), decreased by 18% since 2023. Licence eligibilities represents the number of issued licences.
2024 data are considered preliminary and are subject to change.
Annual herring landings (in metric tonnes) and landed value (in 2024 dollars) by fishery.
Herring roe gillnet
- 2013 – 7,189 t
- 2014 – 7,397 t
- 2015 – 4,717 t
- 2016 – 7,513 t
- 2017 – 10,621 t
- 2018 – 10,465 t
- 2019 – 7,597 t
- 2020 – 6,415 t
- 2021 – 7,527 t
- 2022 – 3,091 t
- 2023 – 2,621 t
- 2024 – 2,858 t
Herring roe seine
- 2013 – 6,842 t
- 2014 – 7,598 t
- 2015 – 9,780 t
- 2016 – 8,569 t
- 2017 – 9,816 t
- 2018 – 3,111 t
- 2019 – 6,512 t
- 2020 – 1,831 t
- 2021 – 2,718 t
- 2022 – 744 t
- 2023 – 2,105 t
- 2024 – 2,853 t
Spawn-on-kelp
2023 and 2024 spawn-on-kelp (SOK) are excluded from the grand total as they do not meet filtering requirements.
- 2013 - 60 t
- 2014 - 181 t
- 2015 - 115 t
- 2016 - 187 t
- 2017 - 244 t
- 2018 - 149 t
- 2019 - 171 t
- 2020 - 45 t
- 2021 - 139 t
- 2022 - 0.0 t
Food and bait
- 2013 – 3,992 t
- 2014 – 7,426 t
- 2015 – 5,027 t
- 2016 – 8,994 t
- 2017 – 6,510 t
- 2018 – 2,411 t
- 2019 – 4,024 t
- 2020 – 2,530 t
- 2021 – 2,796 t
- 2022 – 491 t
- 2023 – 847 t
- 2024 – 740 t
Special use
- 2013 – 538 t
- 2014 – 574 t
- 2015 – 489 t
- 2016 – 708 t
- 2017 – 488 t
- 2018 – 291 t
- 2019 – 599 t
- 2020 – 518 t
- 2021 – 424 t
- 2022 – 396 t
- 2023 – 685 t
- 2024 – 487 t
Total landed value (in 2024$)
- 2013 - $11M
- 2014 - $15M
- 2015 - $14M
- 2016 - $21M
- 2017 - $24M
- 2018 - $18M
- 2019 - $19M
- 2020 - $10M
- 2021 - $19M
- 2022 - $6M
- 2023 - $8M
- 2024 - $7M
Commercial fishery pacific herring - 2024 landed weight map
- Herring harvest: 6.9 million kilograms in total volume
Exports: Most herring (83%) are shipped frozen. The remaining are “herring roe, frozen or processed” type (16%) and “herring, other” type (1%). With herring roe accounting for 75% of the export value, the primary export markets are Japan (48%), China (45%), and the USA (5%).
In 2024, $13.2M in value-added processing and wholesaling was generated by 23 processing plants located primarily in the Lower Mainland.
The herring fishery directly contributes $4.2M to the provincial economy, with a direct income contribution of $2.7M.
Herring processing accounts for 2% of the total annual average fish processing jobs in BC. Employment capacity is 68 FTE (full time employment) with total processing wages of $3.5 million.
Roe herring has the highest share (80%) of the total herring landed values. Spawn-on-kelp has the highest price, $65.9/kg among other types of herring fishery products.
Data
The commercial data that informed this work can be downloaded here.
- Date modified: