
Groundfish fishery
The following profile provides the socioeconomic context of the groundfish fishery in British Columbia. It includes an overview of the commercial and recreational sectors. This overview is based on data collected from DFO commercial harvest logbooks and sale slips, public reports, and DFO surveys on harvest prices and recreational fisheries.
Long text version
2024 Economic profile of the groundfish fishery
Commercial fisheries overview
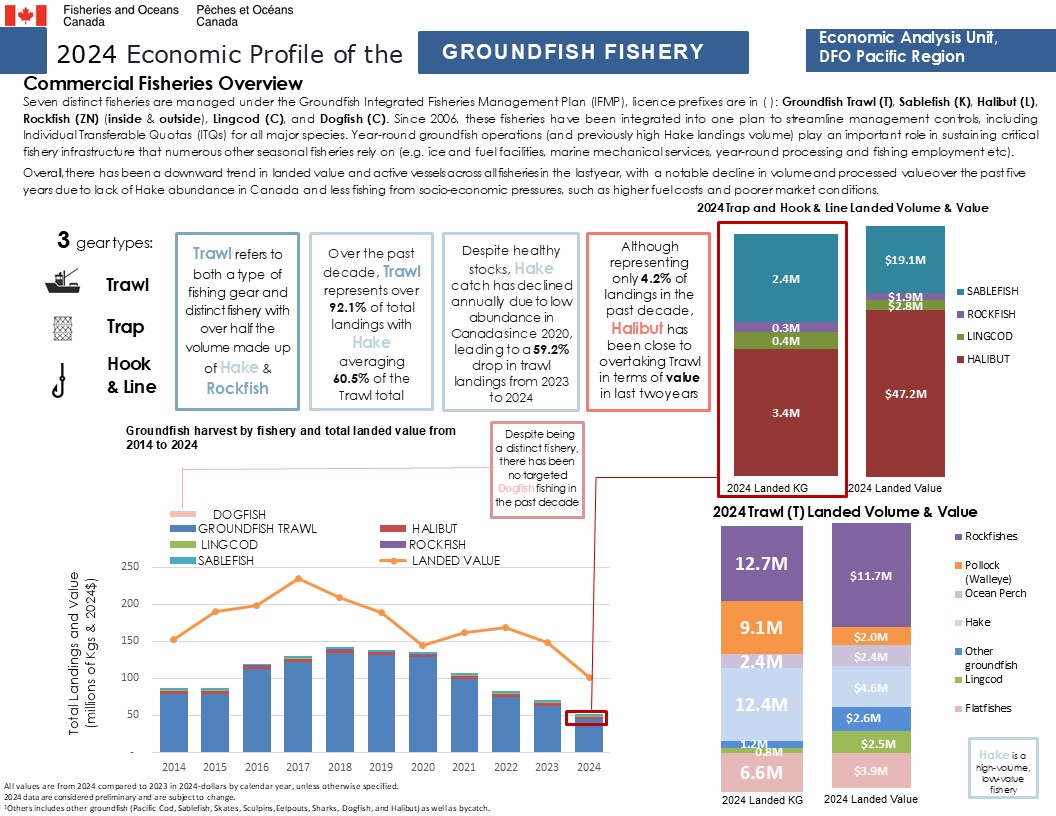
Seven distinct fisheries are managed under the Groundfish Integrated Fisheries Management Plan (IFMP), licence prefixes are in: groundfish trawl (T), sablefish (K), halibut (L), rockfish (ZN) (inside and outside), lingcod (C), and dogfish (C). Since 2006, these fisheries have been integrated into one plan to streamline management controls, including Individual Transferable Quotas (ITQs) for all major species. Year-round groundfish operations (and previously high Hake landings volume) play an important role in sustaining critical fishery infrastructure that numerous other seasonal fisheries rely on (e.g. ice and fuel facilities, marine mechanical services, year-round processing and fishing employment etc).
Overall, there has been a downward trend in landed value and active vessels across all fisheries in the last year, with a notable decline in volume and processed value over the past five years due to lack of hake abundance in Canada and less fishing due to socio-economic pressures, such as higher fuel costs and poorer market conditions.
There are 3 gear types in the groundfish fishery:
- Trawl
- Trap
- Hook and line
Trawl refers to both a type of fishing gear and distinct fishery with over half the volume made up of hake and rockfish.
Over the past decade, trawl represents over 92% of total landings with hake averaging 61% of the trawl total.
Despite healthy stocks, hake catch has declined annually due to low abundance in Canada since 2020, leading to a 59% drop in hake trawl landings from 2023 to 2024.
Although representing only 4% of landings in the past decade, halibut has been close to overtaking trawl in terms of value in last two years.
Despite being a distinct fishery, there has been no targeted dogfish fishing in the past decade.
All values are from 2024 compared to 2023 in 2024-dollars by calendar year, unless otherwise specified.
Harvest by fishery (in kilograms) and total landed value (in 2024 dollars) from 2014 to 2024
Trawl
- 2014 – 78.8M KG
- 2015 – 78.8 M KG
- 2016 – 112.2M KG
- 2017 – 122.1M KG
- 2018 – 134.3M KG
- 2019 - 131.4M KG
- 2020 – 128.1M KG
- 2021 – 99.8M KG
- 2022 – 75.0M KG
- 2023 – 62.8M KG
- 2024 – 45.1M KG
Halibut
- 2014 – 4.3M KG
- 2015 – 4.4M KG
- 2016 – 4.3M KG
- 2017 – 4.4M KG
- 2018 – 3.8M KG
- 2019 – 4.0M KG
- 2020 – 3.6M KG
- 2021 – 3.8M KG
- 2022 – 4.2M KG
- 2023 – 3.9M KG
- 2024 – 3.4M KG
Lingcod
- 2014 – 0.4M KG
- 2015 – 0.6M KG
- 2016 – 0.6M KG
- 2017 – 0.7M KG
- 2018 – 0.7M KG
- 2019 – 0.6M KG
- 2020 – 0.4M KG
- 2021 – 0.5M KG
- 2022 – 0.6M KG
- 2023 – 0.8M KG
- 2024 – 0.4M KG
Rockfish
- 2014 – 0.6M KG
- 2015 – 0.7M KG
- 2016 – 0.5M KG
- 2017 – 0.4M KG
- 2018 – 0.4M KG
- 2019 – 0.4M KG
- 2020 – 0.2M KG
- 2021 – 0.3M KG
- 2022 – 0.3M KG
- 2023 – 0.3M KG
- 2024 – 0.3M KG
Sablefish
- 2014 – 2.0M KG
- 2015 – 2.8M KG
- 2016 – 2.1M KG
- 2017 – 2.0M KG
- 2018 – 2.5M KG
- 2019 – 2.7M KG
- 2020 – 2.5M KG
- 2021 – 3.0M KG
- 2022 – 2.9M KG
- 2023 – 3.2M KG
- 2024 – 2.4M KG
Total landed value
- 2014 – $152.9M
- 2015 – $190.1M
- 2016 – $197.7M
- 2017 – $234.9M
- 2018 – $208.5M
- 2019 – $188.5M
- 2020 – $143.8M
- 2021 – $161.4M
- 2022 – $168.6M
- 2023 – $147.7M
- 2024 – $100.7M
2024 Trap and hook and line landed volume and value
Landings (in kilograms)
- Sablefish - 2.4M KG
- Rockfish - 0.3M KG
- Lingcod - 0.4M KG
- Halibut - 3.4M KG
Landed value (in 2024$)
- Sablefish $19.1M
- Rockfish $1.9M
- Lingcod $2.8M
- Halibut $47.2M
2024 Trawl landed volume and value by species
The category “Others” includes other groundfish (pacific cod, sablefish, skates, sculpins, eelpouts, sharks, dogfish, and halibut) as well as bycatch.
Landings (in kilograms)
- Hake - 12.4M KG
- Rockfish - 12.7M KG
- Flatfish - 6.6M KG
- Walleye pollock - 9.1M KG
- Ocean perch - 2.4M KG
- Lingcod - 0.8M KG
- Other - 1.2M KG
Landed value (in 2024$)
- Hake - $4.6M
- Rockfish - $11.7M
- Flatfish - $3.9M
- Walleye pollock - $2.0M
- Ocean perch - $2.4M
- Lingcod - $2.5M
- Other - $2.6M
Hake is a high-volume, low-value fishery.
2024 data are considered preliminary and are subject to change.
Long text version
2024 Economic profile of the groundfish fishery
All values are from 2024 compared to 2023 in 2024-dollars by calendar year, unless otherwise specified.
Export overview
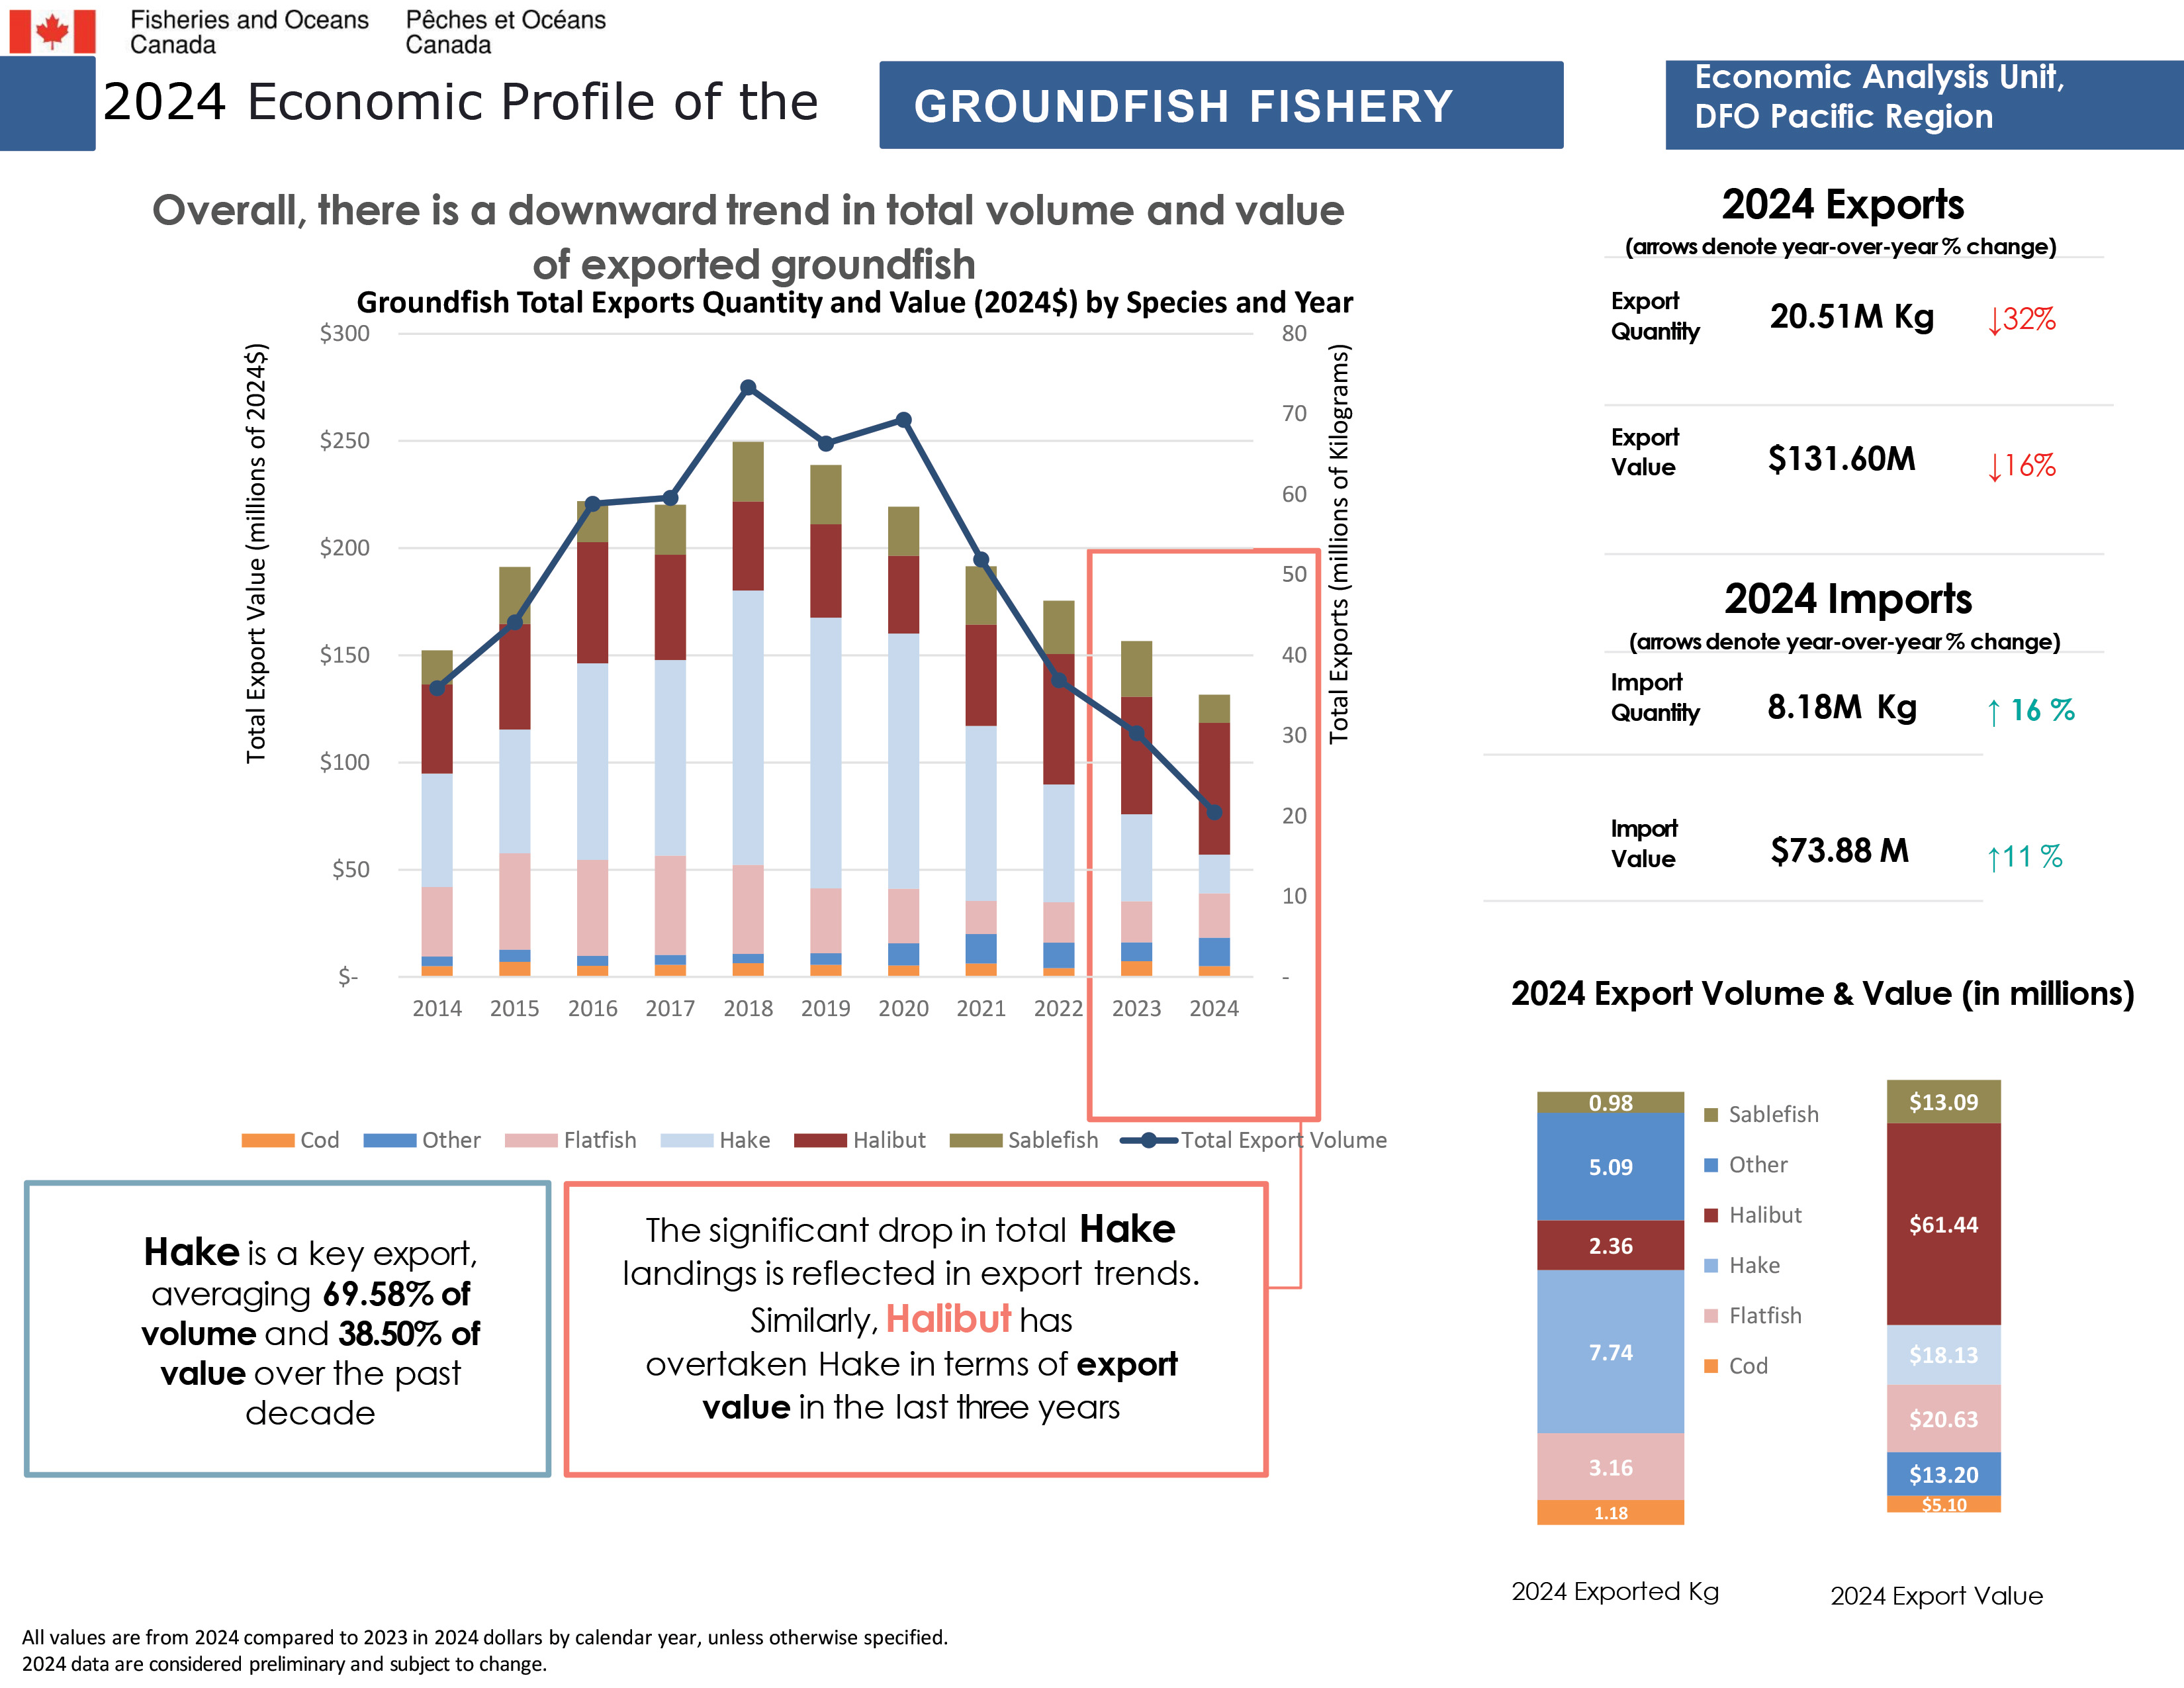
Overall, there is a downward trend in total volume and value of exported groundfish.
Total exports quantity and value (2024$) by species and year
Cod export value
- 2014 – $5.0M
- 2015 – $7.0M
- 2016 – $5.2M
- 2017 – $5.7M
- 2018 – $6.4M
- 2019 – $5.6M
- 2020 – $5.4M
- 2021 – $6.3M
- 2022 – $4.1M
- 2023 – $7.3M
- 2024 – $5.1M
Flatfish export value
- 2014 – $32.3M
- 2015 – $44.9M
- 2016 – $44.7M
- 2017 – $46.4M
- 2018 – $41.5M
- 2019 – $30.3M
- 2020 – $25.4M
- 2021 – $15.4M
- 2022 – $18.9M
- 2023 – $19.1M
- 2024 – $20.6M
Hake export value
- 2014 – $53.0M
- 2015 – $57.7M
- 2016 – $91.6M
- 2017 – $91.2M
- 2018 – $128.0M
- 2019 – $126.4M
- 2020 – $119.1M
- 2021 – $81.7M
- 2022 – $55.0M
- 2023 – $40.5M
- 2024 – $18.1M
Halibut export value
- 2014 – $41.6M
- 2015 – $49.3M
- 2016 – $56.5M
- 2017 – $49.1M
- 2018 – $41.6M
- 2019 – $43.5M
- 2020 – $36.2M
- 2021 – $47.2M
- 2022 – $60.7M
- 2023 – $54.9M
- 2024 – $61.4M
Sablefish export value
- 2014 – $15.8M
- 2015 – $26.5M
- 2016 – $19.2M
- 2017 – $23.3M
- 2018 – $27.7M
- 2019 – $27.6M
- 2020 – $23.0M
- 2021 – $27.2M
- 2022 – $25.0M
- 2023 – $25.9M
- 2024 – $13.1M
Other export value
- 2014 – $4.6M
- 2015 – $5.7M
- 2016 – $4.7M
- 2017 – $4.6M
- 2018 – $4.4M
- 2019 – $5.3M
- 2020 – $10.3M
- 2021 – $13.7M
- 2022 – $11.9M
- 2023 – $8.9M
- 2024 – $13.2M
Total export volume
- 2014 – 36M KG
- 2015 – 44M KG
- 2016 – 59M KG
- 2017 – 60M KG
- 2018 – 73M KG
- 2019 – 66M KG
- 2020 – 69M KG
- 2021 – 52M KG
- 2022 – 37M KG
- 2023 – 30M KG
- 2024 – 21M KG
Hake is a key export, averaging 70% of volume and 39% of value over the past decade.
The significant drop in total hake landings is reflected in export trends. Similarly, halibut has overtaken hake in terms of export value in the last three years.
2024 Exports
- Export quantity 21M kilograms, decreased by 32% since 2023.
- Export value $132M, decreased by 16% since 2023.
2024 Imports
- Import quantity 8.18M kilograms, increased by 16% since 2023.
- Import value $73.88M, increased by 11% since 2023.
2024 Export volume and value by species
Exported volume (in kilograms)
- Sablefish – 1M KG
- Halibut – 2M KG
- Hake – 8M KG
- Flatfish – 3M KG
- Cod – 1M KG
- Other – 5M KG
Exported value (2024$)
- Sablefish - $13M
- Halibut - $61M
- Hake - $18M
- Flatfish - $21M
- Cod - $5M
- Other - $13M
2024 data are considered preliminary and are subject to change.
Long text version
2024 Economic profile of the groundfish fishery
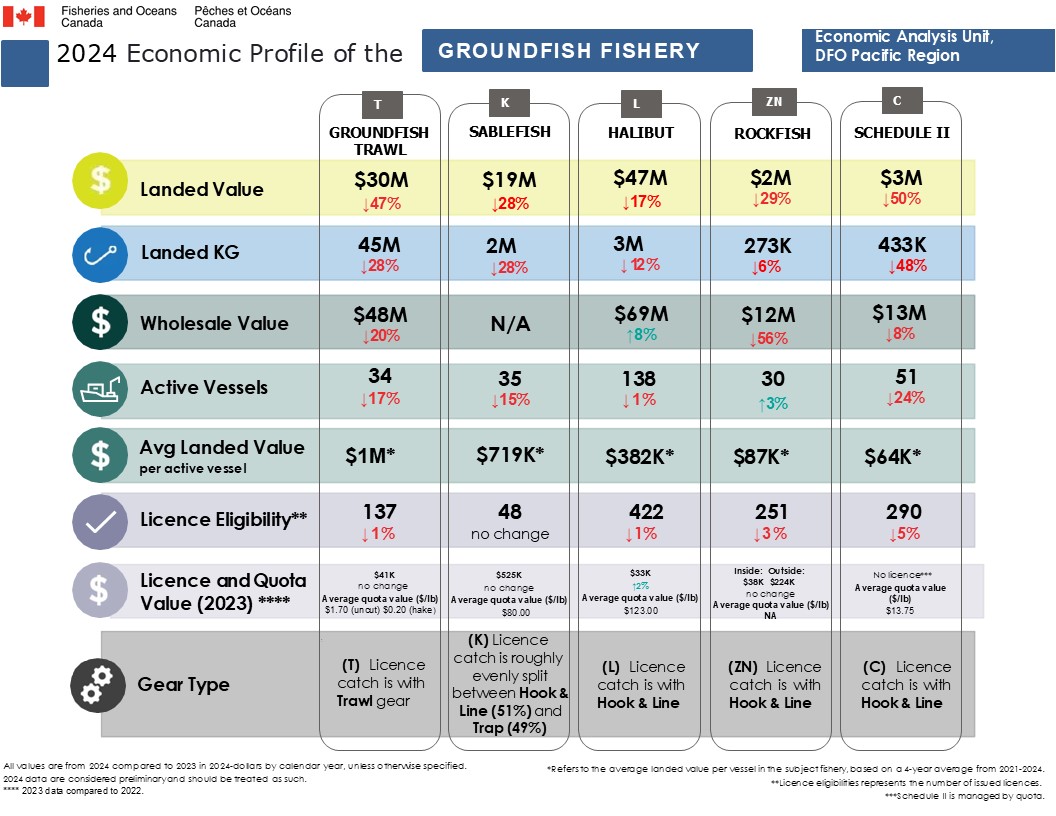
Key metrics by fishery
All values are from 2024 compared to 2023 in 2024-dollars by calendar year, unless otherwise specified. 2024 data are considered preliminary and are subject to change.
Average landed value refers to the average landed value per vessel in the subject fishery, based on a 4-year average from 2021-2024.
Licence eligibilities represents the number of issued licences.
Groundfish trawl (licence prefix T)
- Landed value ($30M), decreased by 47%
- Landed kilogram (45M), decreased by 28%
- Wholesale value ($48M), decreased by 20%
- Active vessels (34), decreased by 17%
- Average landed value per active vessel ($1M)
- Licence eligibility (137), decreased by 1%
- Licence value ($41K) in 2023, no change since 2022
- Average quota value ($/lb): $1.70 (uncut), $0.20 (hake)
- Gear type: T licence catch is with trawl gear
Sablefish (licence prefix K)
- Landed value ($19M), decreased by 28%
- Landed kilogram (2M) decreased by 28%
- Wholesale value: Not Available
- Active vessels (35), decreased by 15%
- Average landed value per active vessel ($719K)
- Licence eligibility (48), no change
- Licence value ($525K) in 2023, no change since 2022
- Average quota value ($/lb): $80.00
- Gear type: K licence catch is roughly evenly split between hook and line (51%) and trap (49%)
Halibut (licence prefix L)
- Landed value ($47M), decreased by 17%
- Landed kilogram (3M), decreased by 12%
- Wholesale value ($69M), increased by 8%
- Active vessels (138), decreased by 1%
- Average landed value per active vessel ($382K)
- Licence eligibility (422), decreased by 1%
- Licence value ($33K) in 2023, increased by 2% since 2022
- Average quota value ($/lb): $123.00
- Gear type: L licence catch is with hook and line
Rockfish (licence prefix ZN)
- Landed value ($2M), decreased by 29%
- Landed kilogram (273K), decreased by 6%
- Wholesale value ($12M), decreased by 56%
- Active vessels (30), increased by 3%
- Average landed value per active vessel ($87K)
- Licence eligibility (251), decreased by 3%
- Licence value (inside $38K, outside $224K) in 2023, no change since 2022
- Average quota value ($/lb): NA
- Gear type: ZN licence catch is with hook and line
Schedule II (licence prefix C)
Schedule II is managed by quota.
- Landed value ($3M), decreased by 50%
- Landed kilogram (433K), decreased by 48%
- Wholesale value ($13M), decreased by 8%
- Active vessels (51), decreased by 24%
- Average landed value per active vessel ($64K)
- Licence eligibility (290), decreased by 5%
- Licence value (no licence)
- Average quota value ($/lb): $13.75
- Gear type: C licence catch is with hook and line
Long text version
2024 Economic profile of the groundfish fishery
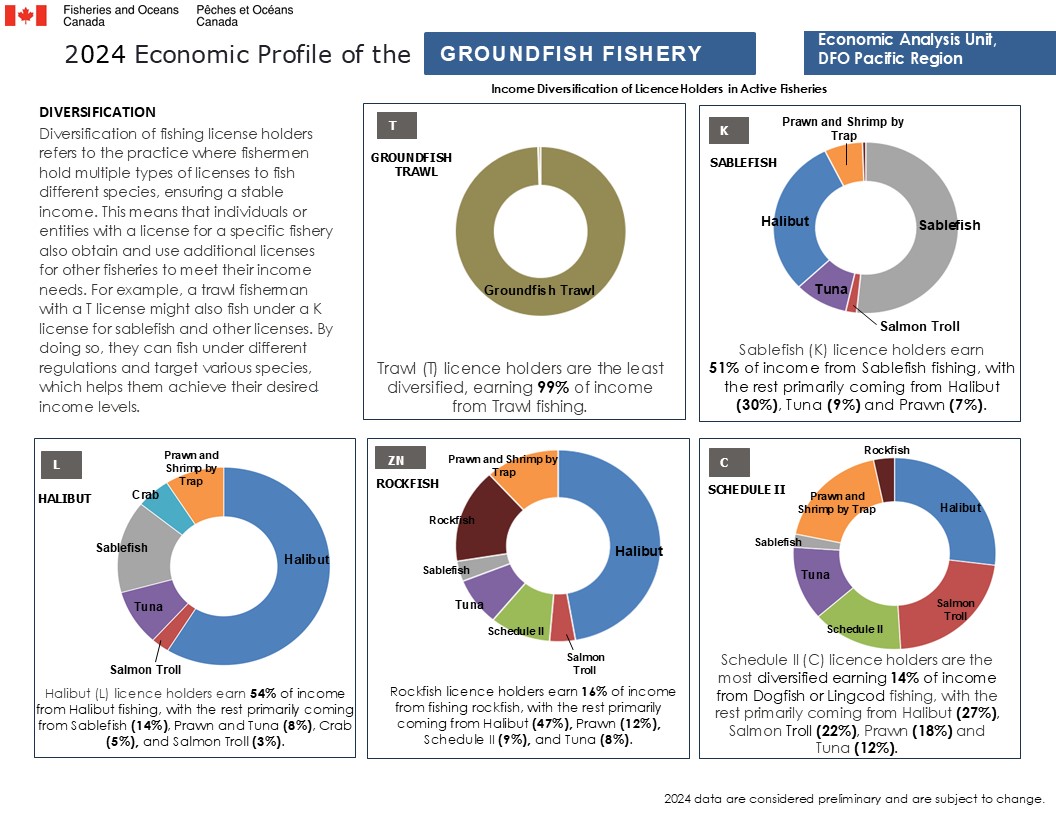
Diversification
Diversification of fishing license holders refers to the practice where fishermen hold multiple types of licenses to fish different species, ensuring a stable income. This means that individuals or entities with a license for a specific fishery also obtain and use additional licenses for other fisheries to meet their income needs. For example, a trawl fisherman with a T license might also fish under a K license for sablefish and other licenses. By doing so, they can fish under different regulations and target various species, which helps them achieve their desired income levels.
2024 data are considered preliminary and are subject to change.
Income diversification of licence holders in active fisheries (2024):
Groundfish trawl (licence prefix T)
Trawl licence holders are the least diversified, earning 99% of income from trawl fishing.
- Groundfish trawl 99%
- Salmon (Gillnet and Seine) 1%
Sablefish (licence prefix K)
Sablefish licence holders earn 51% of income from sablefish fishing, with the rest primarily coming from halibut (30%), tuna (9%), and prawn (7%).
- Sablefish 51%
- Halibut 30%
- Tuna 9%
- Prawn 7%
- Other 3%
Halibut (licence prefix L)
Halibut licence holders earn 54% of income from halibut fishing, with the rest primarily coming from sablefish (14%), prawn (8%), tuna (8%), crab (5%), and salmon troll (3%).
- Halibut 54%
- Sablefish 14%
- Prawn 8%
- Tuna 8%
- Crab 5%
- Salmon troll 3%
Rockfish (licence prefix ZN)
Rockfish licence holders earn 16% of income from fishing rockfish, with the rest primarily coming from halibut (47%), prawn (12%), schedule II (9%), and tuna (8%).
- Rockfish 16%
- Halibut 47%
- Prawn 12%
- Schedule II 9%
- Tuna 8%
- Salmon troll 4%
- Sablefish 3%
- Other 2%
Schedule II (licence prefix C)
Schedule II licence holders are the most diversified, earning 14% of income from dogfish or lingcod fishing, with the rest primarily coming from halibut (27%), salmon troll (22%), prawn (18%), and tuna (12%).
- Dogfish or lingcod 14%
- Halibut 27%
- Salmon troll 22%
- Prawn 18%
- Tuna 12%
Long text version
2024 Economic Profile of Hake in the Groundfish Fishery
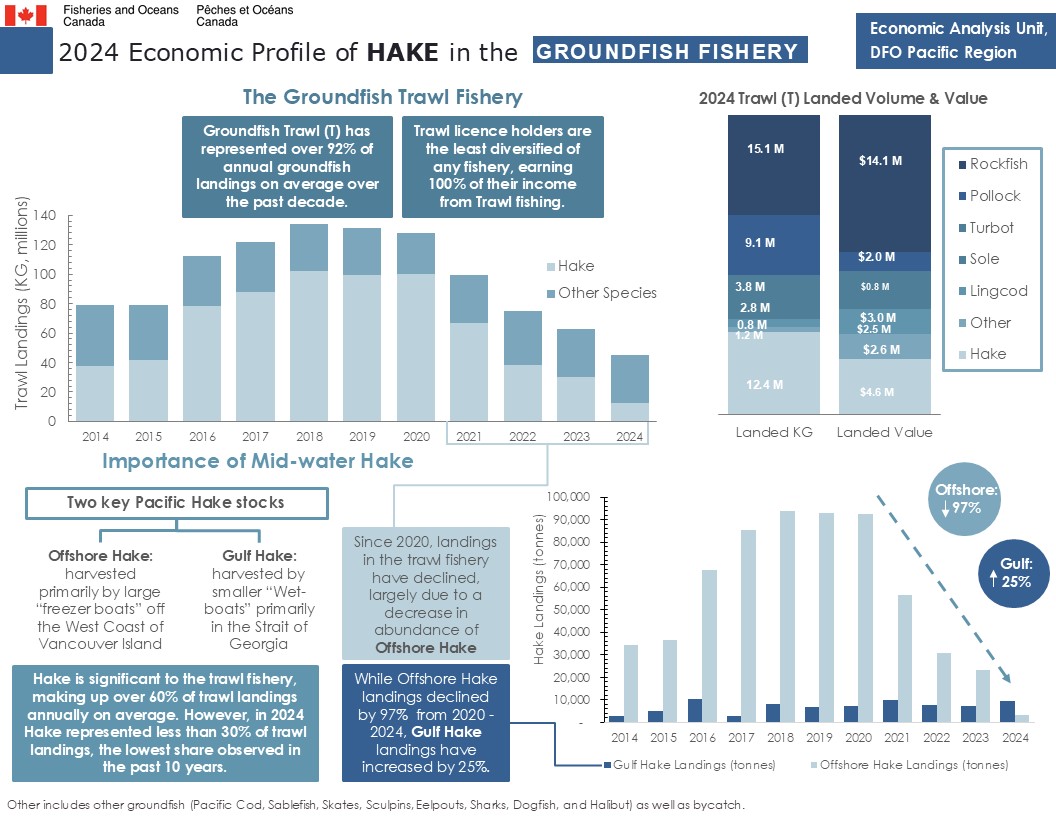
Groundfish Trawl (T) has represented over 92% of annual groundfish landings on average over the past decade. Trawl licence holders are the least diversified of any fishery, earning 100% of their income from Trawl fishing.
Since 2020, landings in the trawl fishery have declined, largely due to a decrease in abundance of offshore hake. While offshore hake landings declined by 97% from 2020 - 2024, gulf hake landings have increased by 25%.
Annual trawl landings (in million kilograms) by calendar year
Hake landings
- 2014: 37M KG
- 2015: 42M KG
- 2016: 78M KG
- 2017: 88M KG
- 2018: 102M KG
- 2019: 100M KG
- 2020: 100M KG
- 2021: 67M KG
- 2022: 38M KG
- 2023: 30M KG
- 2024: 12M KG
Other species landings
- 2014: 41M KG
- 2015: 37M KG
- 2016: 34M KG
- 2017: 34M KG
- 2018: 32M KG
- 2019: 32M KG
- 2020: 28M KG
- 2021: 33M KG
- 2022: 37M KG
- 2023: 33M KG
- 2024: 33M KG
Total landings
- 2014: 78M KG
- 2015: 79M KG
- 2016: 112M KG
- 2017: 122M KG
- 2018: 134M KG
- 2019: 132M KG
- 2020: 128M KG
- 2021: 100M KG
- 2022: 75M KG
- 2023: 63M KG
- 2024: 45M KG
2024 Trawl (T) landed volume (in kilograms) and value (in 2024 dollars)
Rockfish
- Landed KG: 15.1M
- Landed value: $14.1M
Pollock
- Landed KG: 9.1M
- Landed value: $2.0M
Turbot
- Landed KG: 3.8M
- Landed value: $0.8M
Sole
- Landed KG: 2.8M
- Landed value: $3.0M
Lingcod
- Landed KG: 0.8M
- Landed value: $2.5M
Other
- Landed KG: 1.2M
- Landed value: $2.6M
Other includes other groundfish (pacific cod, sablefish, skates, sculpins, eelpouts, sharks, dogfish, and halibut) as well as bycatch.
Hake
- Landed KG: 12.4M
- Landed value: $4.6M
Importance of mid-water hake
Hake is significant to the trawl fishery, making up over 60% of trawl landings annually on average. However, in 2024 Hake represented less than 30% of trawl landings, the lowest share observed in the past 10 years.
Two key Pacific hake stocks:
- Offshore hake: harvested primarily by large “freezer boats” off the West Coast of Vancouver Island.
- Gulf hake: harvested by smaller “wet-boats” primarily in the Strait of Georgia.
Annual hake landings (in tonnes) by calendar year
Gulf hake landings
- 2014: 2,958 tonnes
- 2015: 5,149 tonnes
- 2016: 10,344 tonnes
- 2017: 2,629 tonnes
- 2018: 8,162 tonnes
- 2019: 6,672 tonnes
- 2020: 7,398 tonnes
- 2021: 9,938 tonnes
- 2022: 7,554 tonnes
- 2023: 7,002 tonnes
- 2024: 9,219 tonnes
Offshore hake landings
- 2014: 34,433 tonnes
- 2015: 36,366 tonnes
- 2016: 67,677 tonnes
- 2017: 85,366 tonnes
- 2018: 93,937 tonnes
- 2019: 92,749 tonnes
- 2020: 92,287 tonnes
- 2021: 56,679 tonnes
- 2022: 30,687 tonnes
- 2023: 23,268 tonnes
- 2024: 3,112 tonnes
Long text version
Community reliance on hake groundfish trawl fishery
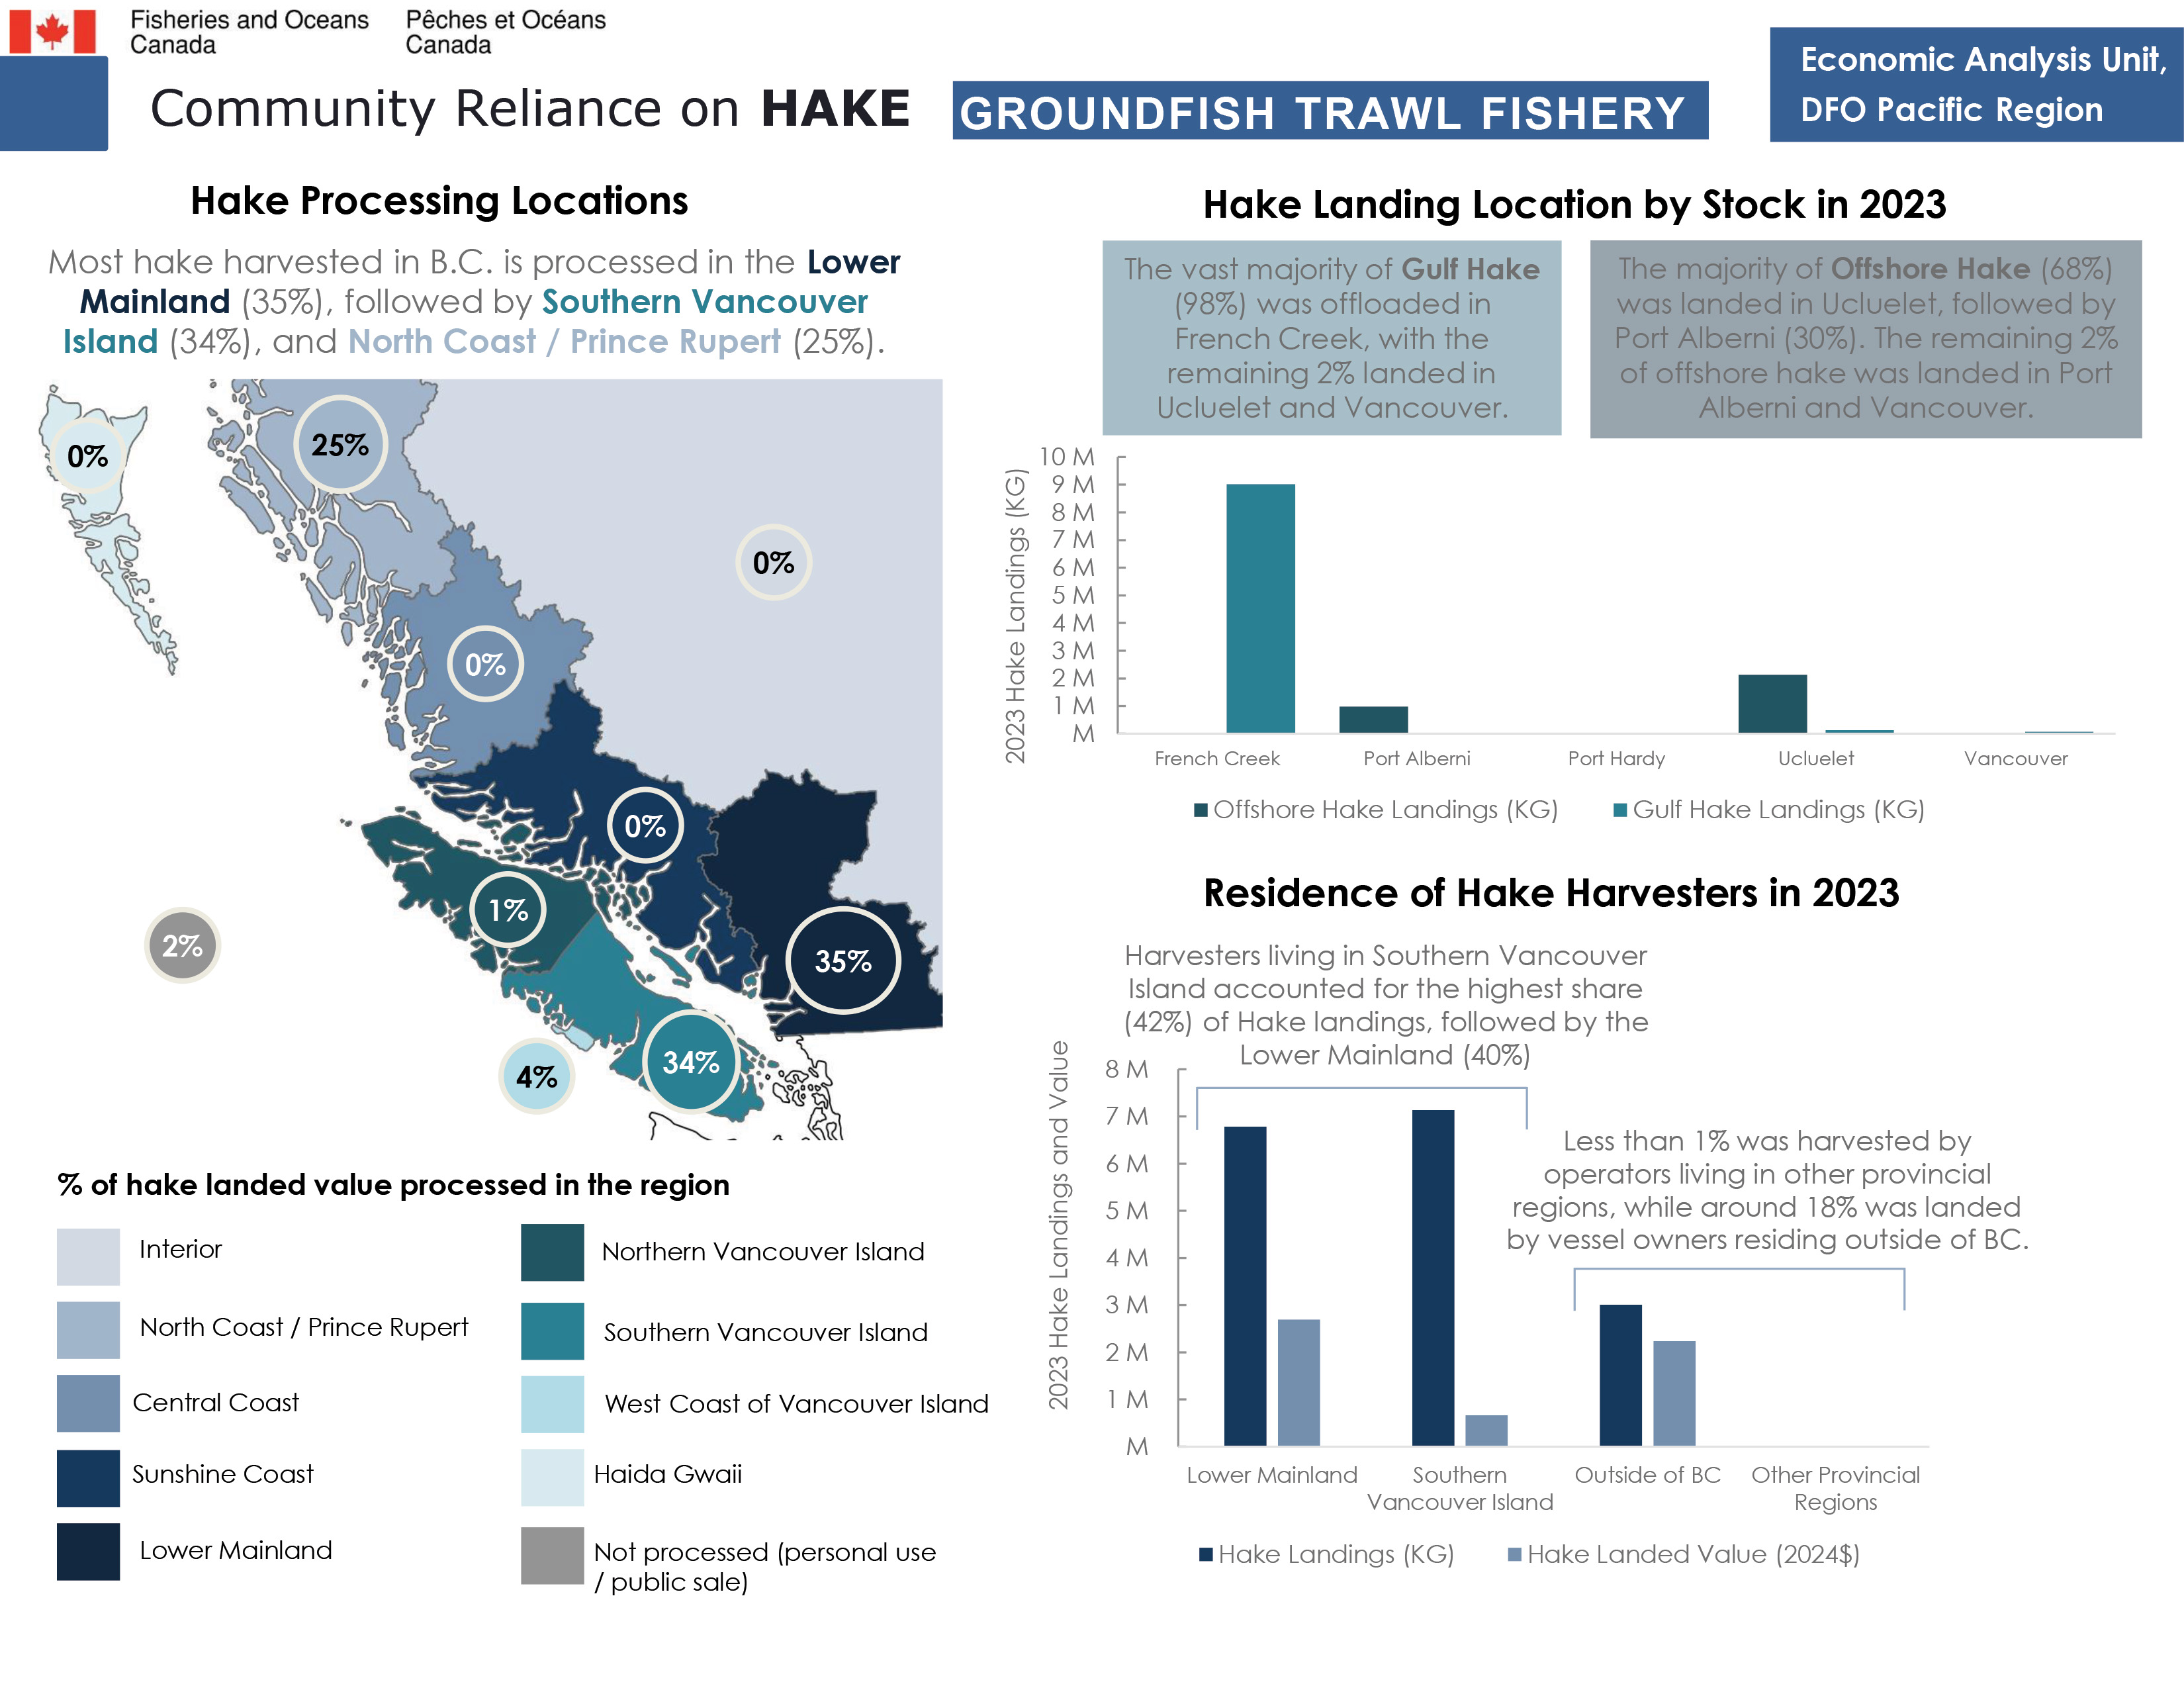
Hake processing locations
Most hake harvested in B.C. is processed in the Lower Mainland (35%), followed by southern Vancouver Island (34%), and North Coast / Prince Rupert (25%).
Percentage of hake landed value processed in the region:
- Lower Mainland: 35%
- Southern Vancouver Island: 34%
- North Coast / Prince Rupert: 25%
- West Coast of Vancouver Island: 4%
- Northern Vancouver Island: 1%
- Central Coast: 0%
- Sunshine Coast: 0%
- Haida Gwaii: 0%
- Interior: 0%
- Not processed (personal use / public sale): 2%
Hake landing location by stock in 2023
The vast majority of Gulf hake (98%) was offloaded in French Creek, with the remaining 2% landed in Ucluelet and Vancouver. The majority of offshore hake (68%) was landed in Ucluelet, followed by Port Alberni (30%). The remaining 2% of offshore hake was landed in Port Alberni and Vancouver.
2023 Hake landings (in kilograms)
French Creek
- Offshore hake landings: na
- Gulf hake landings: 9,016K KG
Port Alberni
- Offshore hake landings: 973K KG
- Gulf hake landings: na
Port Hardy
- Offshore hake landings: 2K KG
- Gulf hake landings: na
Ucluelet
- Offshore hake landings: 2,126K KG
- Gulf hake landings: 129K KG
Vancouver
- Offshore hake landings: 10K KG
- Gulf hake landings: 74K KG
Residence of hake harvesters in 2023
Harvesters living in southern Vancouver Island accounted for the highest share (42%) of hake landings, followed by the Lower Mainland (40%). Less than 1% was harvested by operators living in other provincial regions, while around 18% was landed by vessel owners residing outside of BC.
2023 Hake landings (in kilograms) and value (in 2024 dollars) by residence of harvesters
Lower Mainland
- Landings: 6.8M KG
- Landed value: $2.7M
Southern Vancouver Island
- Landings: 7.1M KG
- Landed value: $0.7M
Outside of BC
- Landings: 3.0M KG
- Landed value: $2.2M
Other Provincial Regions
- Landings: na
- Landed value: na
The tidal water recreational fishing survey data is not available for 2024. Please see the 2023 infographic for recreational values.
2023 Groundfish fishery infographic
Data
The commercial data and the recreational data that informed this work can be downloaded here.
- Date modified: