
2024 Economic profile of the BC salmon fishery
The following profile provides the socioeconomic context of the BC salmon fishery in British Columbia. It includes an overview of the commercial and recreational sectors. This overview is based on data collected from DFO commercial harvest logbooks and sale slips, public reports, and DFO surveys on harvest prices and recreational fisheries.
Long text version
2024 Economic profile of the BC salmon fishery
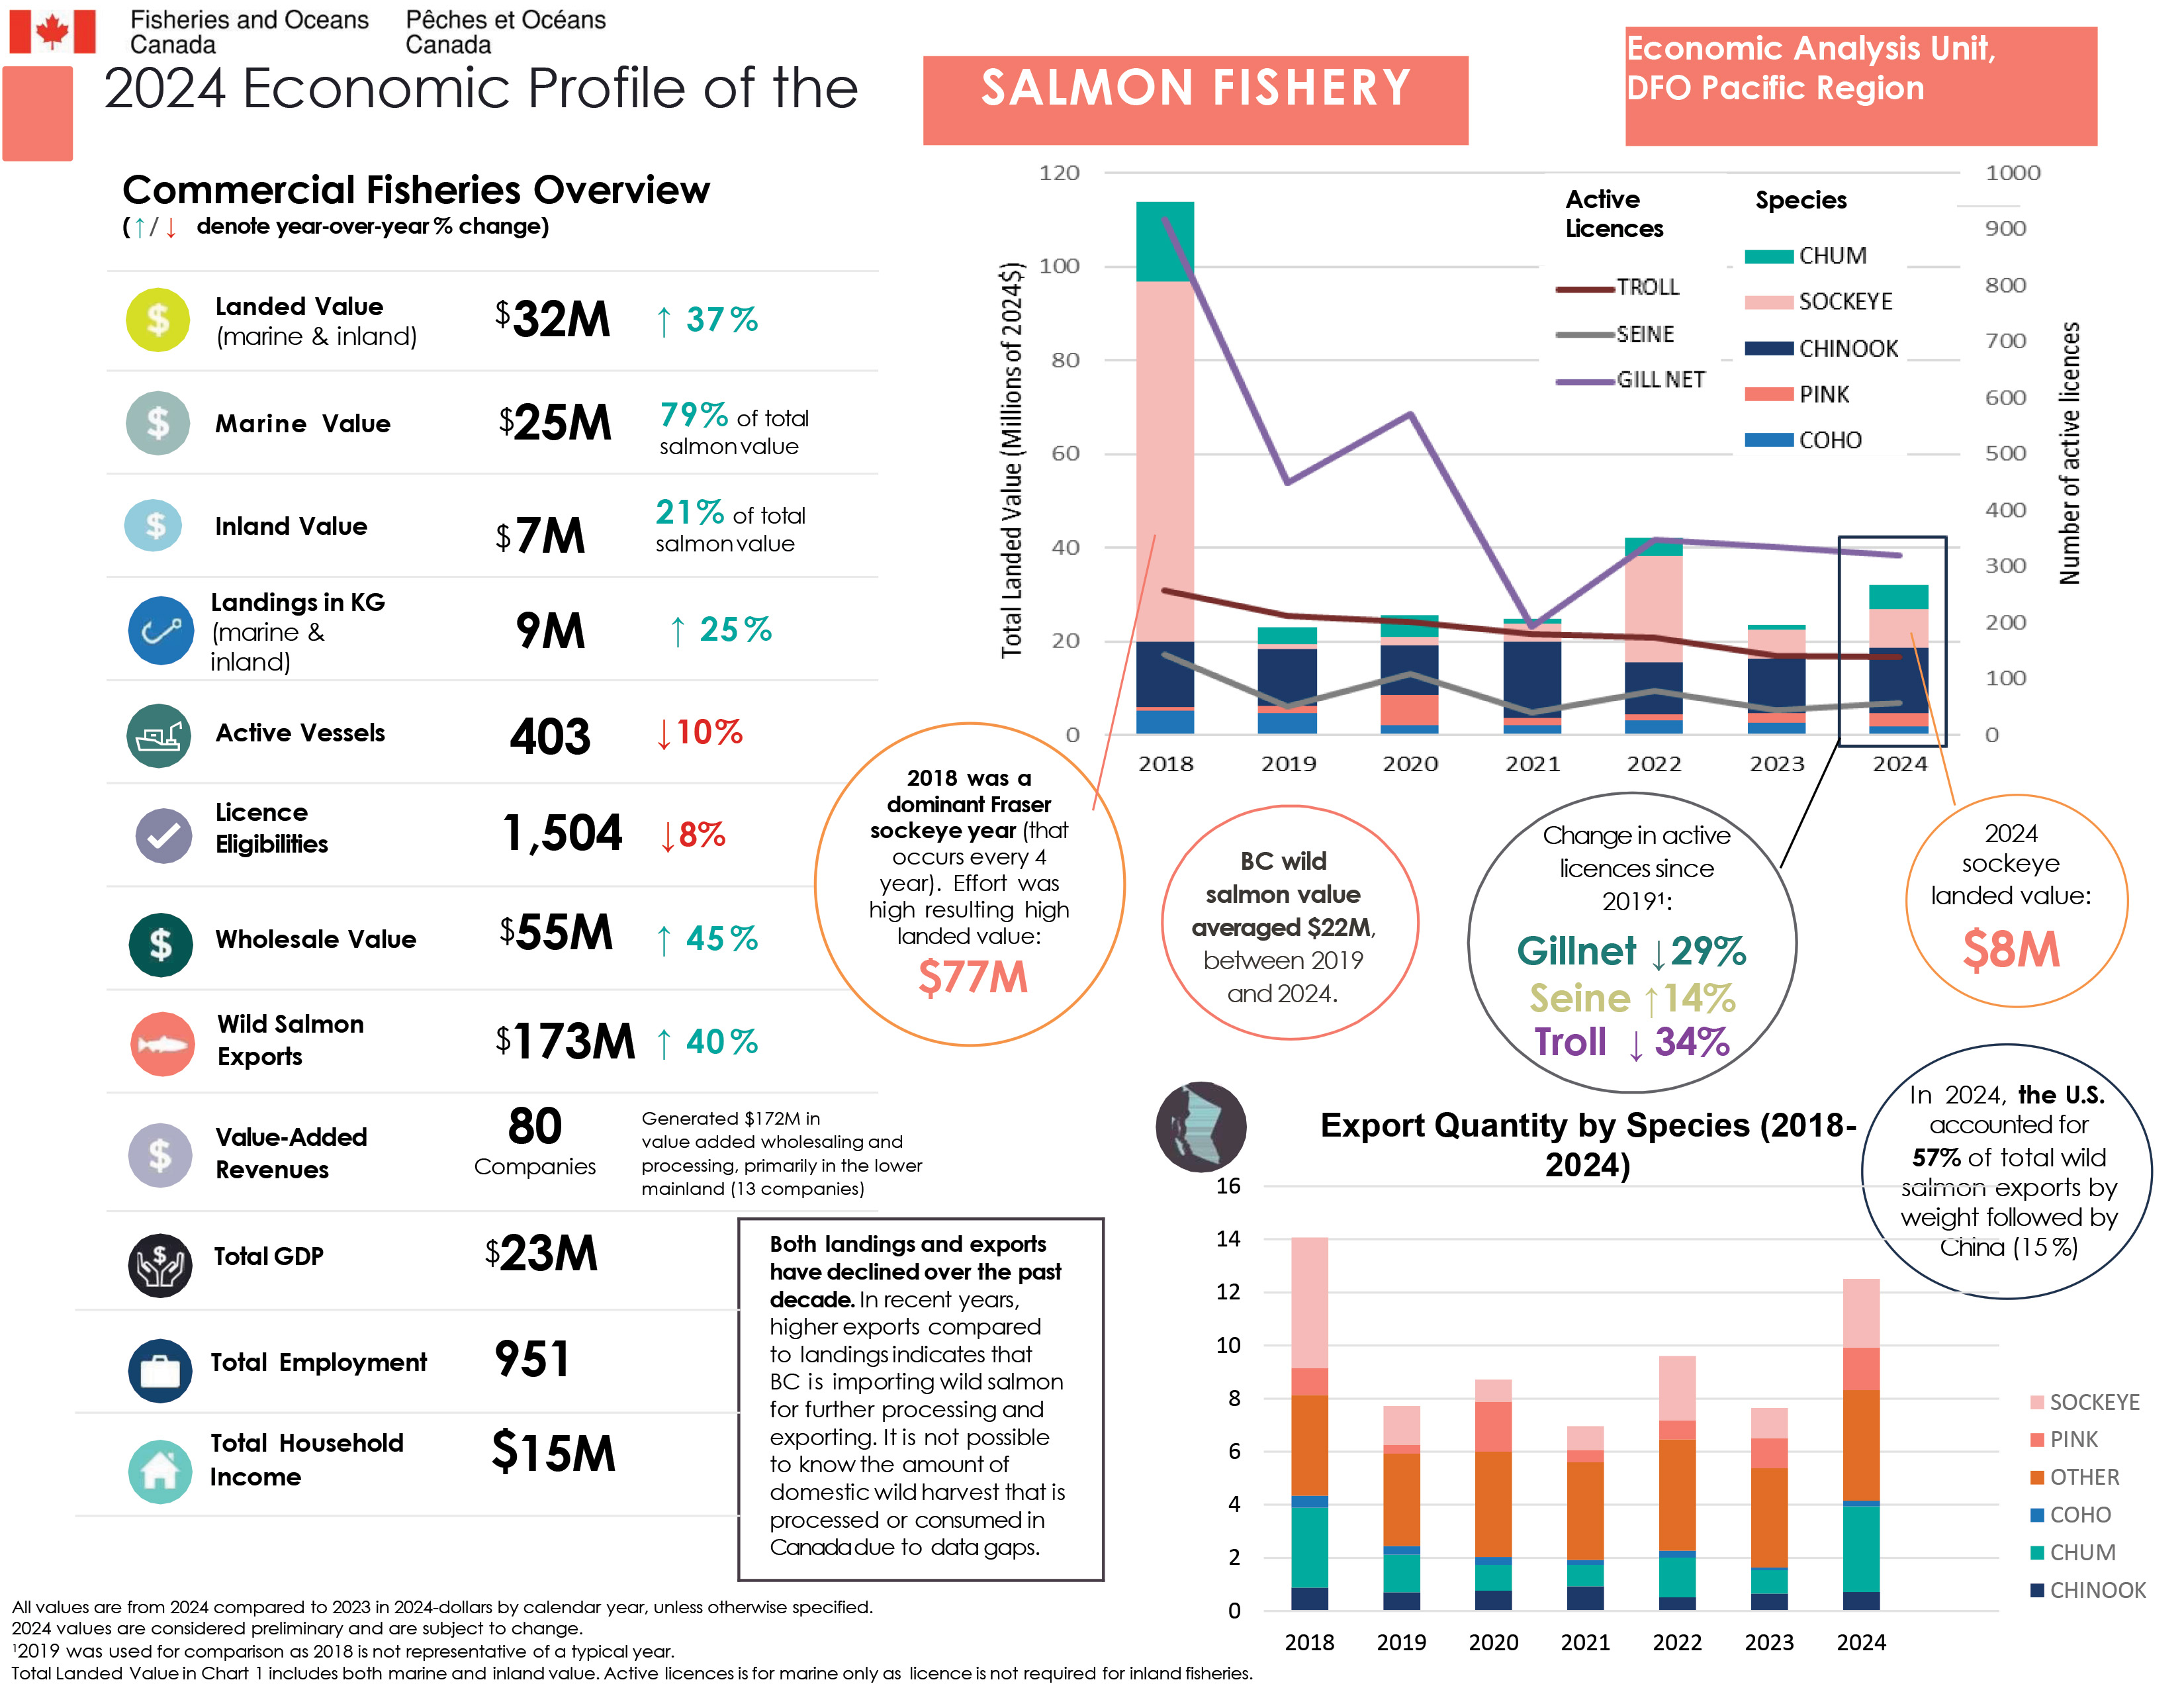
Commercial fisheries overview
All values are from 2024 compared to 2023 in 2024-dollars by calendar year, unless otherwise specified.
Key metrics for the BC Salmon Fishery, all values are from 2024 in 2024 dollars
- Landed value (marine and inland) ($32M), increased by 37% since 2023
- Marine value ($25M), accounting for 79% of total salmon value
- Inland value ($7M), accounting for 21% of total salmon value
- Landings in kilograms (marine and inland) (9M), increased by 25% since 2023
- Active vessels (403), decreased by 10% since 2023
- Licence eligibilities (1,504), decreased by 8% since 2023. Licence eligibilities represents the number of issued licences.
- Wholesale value ($55M), increased by 45% since 2023
- Wild salmon exports ($173M), increased by 40% since 2023
- Value-added revenues, 80 companies generated $172M in value added wholesaling and processing, primarily in the lower mainland (13 companies)
- Total GDP ($23M)
- Total employment (951)
- Total household income ($15 M)
2024 data are considered preliminary and subject to change.
Landed value by species and active licence count annual trend chart
Total landed value includes both marine and inland value. Active licences is for marine only as licence is not required for inland fisheries.
Landed value
- Chinook
- 2018 - $14M
- 2019 - $12M
- 2020 - $11M
- 2021 - $16M
- 2022 - $11M
- 2023 - $12M
- 2024 - $14M
- Sockeye
- 2018 - $77M
- 2019 - $1.1M
- 2020 - $1.8M
- 2021 - $3.8M
- 2022 - $23M
- 2023 - $6.3M
- 2024 - $8.4M
- Chum
- 2018 - $17M
- 2019 - $3.4M
- 2020 - $4.5M
- 2021 - $0.9M
- 2022 - $3.6M
- 2023 - $0.8M
- 2024 - $5.1M
- Coho
- 2018 - 453K KG
- 2019 - 322K KG
- 2020 - 303K KG
- 2021 - 193K KG
- 2022 - 252K KG
- 2023 - 107K KG
- 2024 - 211K KG
- Pink
- 2018 - 1.0M KG
- 2019 - 334K KG
- 2020 - 1.9M KG
- 2021 - 462K KG
- 2022 - 706K KG
- 2023 - 1.1M KG
- 2024 - 1.6M KG
- Gillnet
- 2018 - 917
- 2019 - 450
- 2020 - 571
- 2021 - 192
- 2022 - 348
- 2023 - 336
- 2024 - 320
- Seine
- 2018 - 144
- 2019 - 51
- 2020 - 109
- 2021 - 40
- 2022 - 79
- 2023 - 44
- 2024 - 58
- Troll
- 2018 - 257
- 2019 - 212
- 2020 - 202
- 2021 - 181
- 2022 - 173
- 2023 - 142
- 2024 - 140
Active licence count
2018 was a dominant Fraser sockeye year (that occurs every 4 year). Effort was high resulting high landed value at $77M.
BC wild salmon value averaged at $22M between 2019 and 2024.
Change in active licences since 2019:
- Gillnet licence count decreased by 29%
- Seine licence count increased by 14%
- Troll licence count decreased by 34%
2024 sockeye landed value is $8M
Export quantity by species (2018-2024) in kilograms
Chinook
- 2018 - 0.9M KG
- 2019 - 0.7M KG
- 2020 - 0.8M KG
- 2021 - 0.9M KG
- 2022 - 0.5M KG
- 2023 - 0.6M KG
- 2024 - 0.7M KG
Sockeye
- 2018 - 4.9M KG
- 2019 - 1.5M KG
- 2020 - 0.8M KG
- 2021 - 0.9M KG
- 2022 - 2.4M KG
- 2023 - 1.1M KG
- 2024 - 2.6M KG
Chum
- 2018 - 3.0M KG
- 2019 - 1.4M KG
- 2020 - 1.0M KG
- 2021 - 0.8M KG
- 2022 - 1.5M KG
- 2023 - 0.9M KG
- 2024 - 3.2M KG
Coho
- 2018 - 1.0M KG
- 2019 - 334K KG
- 2020 - 1.9M KG
- 2021 - 462K KG
- 2022 - 706K KG
- 2023 - 1.1M KG
- 2024 - 1.6M KG
Pink
- 2018 – 3.8M KG
- 2019 – 3.5M KG
- 2020 – 4M KG
- 2021 – 3.7M KG
- 2022 – 4.2M KG
- 2023 – 3.7M KG
- 2024 – 4.2M KG
Other
- 2018 – 3.8M KG
- 2019 – 3.5M KG
- 2020 – 4M KG
- 2021 – 3.7M KG
- 2022 – 4.2M KG
- 2023 – 3.7M KG
- 2024 – 4.2M KG
In 2024, the U.S. accounted for 57% of total wild salmon exports by weight followed by China (15%).
Both landings and exports have declined over the past decade. In recent years, higher exports compared to landings indicates that BC is importing wild salmon for further processing and exporting. However, due to a lack of available data that distinguishes between imported and domestically harvested wild salmon at the processing or consumption stage, it is not possible to determine how much domestic harvest is processed or consumed within Canada.
Long text version
2024 Economic profile of the BC salmon fishery
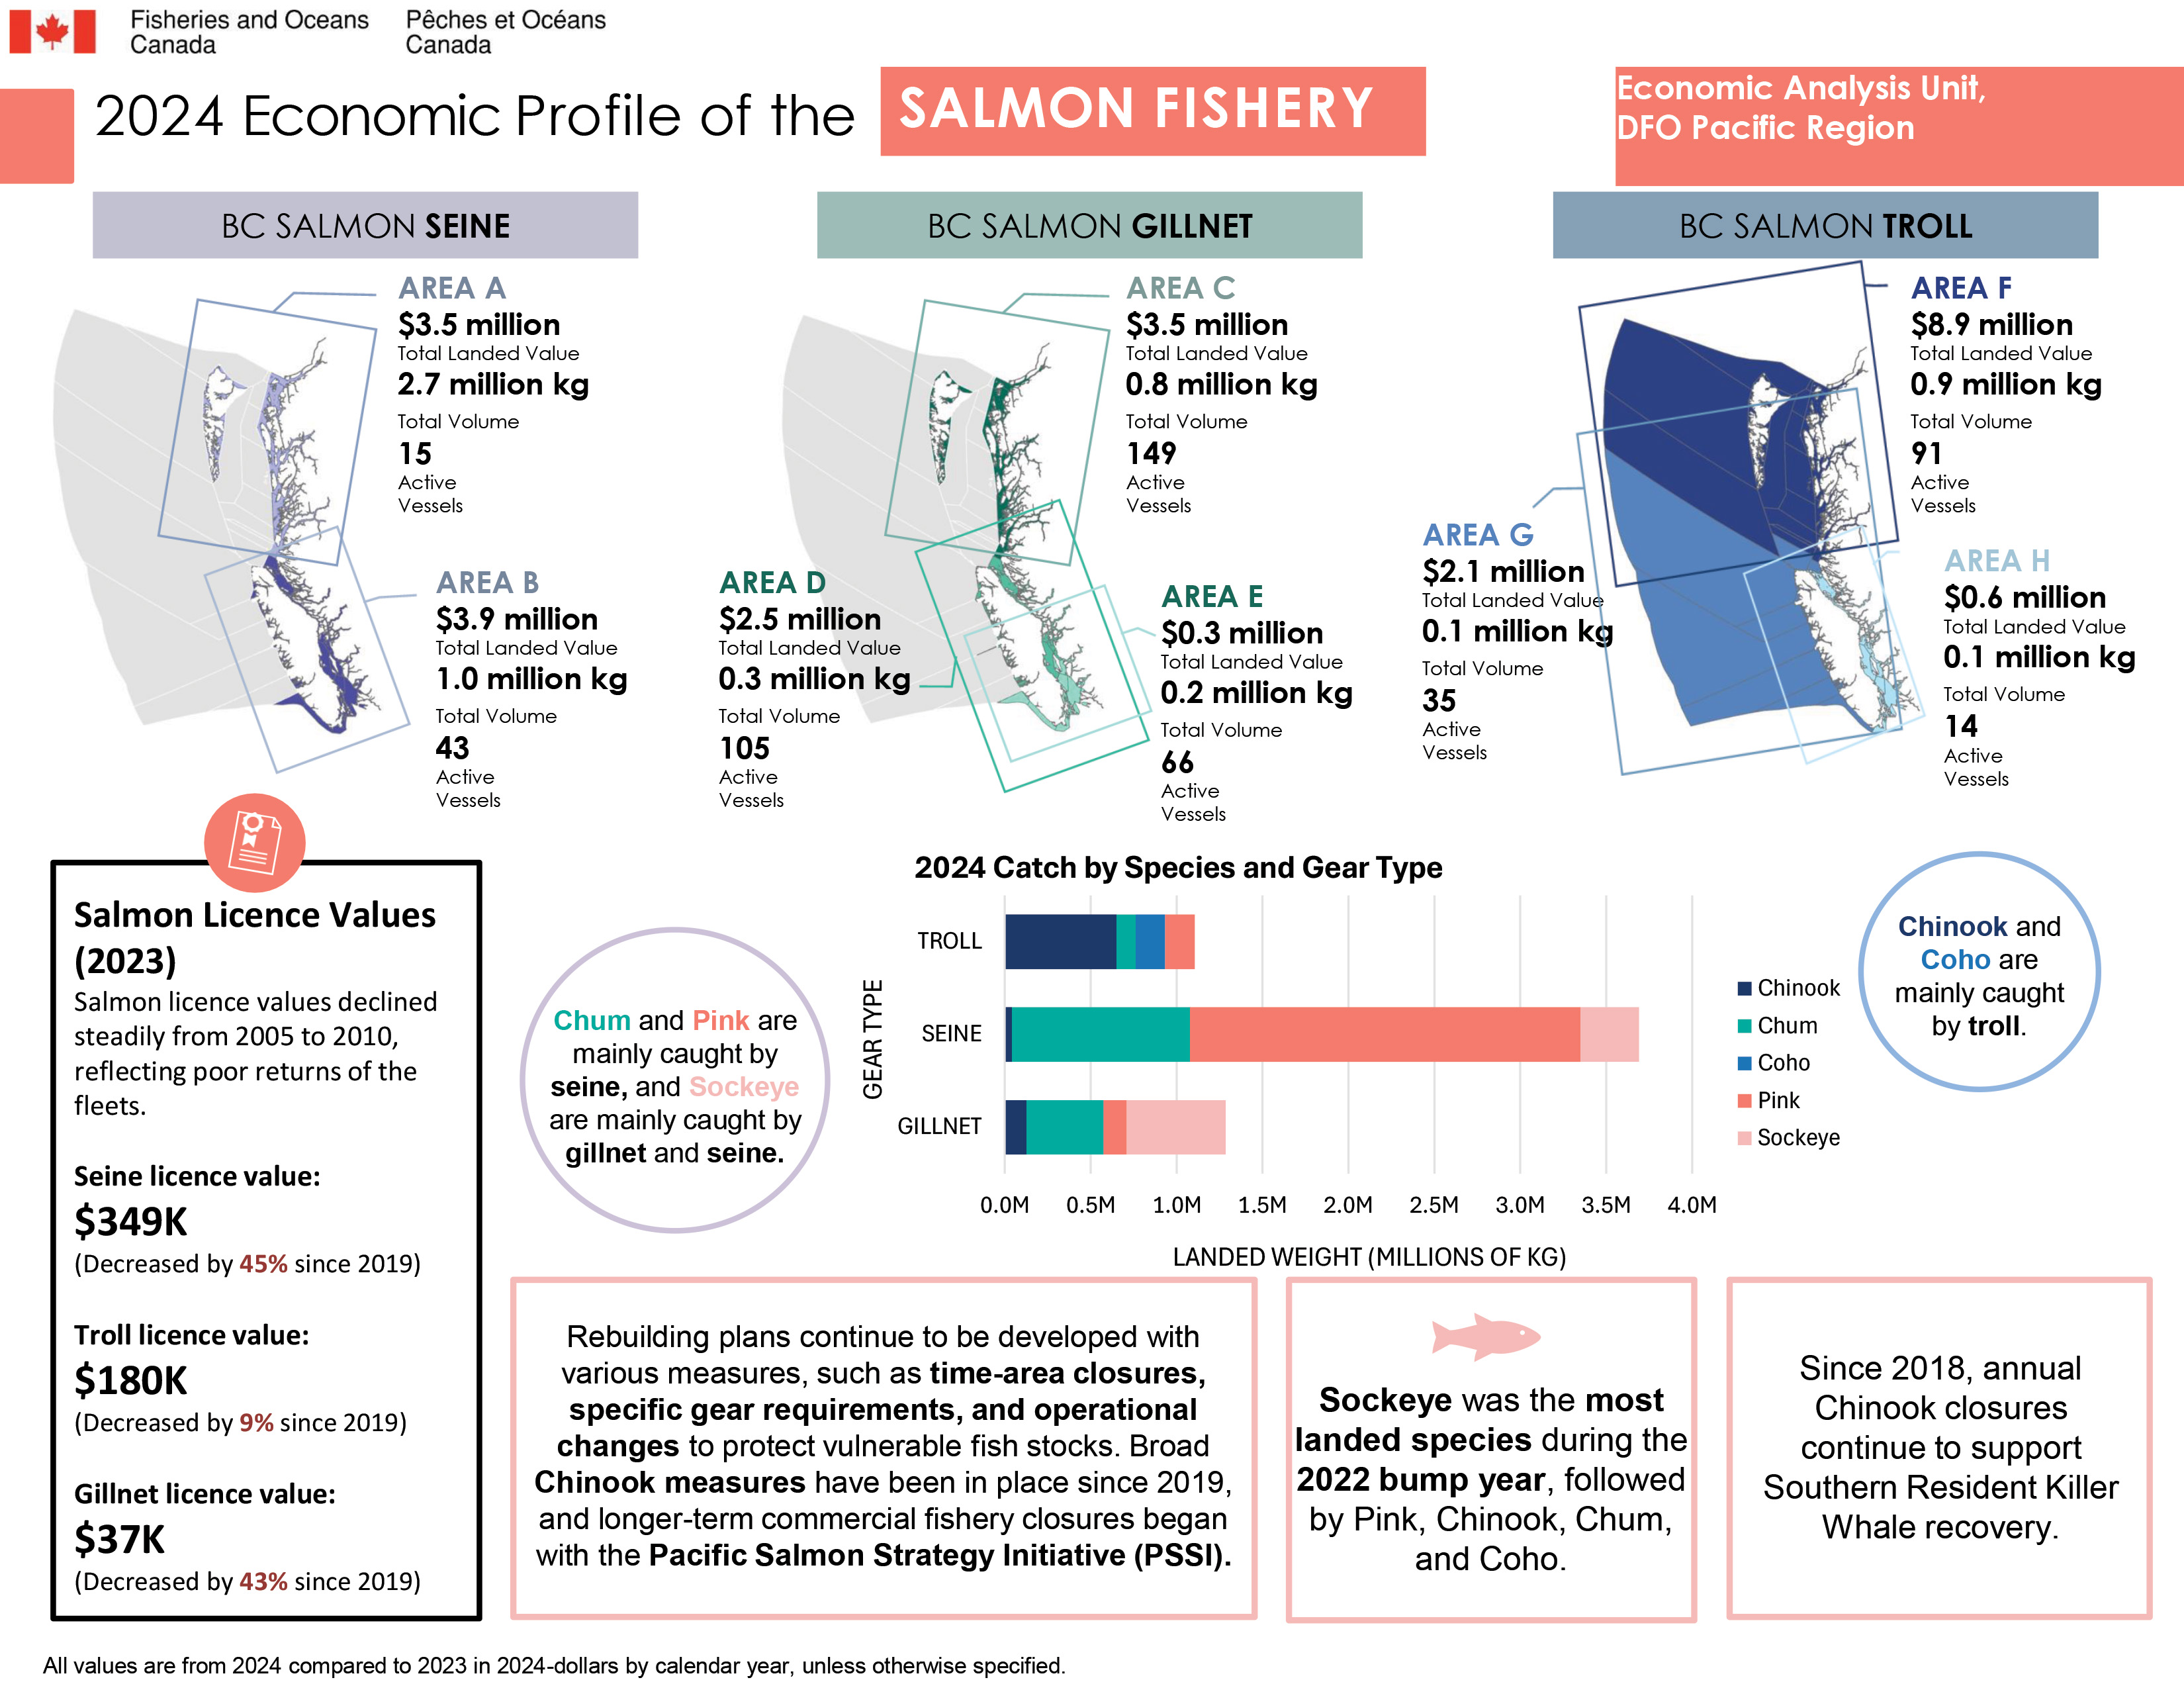
Key metrics by BC salmon fishing area
All values are from 2024 compared to 2023 in 2024-dollars by calendar year, unless otherwise specified.
BC salmon seine
Area A
- Total landed value $3.5 million
- Total volume 2.7 million kilograms
- Active vessels 15
Area B
- Total landed value $3.9 million
- Total volume 1.0 million kilograms
- Active vessels 43
BC salmon gillnet
Area C
- Total landed value $3.5 million
- Total volume 0.8 million kilograms
- Active vessels 149
Area D
- Total landed value $2.5 million
- Total volume 0.3 million kilograms
- Active vessels 105
Area E
- Total landed value $0.3 million
- Total volume 0.2 million kilograms
- Active vessels 66
BC salmon troll
Area F
- Total landed value $8.9 million
- Total volume 0.9 million kilograms
- Active vessels 91
Area G
- Total landed value $2.1 million
- Total volume 0.1 million kilograms
- Active vessels 35
Area H
- Total landed value $0.6 million
- Total volume 0.1 million kilograms
- Active vessels 14
2024 Catch by species and gear type (in kilograms)
Chinook
- Gillnet - 127K KG
- Seine - 43K KG
- Troll - 650K KG
Chum
- Gillnet - 448K KG
- Seine - 1,035K KG
- Troll - 113K KG
Coho
- Gillnet 170 KG
- Seine 629 KG
- Troll 171K KG
Pink
- Gillnet - 135K KG
- Seine - 2,271K KG
- Troll - 171K KG
Sockeye
- Gillnet - 575K KG
- Seine - 341K KG
- Troll - 1,118 KG
Chum and Pink are mainly caught by seine, and Sockeye are mainly caught by gillnet and seine.
Chinook and Coho are mainly caught by troll.
Salmon licence values (2023)
Salmon licence values declined steadily from 2005 to 2010, reflecting poor returns to the fleets.
- Seine licence value: $349K, decreased by 45% since 2019
- Troll licence value: $180K, decreased by 9% since 2019
- Gillnet licence value: $37K, decreased by 43% since 2019
Rebuilding plans continue to be developed with various measures, such as: time-area closures, specific gear requirements, and operational changes to protect vulnerable fish stocks. Broad Chinook measures have been in place since 2019, and longer-term commercial fishery closures began with the Pacific Salmon Strategy Initiative (PSSI).
Sockeye was the most landed species during the 2022 bump year, followed by Pink, Chinook, Chum, and Coho.
Since 2018, annual Chinook closures continue to support Southern Resident Killer Whale recovery.
Long text version
2024 Economic profile of the BC salmon fishery
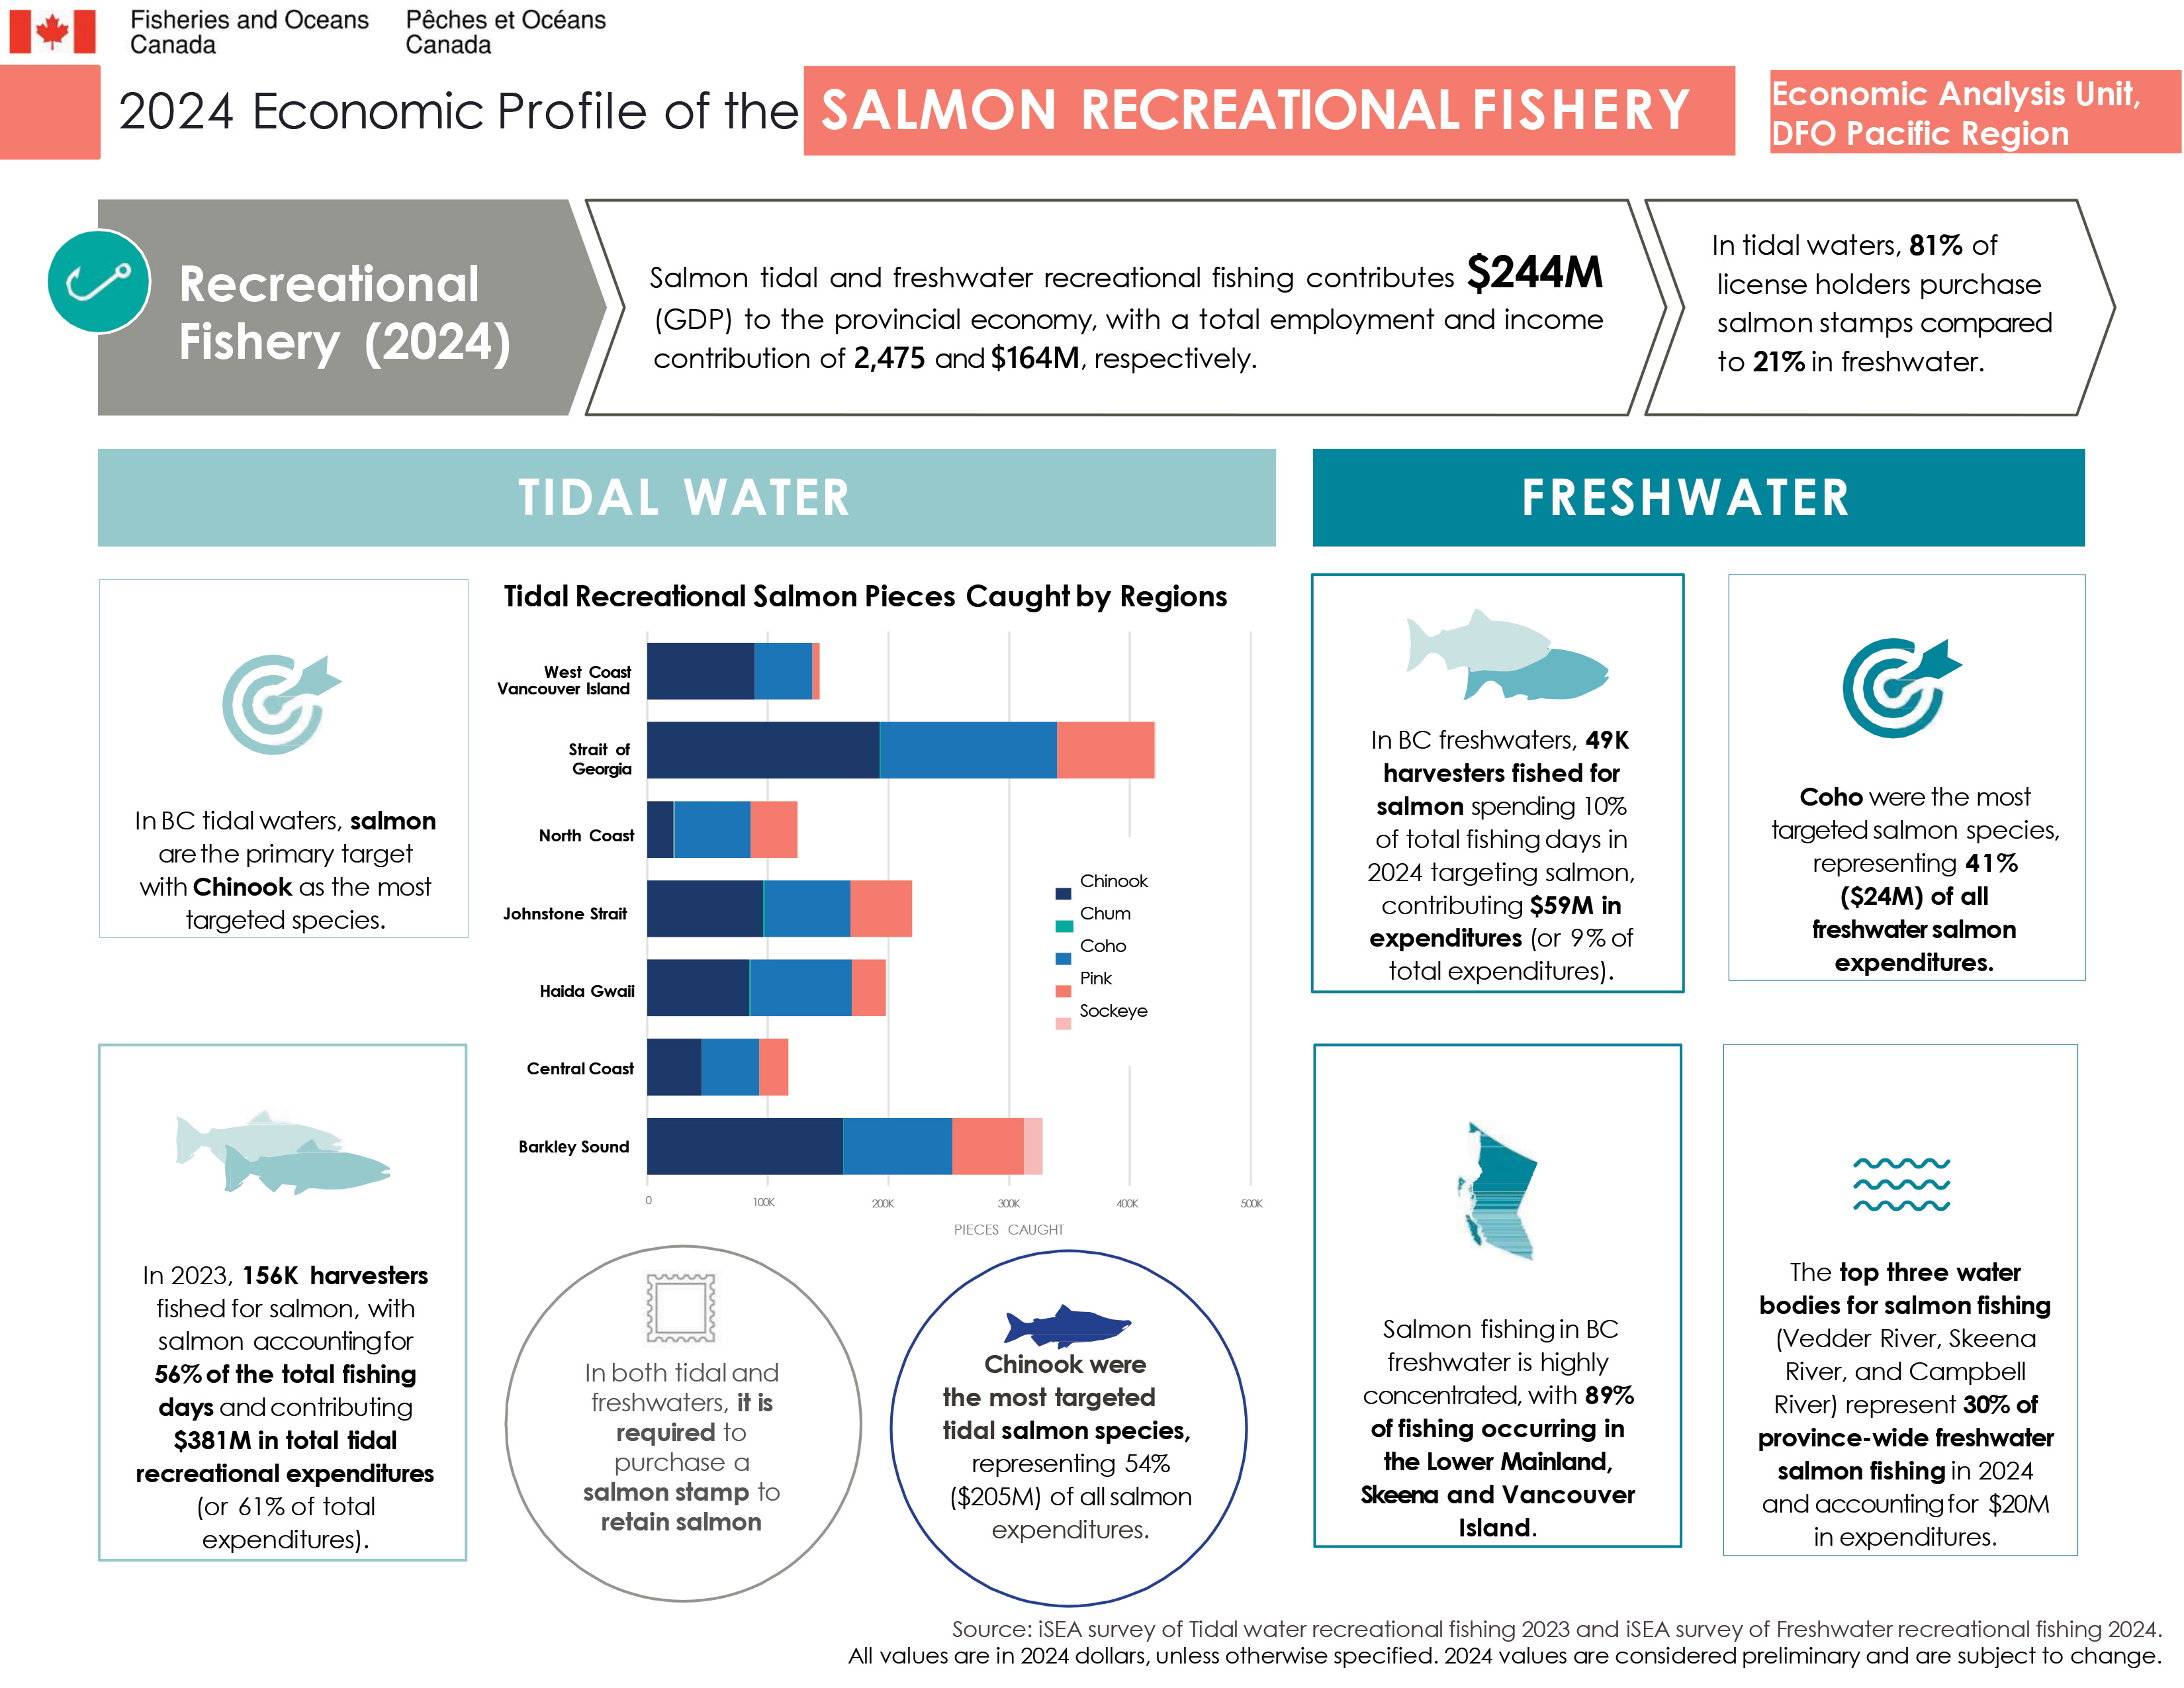
Economic profile of the salmon recreational fishery
All values are in 2024 dollars, unless otherwise specified.
Salmon tidal and freshwater recreational fishing contributes $244M (GDP) to the provincial economy, with a total employment and income contribution of 2,475 and $164M, respectively.
In tidal waters, 81% of licence holders purchase salmon stamps compared to 21% in freshwater.
Tidal water
In BC tidal waters, salmon are the primary target with Chinook as the most targeted species.
In 2023, 156K recreational fishers fished for salmon, with salmon accounting for 56% of the total fishing days and contributing $381M in total tidal recreational expenditures (or 61% of total expenditures).
In both tidal and freshwaters, it is required to purchase a salmon stamp to retain salmon.
Chinook were the most targeted tidal salmon species, representing 54% ($205M) of all salmon expenditures.
Tidal recreational salmon pieces caught by regions
West Coast Vancouver Island
- Chinook – 89,341 pieces
- Chum – 49 pieces
- Coho – 47,708 pieces
- Pink – 5,880 pieces
- Sockeye – 325 pieces
Strait of Georgia
- Chinook – 192,802 pieces
- Chum – 909 pieces
- Coho – 146,130 pieces
- Pink – 80,525 pieces
- Sockeye – 874 pieces
North Coast
- Chinook – 22,006 pieces
- Chum – 742 pieces
- Coho – 63,371 pieces
- Pink – 38,120 pieces
- Sockeye – 589 pieces
Johnstone Strait
- Chinook – 96,195 pieces
- Chum – 1,602 pieces
- Coho – 70,885 pieces
- Pink – 50,821 pieces
- Sockeye – 570 pieces
Haida Gwaii
- Chinook – 84,631 pieces
- Chum – 1,430 pieces
- Coho – 83,603 pieces
- Pink – 28,074 pieces
- Sockeye – 514 pieces
Central Coast
- Chinook – 45,422 pieces
- Chum – 456 pieces
- Coho – 47,250 pieces
- Pink – 23,782 pieces
- Sockeye – 310 pieces
Barkley Sound
- Chinook – 162,518 pieces
- Chum – 491 pieces
- Coho – 89,939 pieces
- Pink – 59,380 pieces
- Sockeye – 15,598 pieces
Freshwater
In BC freshwaters, 49K recreational fishers fished for salmon spending 10% of total fishing days in 2024 targeting salmon, contributing $59M in expenditures (or 9% of total expenditures).
Coho were the most targeted salmon species, representing 41% ($24M) of all freshwater salmon expenditures.
Salmon fishing in BC freshwater is highly concentrated, with 89% of fishing occurring in the Lower Mainland, Skeena, and Vancouver Island.
The top three water bodies for salmon fishing (Vedder River, Skeena, and Campbell River) represent 30% of province-wide freshwater salmon fishing in 2024 and accounting for $20M in expenditures.
Source:
- iSEA survey of Tidal water recreational fishing 2023.
- iSEA survey of Freshwater recreational fishing 2024.
Data
The commercial data and the recreational data that informed this work can be downloaded here.
- Date modified: