
Commercial salmon fishing economic contribution and profile in 2024
Long text version
Commercial value of the wild salmon (2020 to 2023) - preliminary draft
Overview
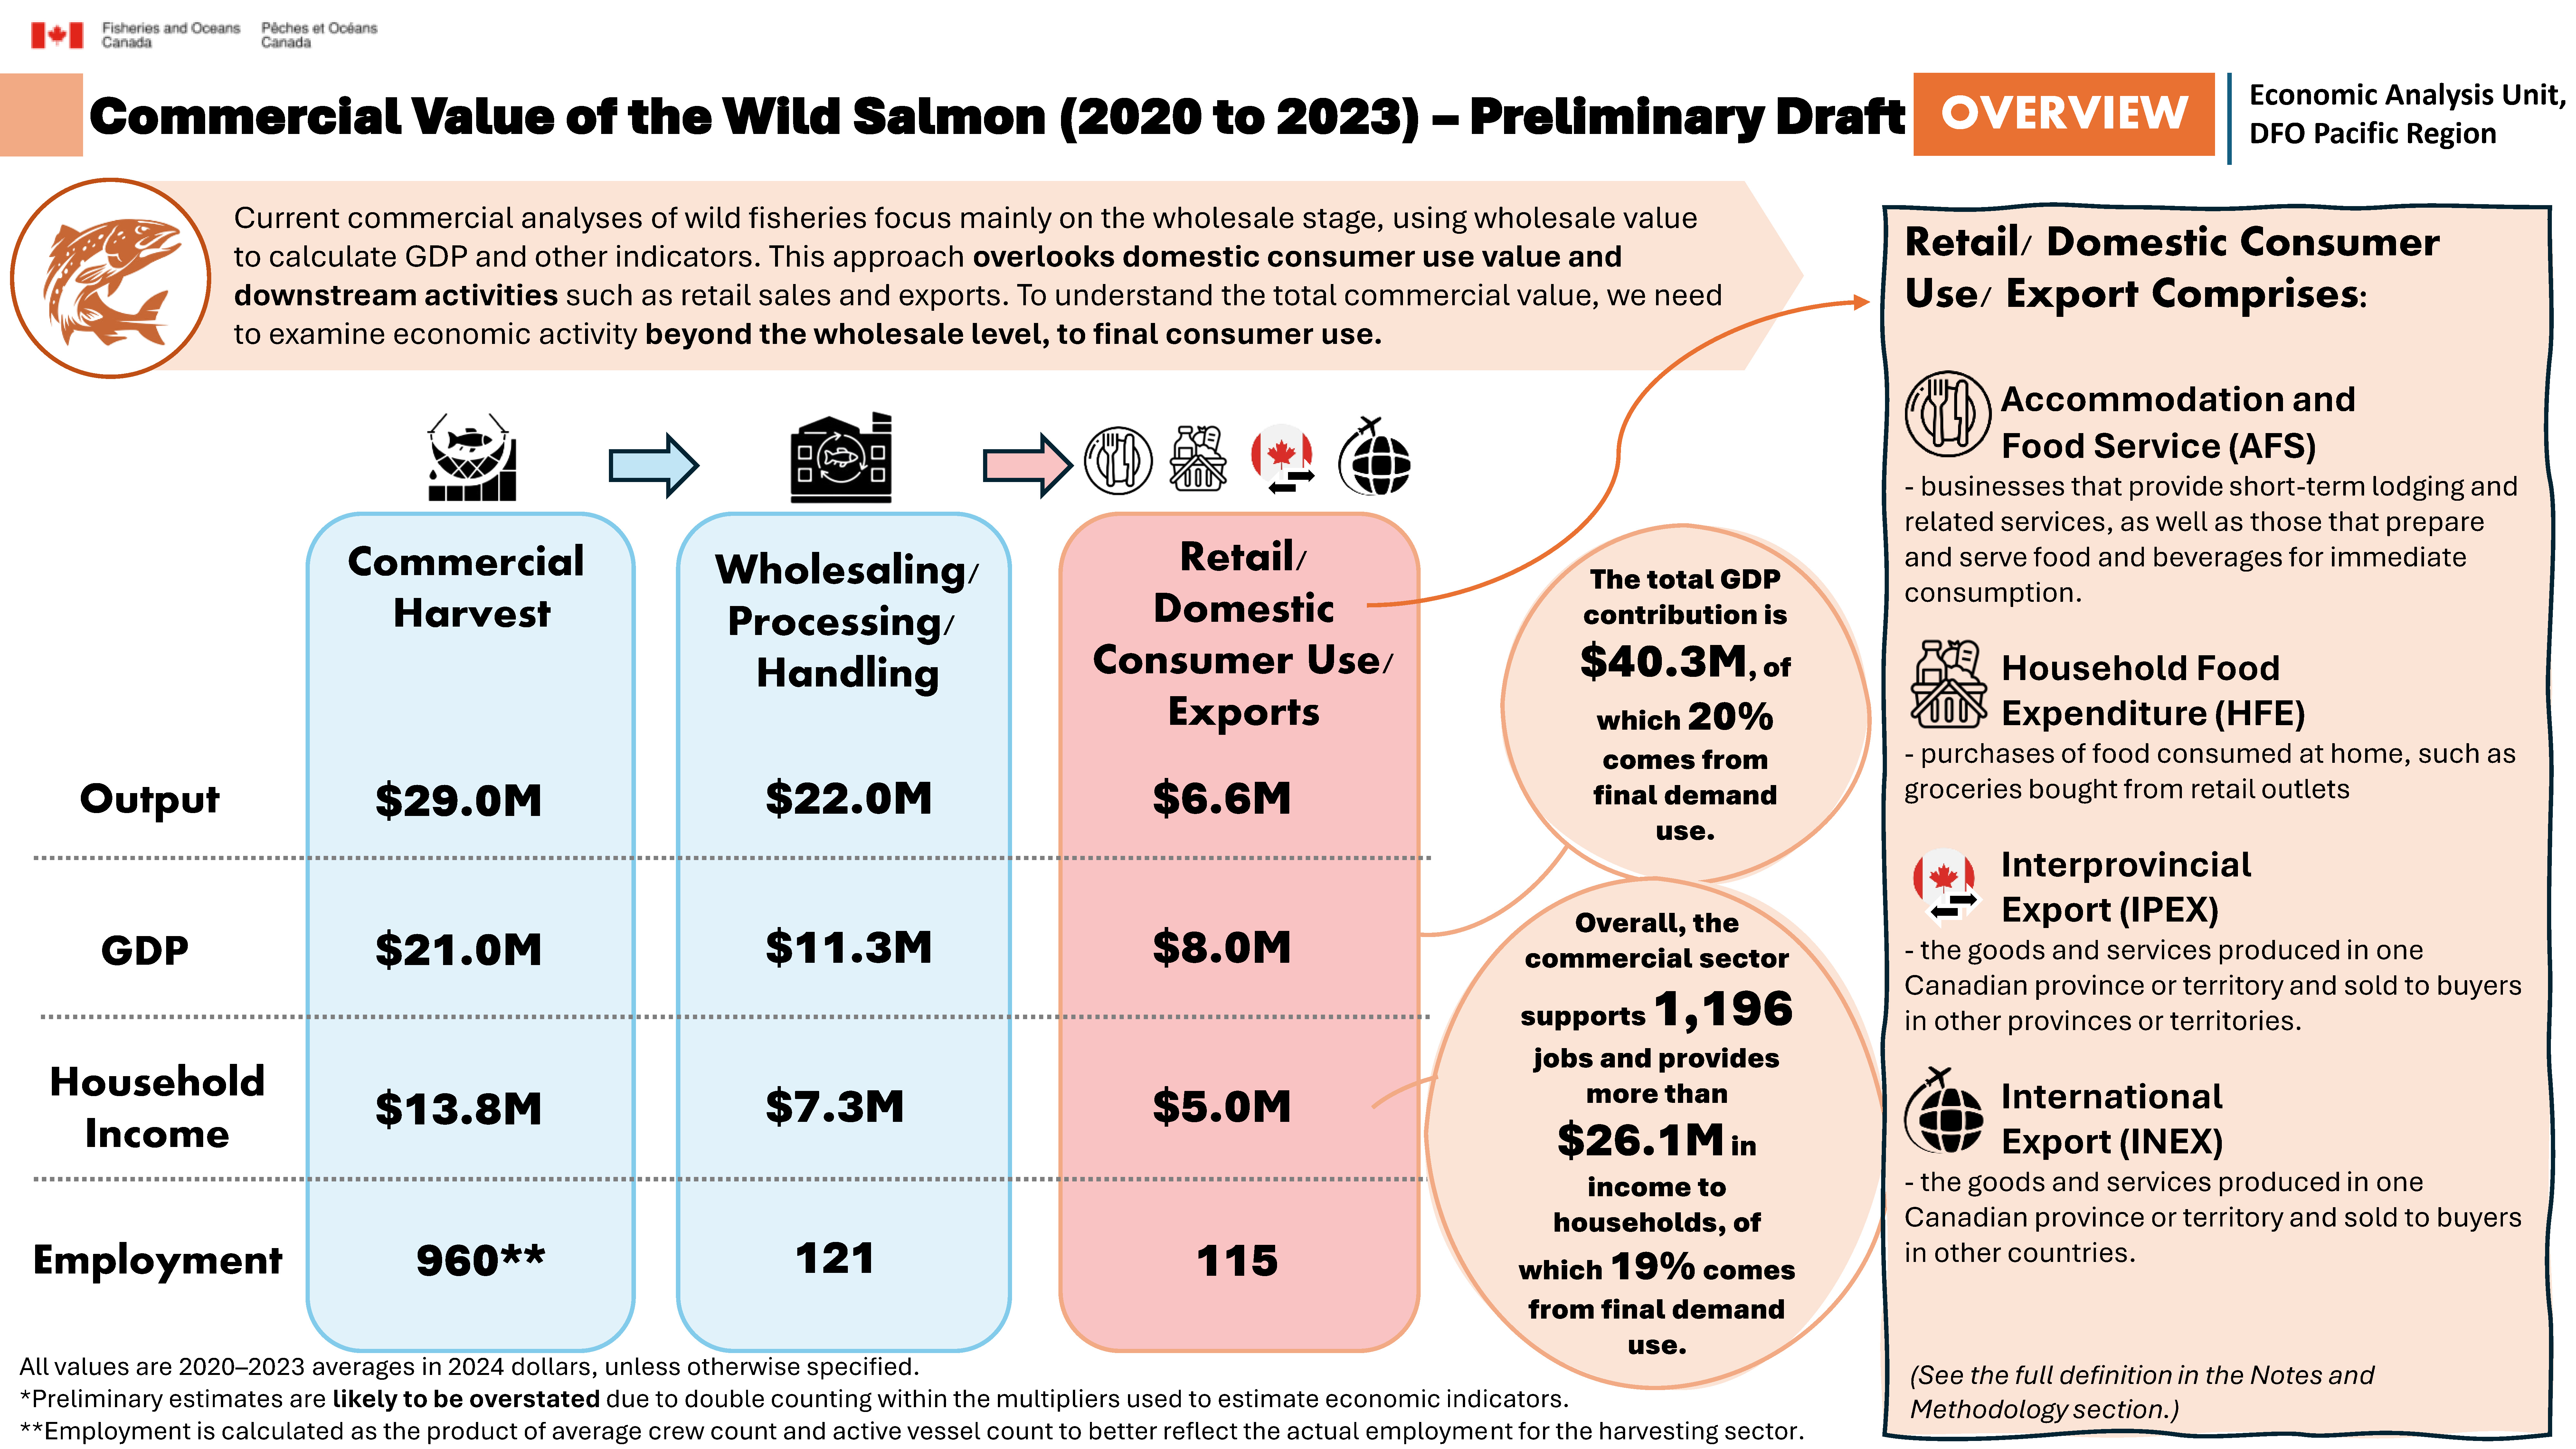
Current commercial analyses of wild fisheries focus mainly on the wholesale stage, using wholesale value to calculate GDP and other indicators. This approach overlooks domestic consumer use value and downstream activities such as retail sales and exports. To understand the total commercial value, we need to examine economic activity beyond the wholesale level, to final consumer use.
Economic metrics by value chain stage
All values are 2020–2023 averages in 2024 dollars, unless otherwise specified.
Preliminary estimates are likely to be overstated due to double counting within the multipliers used to estimate economic indicators.
Retail / Domestic consumer use / Export category comprises:
- Accommodation and food service (AFS): businesses that provide short-term lodging and related services, as well as those that prepare and serve food and beverages for immediate consumption.
- Household food expenditure (HFE): purchases of food consumed at home, such as groceries bought from retail outlets.
- Interprovincial export (IPEX): the goods and services produced in one Canadian province or territory and sold to buyers in other provinces or territories.
- International export (INEX): the goods and services produced in one Canadian province or territory and sold to buyers in other countries.
See the full definition in the notes and methodology page.
Commercial harvest
- Output: $29.0M
- GDP: $21.0M
- Household income: $13.8M
- Employment: 960 (employment is calculated as the product of average crew count and active vessel count to better reflect the actual employment for the harvesting sector)
Wholesaling / processing / handling
- Output: $22.0M
- GDP: $11.3M
- Household income: $7.3M
- Employment: 121
Retail / domestic consumer use / exports
- Output: $6.6M
- GDP: $8.0M
- Household income: $5.0M
- Employment: 115
The total GDP contribution is $40.3M, of which 20% comes from final demand use.
Overall, the commercial sector supports 1,196 jobs and provides more than $26.1M in income to households, of which 19% comes from final demand use.
Long text version
Total value of the wild salmon fishery in British Columbia - preliminary draft
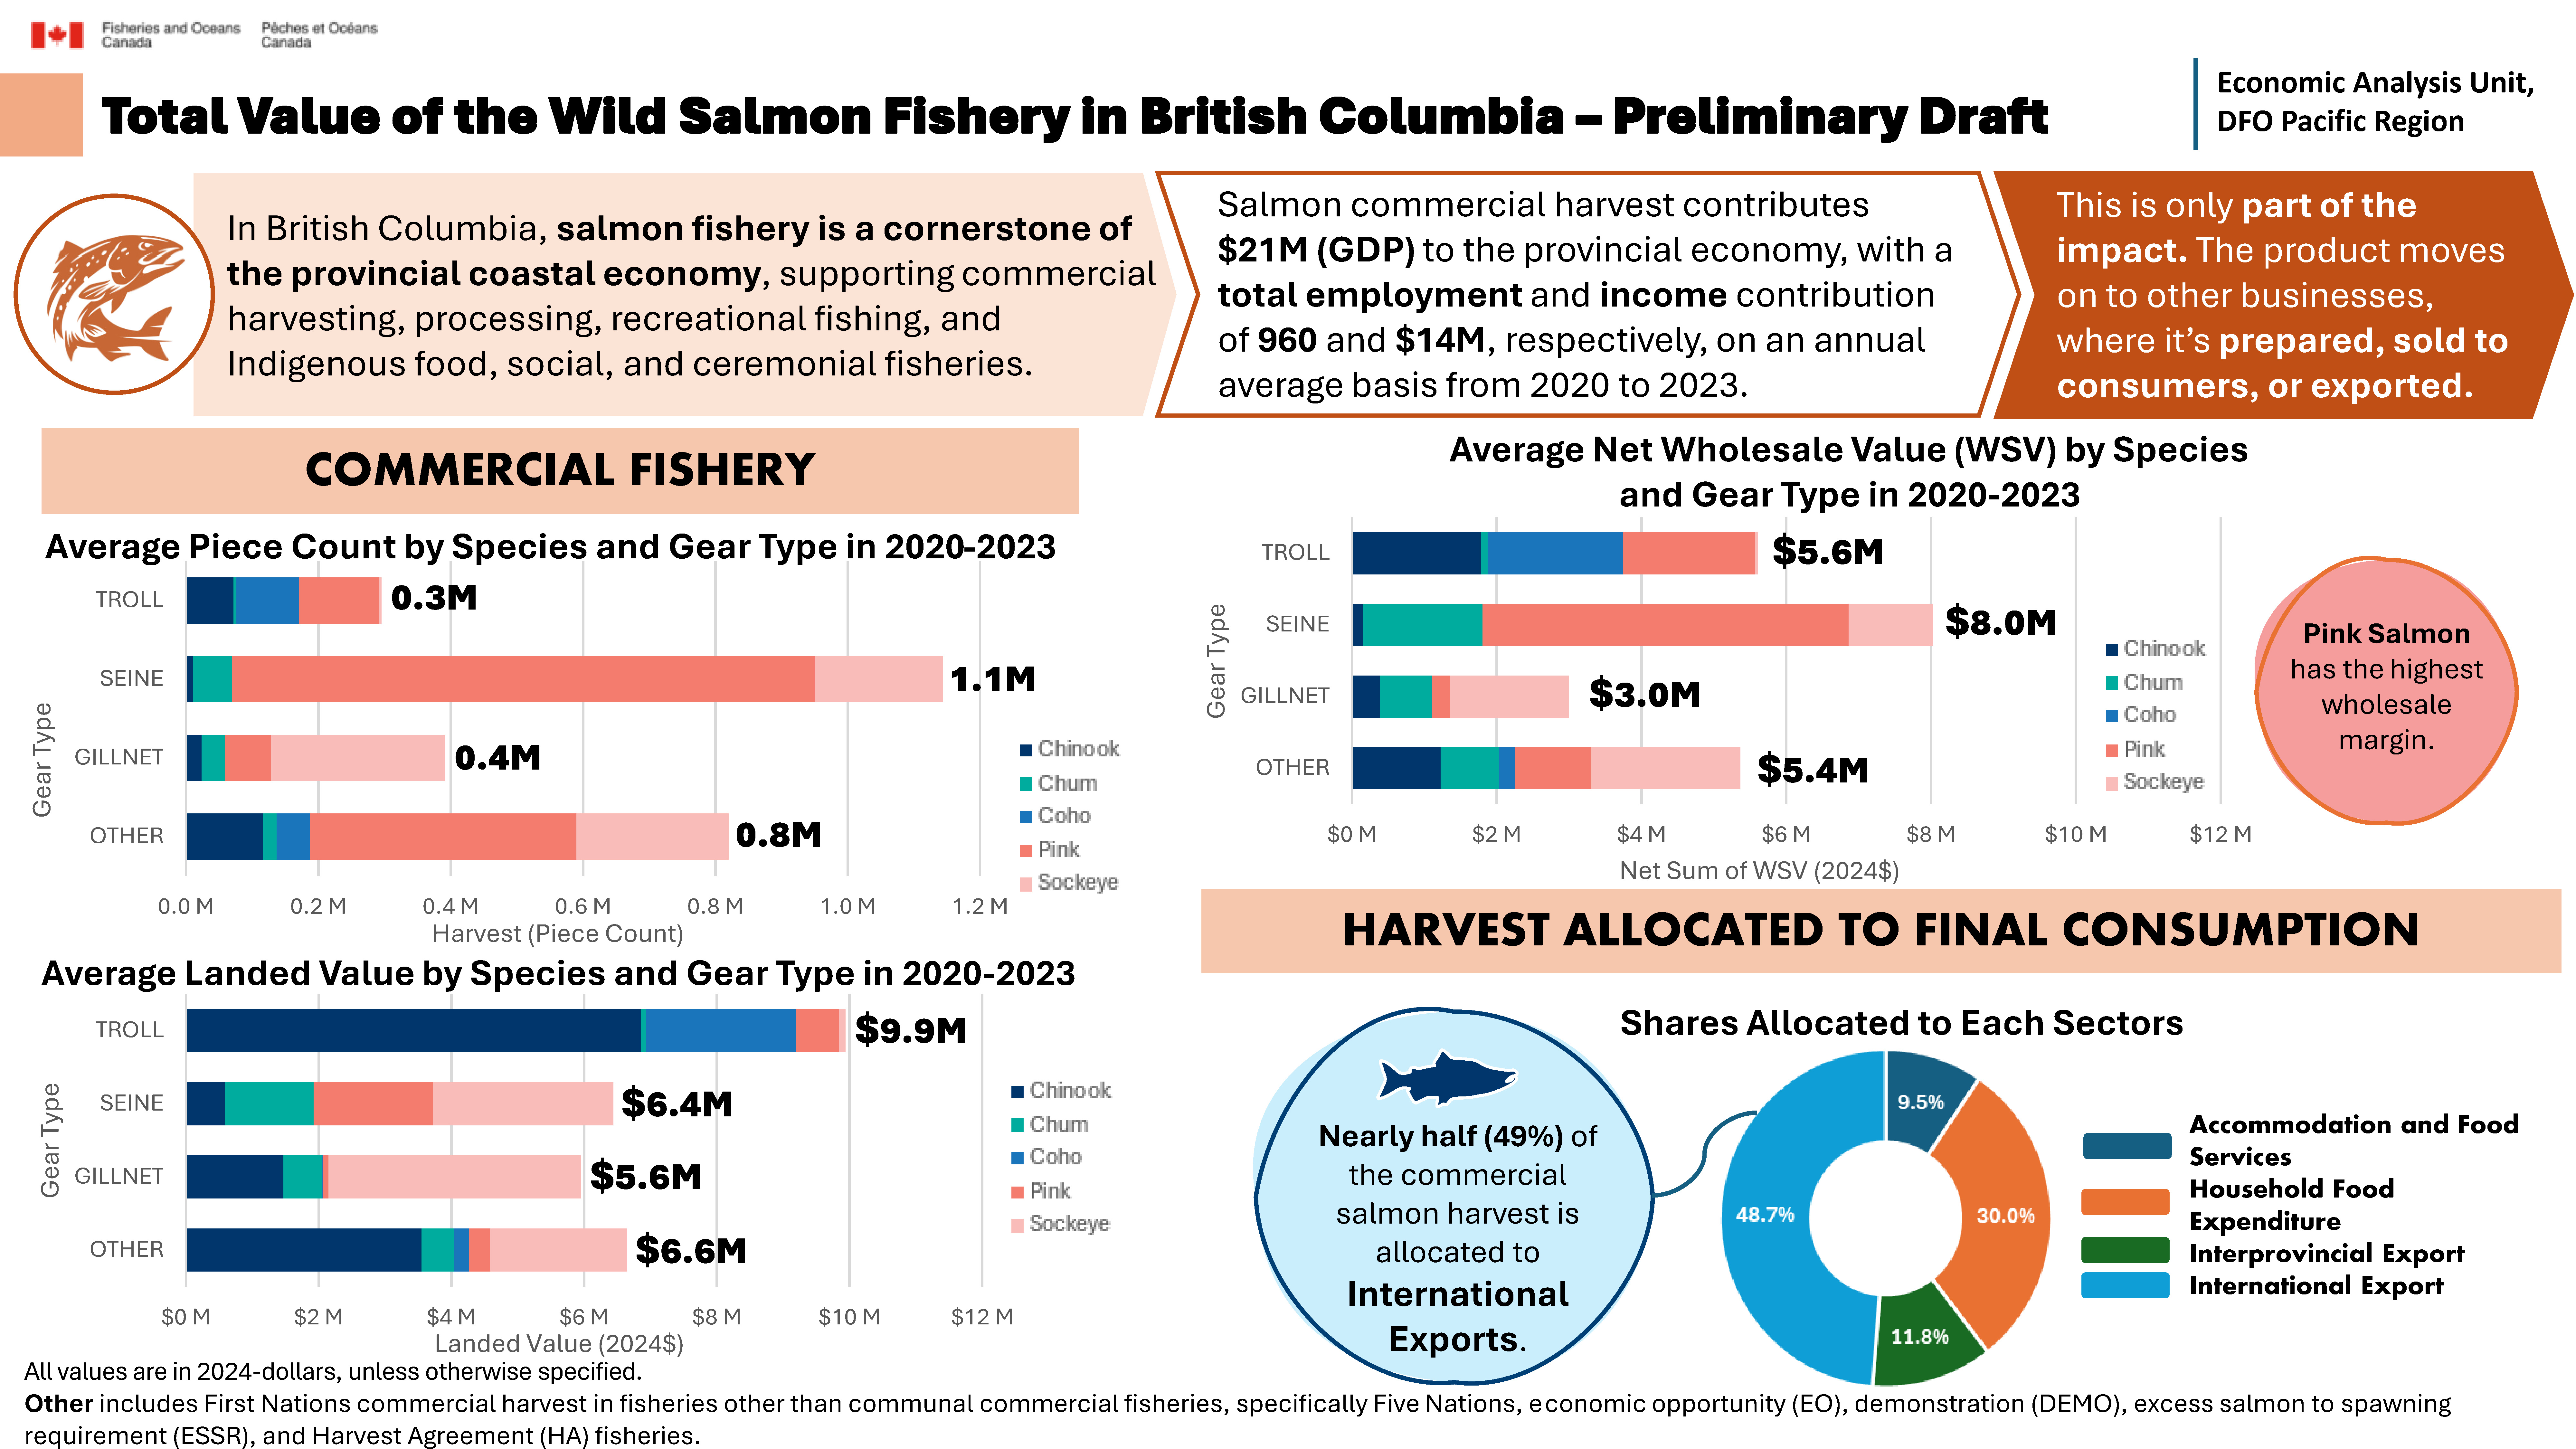
In British Columbia, salmon fishery is a cornerstone of the provincial coastal economy, supporting commercial harvesting, processing, recreational fishing, and Indigenous food, social, and ceremonial fisheries.
The salmon commercial harvest contributes $21M (GDP) to the provincial economy, with a total employment and income contribution of 960 and $14M, respectively, on an annual average basis from 2020 to 2023.
However, this is only part of the impact. The product moves on to other businesses, where it is prepared, sold to consumers, or exported.
All values are in 2024 dollars, unless otherwise specified.
Other includes First Nations commercial harvest in fisheries other than communal commercial fisheries, specifically Five Nations, economic opportunity (EO), demonstration (DEMO), excess salmon to spawning requirement (ESSR), and Harvest Agreement (HA) fisheries.
Commercial fishery
Average piece count all species by gear type in 2020-2023
- Troll: 0.3M
- Seine: 1.1M
- Gillnet: 0.4M
- Other: 0.8M
Average piece count by species and gear type in 2020-2023
Chinook
- Troll: 0.07M
- Seine: 0.01M
- Gillnet: 0.02M
- Other: 0.12M
Chum
- Troll: 4.36K
- Seine: 0.06M
- Gillnet: 0.04M
- Other: 0.02M
Coho
- Troll: 0.09M
- Seine: 0.08K
- Gillnet: 0.19K
- Other: 0.05M
Pink
- Troll: 0.12M
- Seine: 0.9M
- Gillnet: 0.07M
- Other: 0.40M
Sockeye
- Troll: 4.14K
- Seine: 0.19M
- Gillnet: 0.26M
- Other: 0.23M
Average landed value all species by gear type in 2020-2023
- Troll: $9.9M
- Seine: $6.4M
- Gillnet: $5.6M
- Other: $6.6M
Average landed value by species and gear type in 2020-2023
Chinook
- Troll: $6.86M
- Seine: $0.59M
- Gillnet: $1.47M
- Other: $3.56M
Chum
- Troll: $0.08M
- Seine: $1.33M
- Gillnet: $0.58M
- Other: $0.48M
Coho
- Troll: $2.25M
- Seine: $1.8K
- Gillnet: $0.01M
- Other: $0.22M
Pink
- Troll: $0.65M
- Seine: $1.80M
- Gillnet: $0.09M
- Other: $0.31M
Sockeye
- Troll: $0.11M
- Seine: $2.72M
- Gillnet: $3.80M
- Other: $2.07M
Average net wholesale value (WSV) all species by gear type in 2020-2023
- Troll: $5.6M
- Seine: $8.0M
- Gillnet: $3.0M
- Other: $5.4M
Average net wholesale value (WSV) by species and gear type in 2020-2023
Chinook
- Troll: $1.78M
- Seine: $0.15M
- Gillnet: $0.38M
- Other: $1.23M
Chum
- Troll: $0.10M
- Seine: $1.65M
- Gillnet: $0.72M
- Other: $0.81M
Coho
- Troll: $1.87M
- Seine: $0.40K
- Gillnet: $4.99K
- Other: $0.22M
Pink
- Troll: $1.81M
- Seine: $5.06M
- Gillnet: $0.25M
- Other: $1.05M
Pink salmon has the highest wholesale margin.
Sockeye
- Troll: $0.05M
- Seine: $1.17M
- Gillnet: $1.63M
- Other: $2.07M
Harvest allocated to final consumption
Nearly half (49%) of the commercial salmon harvest is allocated to international exports.
Shares allocated to each sectors:
- International export: 49%
- Household food expenditure: 30%
- Interprovincial export: 12%
- Accommodation and food services: 10%
Long text version
Value chain of the wild salmon fishery in British Columbia - preliminary draft
The value chain process
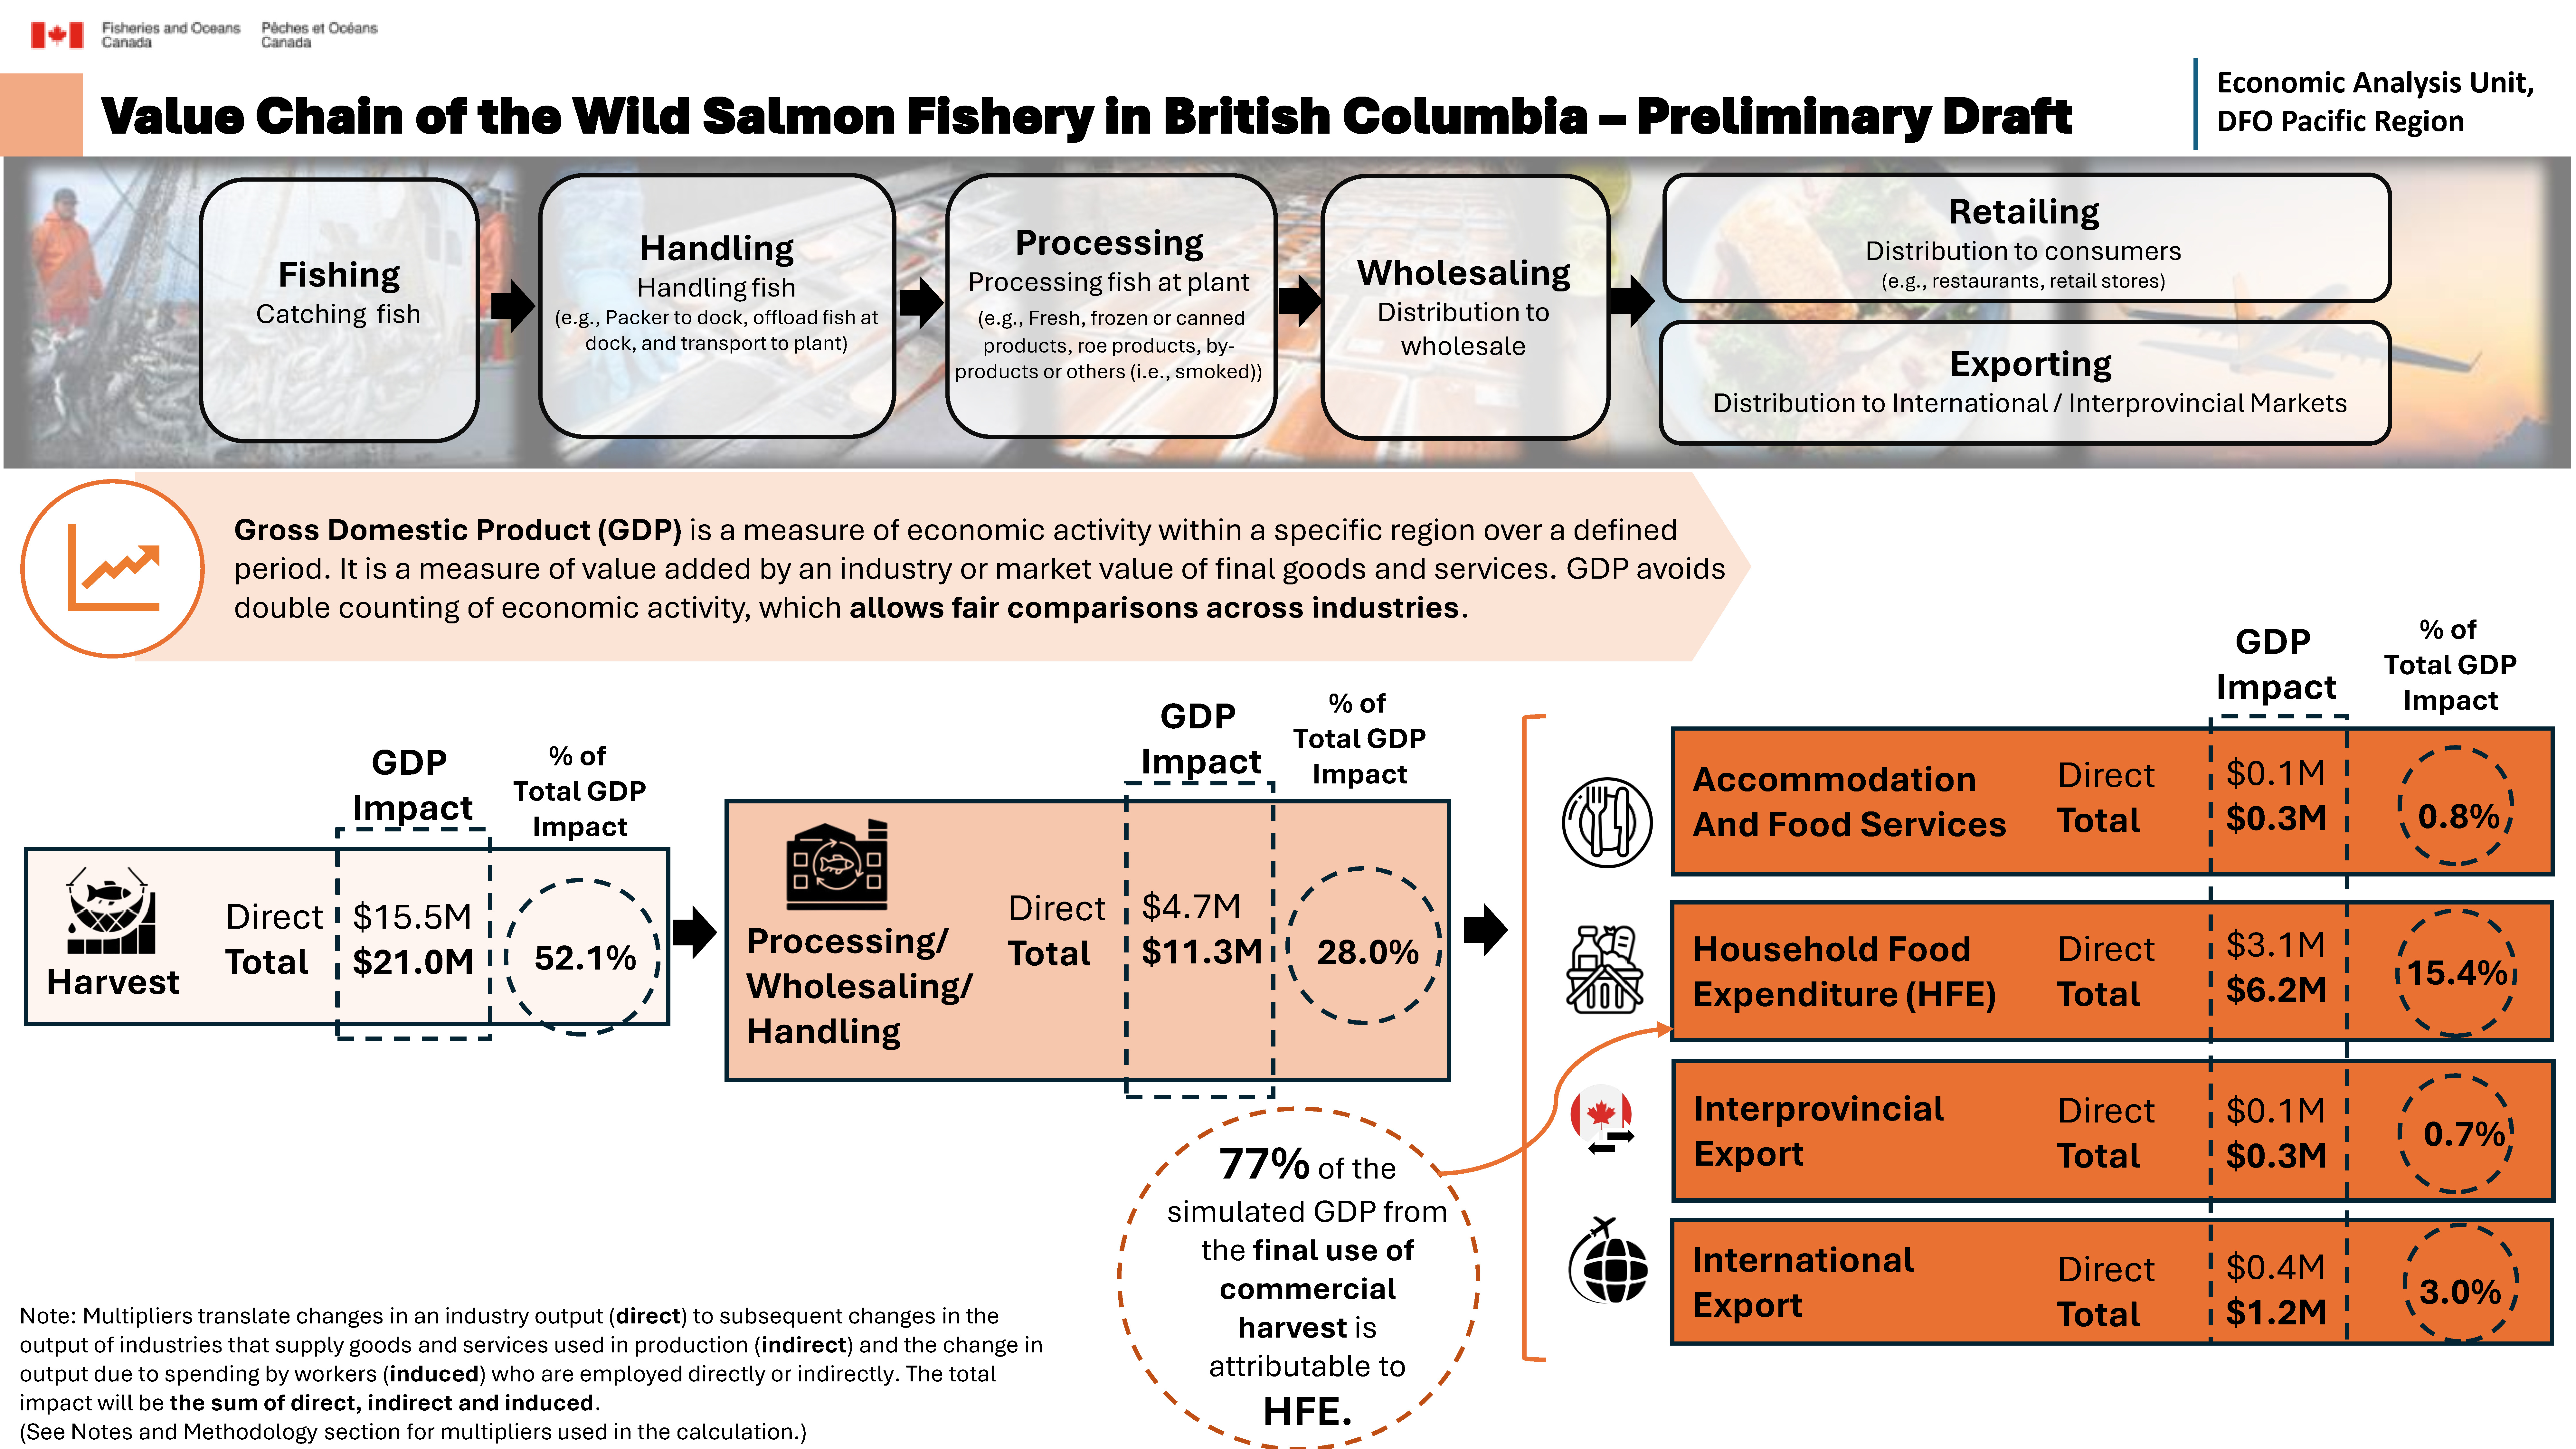
- Fishing: catching fish
- Handling: handling fish (e.g., packer to dock, offload fish at dock, and transport to plant)
- Processing: processing fish at plant (e.g., fresh, frozen or canned products, roe products, by-products or others (i.e., smoked))
- Wholesaling: distribution to wholesale
- Retailing: distribution to consumers (e.g., restaurants, retail stores)
- Exporting: distribution to international / interprovincial markets
Gross Domestic Product (GDP) is a measure of economic activity within a specific region over a defined period. It is a measure of value added by an industry or market value of final goods and services. GDP avoids double counting of economic activity, which allows fair comparisons across industries.
GDP impact by value chain stage
- Harvest
- Direct GDP impact: $15.5M
- Total GDP impact: $21.0M
- % of Total GDP impact: 52.1%
- Processing / wholesaling / handling
- Direct GDP impact: $4.7M
- Total GDP impact: $11.3M
- % of Total GDP impact: 28.0%
- Accommodation and food services
- Direct GDP impact: $0.1M
- Total GDP impact: $0.3M
- % of Total GDP impact: 0.8%
- Household food expenditure (HFE)
- Direct GDP impact: $3.1M
- Total GDP impact: $6.2M
- % of Total GDP impact: 15.4%
77% of the simulated GDP from the final use of commercial harvest is attributable to HFE.
- Interprovincial export
- Direct GDP impact: $0.1M
- Total GDP impact: $0.3M
- % of Total GDP impact: 0.7%
- International export
- Direct GDP impact: $0.4M
- Total GDP impact: $1.2M
- % of total GDP impact: 3.0%
Multipliers translate changes in an industry output (direct) to subsequent changes in the output of industries that supply goods and services used in production (indirect) and the change in output due to spending by workers (induced) who are employed directly or indirectly. The total impact will be the sum of direct, indirect, and induced. See notes and methodology section for multipliers used in the calculation.
Long text version
Commercial salmon sector links across local communities in British Columbia
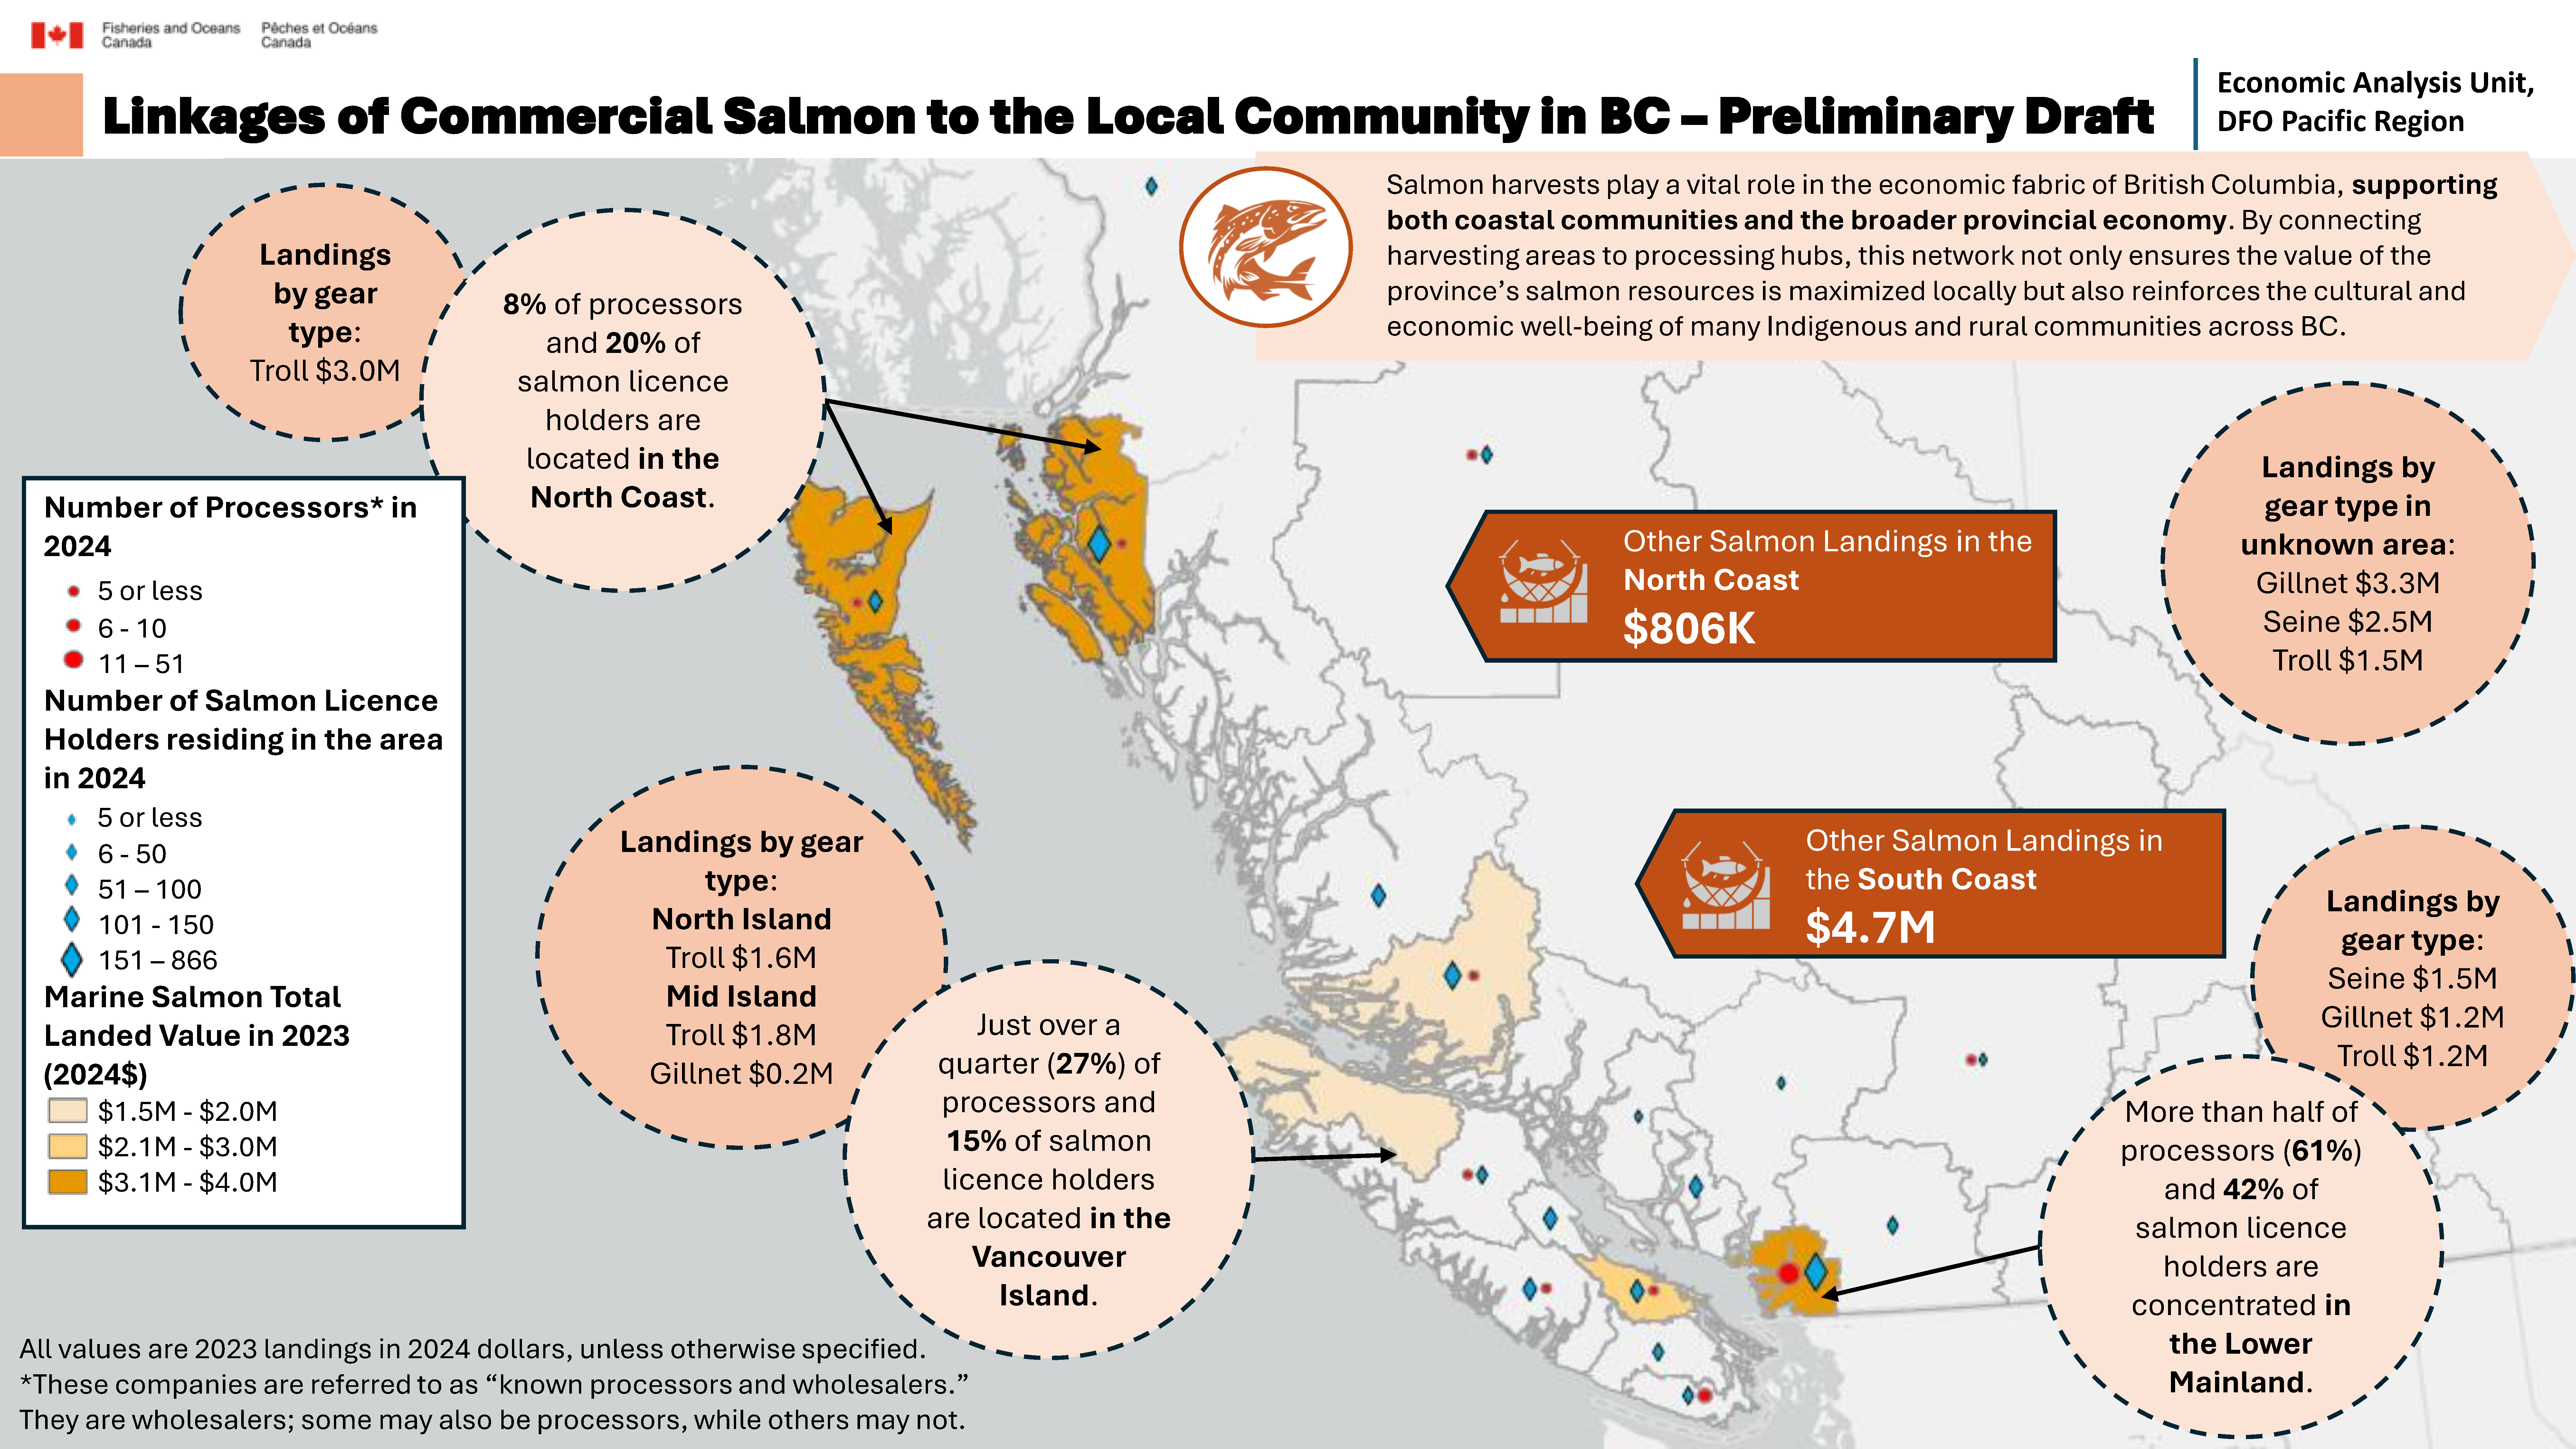
Salmon harvests play a vital role in the economic fabric of British Columbia, supporting both coastal communities and the broader provincial economy. By connecting harvesting Areas to processing hubs, this network not only ensures the value of the province’s salmon resources is maximized locally but also reinforces the cultural and economic well-being of many Indigenous and rural communities across BC.
All values are 2023 landings in 2024 dollars, unless otherwise specified.
Locations of processors, licence holders and landed value
- Processors in 2024. These companies are referred to as “known processors and wholesalers.” They are wholesalers; some may also be processors, while others may not. Locations with:
- 5 or fewer processors
- Bulkley-Nechako
- Mount Waddington
- Thompson-Nicola
- Nanaimo
- Strathcona
- Alberni-Clayoquot
- 6 – 10 processors
- Capital
- 11 – 51 processors
- Greater Vancouver
- Salmon licence holders residing in the Area in 2024. Locations with:
- 5 or fewer salmon licence holders
- Central Kootenay
- Fraser-Fort George
- Okanagan-Similkameen
- Stikine
- Powell River
- Squamish-Lilloet
- Thompson-Nicola
- North Okanagan
- Central Okanagan
- 6 – 50 salmon licence holders
- Bulkley-Nechako
- Strathcona
- Fraser Valley
- Kitimat-Stikine
- Capital
- Cowichan Valley
- 51 – 100 salmon licence holders
- Comox Valley
- Alberni-Clayoquot
- Campbell River
- Central Coast
- Nanaimo Nanaimo
- Sunshine Coast
- 101 – 150 salmon licence holders
- Mount Waddington
- 151 – 866 salmon licence holders
- Skeena-Queen Charlotte
- Greater Vancouver
- Marine salmon total landed value in 2023 (2024$). Locations with:
- $1.5M - $2.0M in marine salmon landed value:
- Mount Waddington
- $2.1M - $3.0M in marine salmon landed value:
- Nanaimo
- $3.1M - $4.0M in marine salmon landed value:
- Skeena-Queen Charlotte
- Greater Vancouver
North Coast
- 8% of processors and 20% of salmon licence holders are located in the North Coast.
- Landings by gear type:
- Troll $3.0M
Vancouver Island
- Just over a quarter (27%) of processors and 15% of salmon licence holders are located on Vancouver Island.
- Landings by gear type:
- North island
- Troll $1.6M
- Mid Island
- Troll $1.8M
- Gillnet $0.2M
Lower Mainland
- More than half of processors (61%) and 42% of salmon licence holders are concentrated in the Lower Mainland.
- Landings by gear type:
- Seine $1.5M
- Gillnet $1.2M
- Troll $1.2M
Unknown Area
- Landings by gear type:
- Gillnet $3.3M
- Seine $2.5M
- Troll $1.5M
Other salmon landings in the North Coast: $806K
Other salmon landings in the South Coast: $4.7M
Long text version
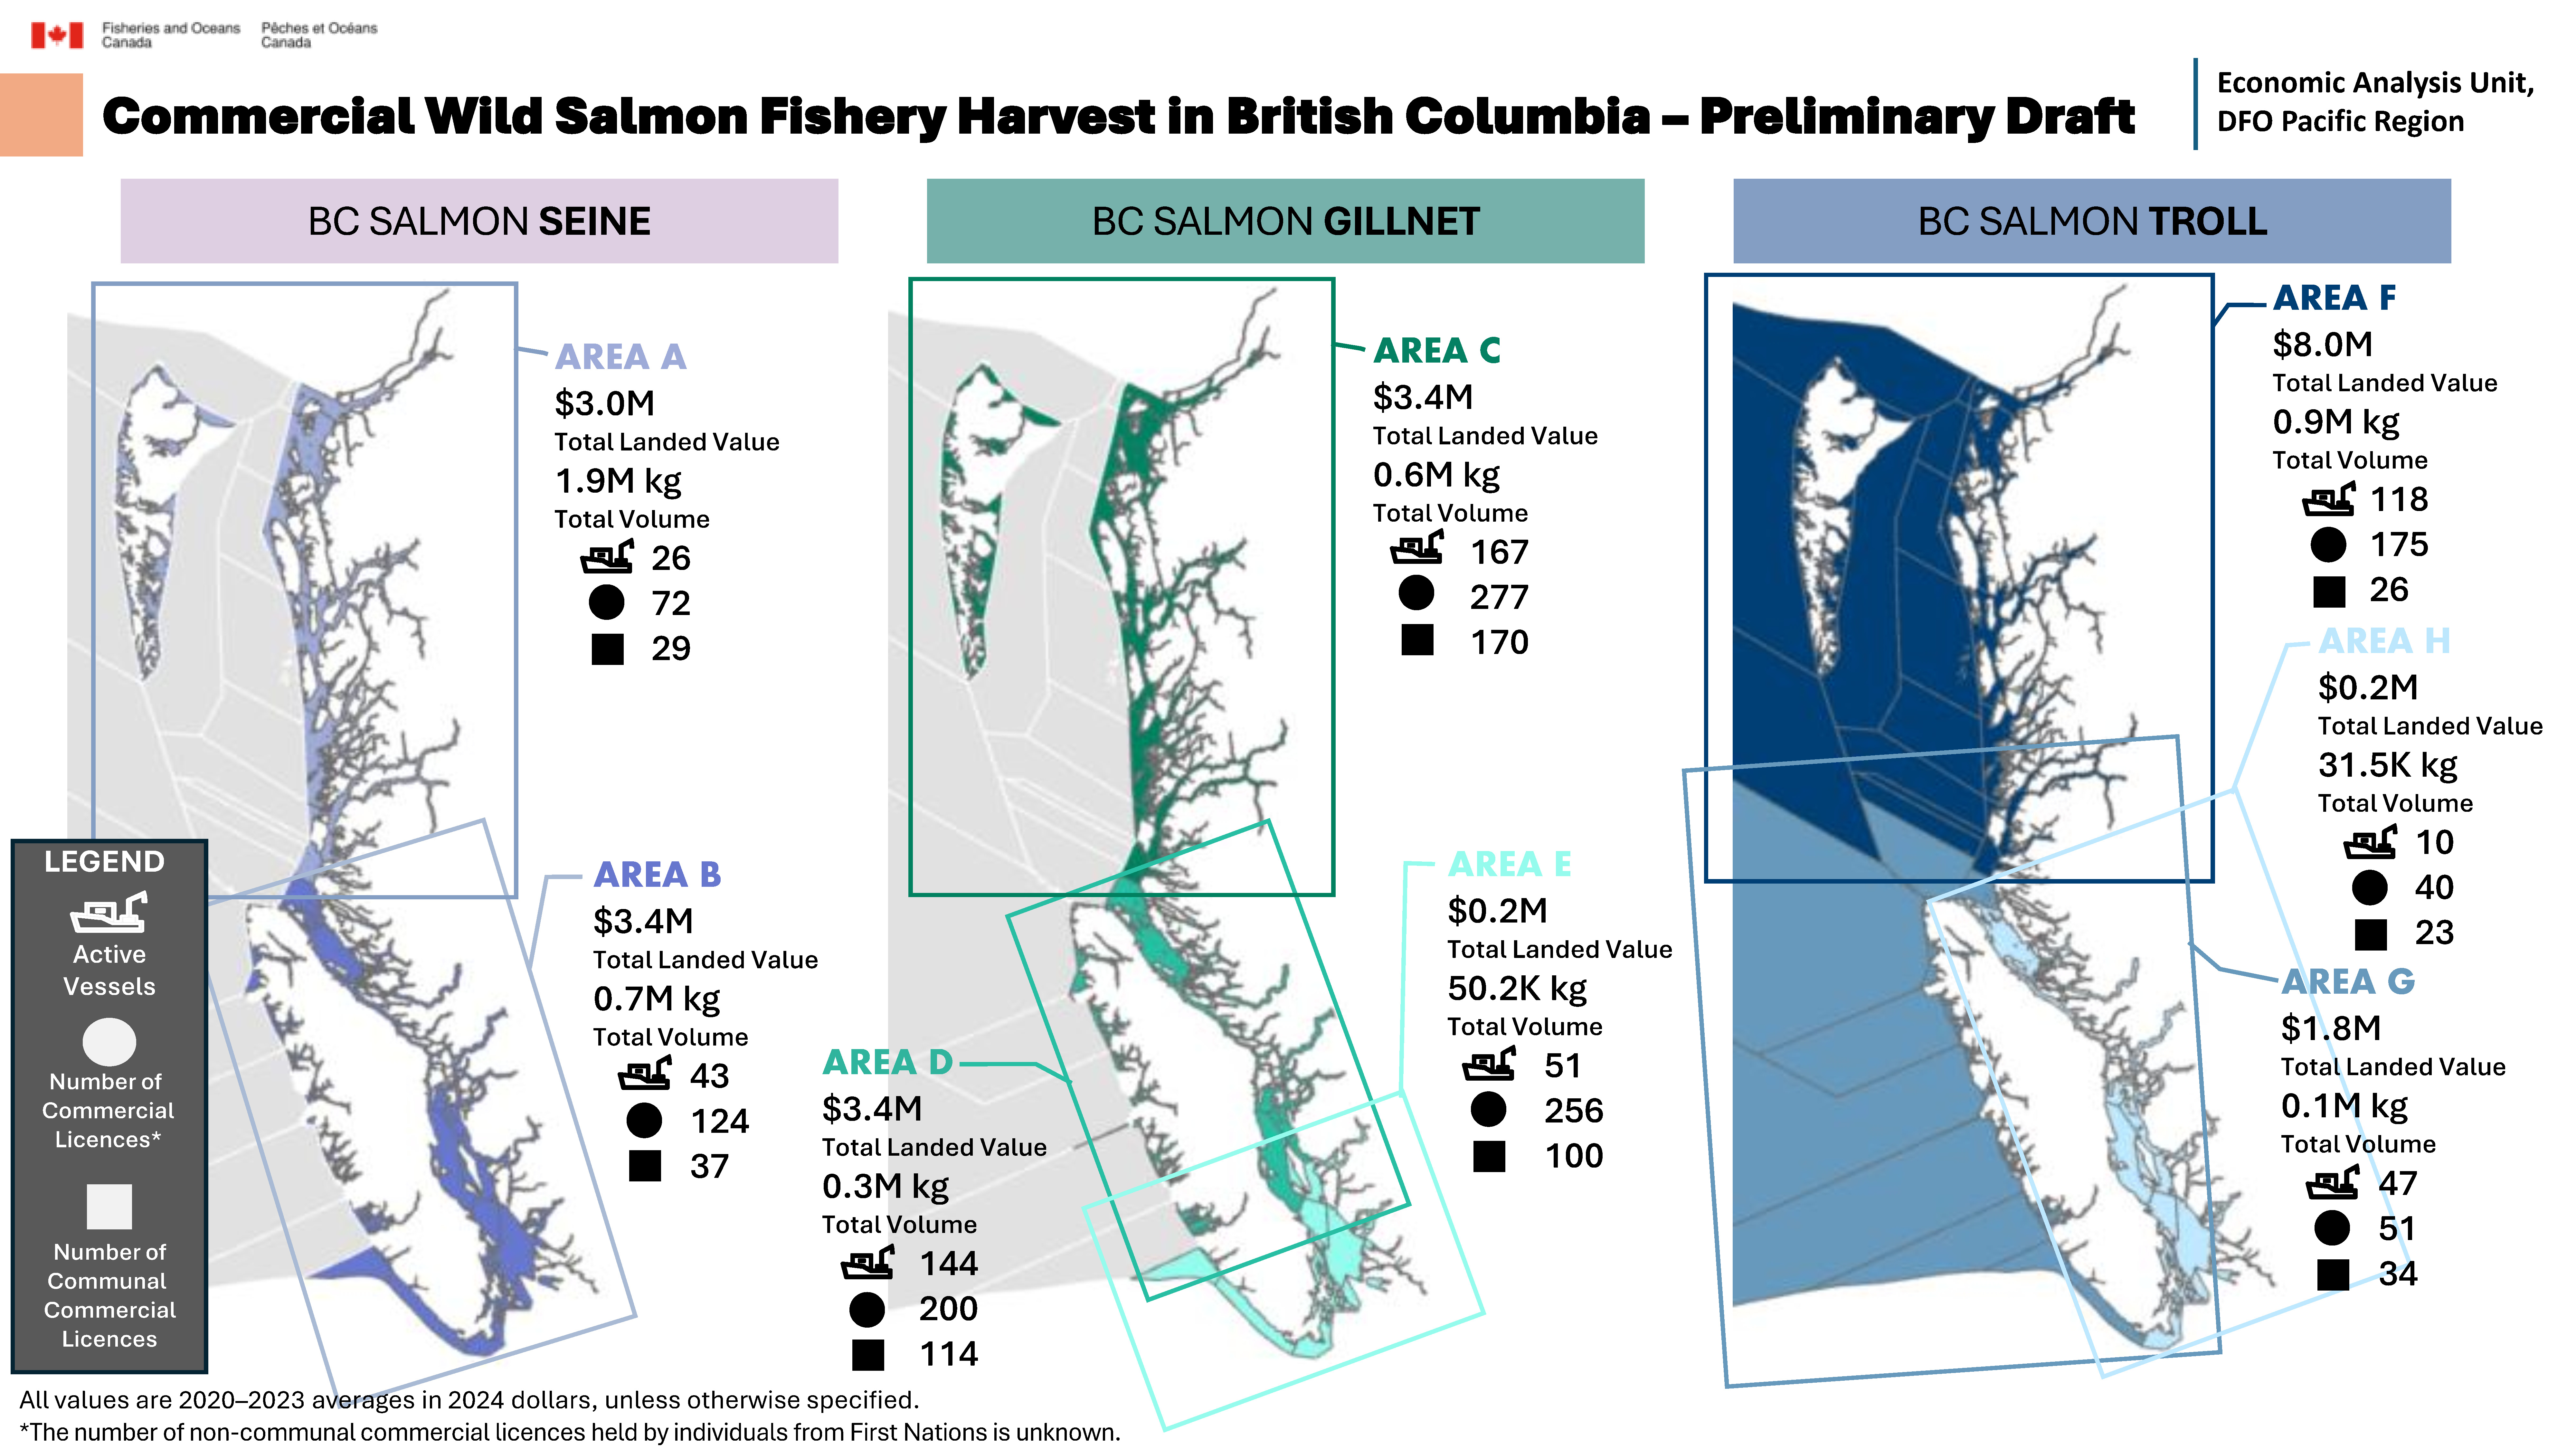
Commercial wild salmon fishery harvest in British Columbia - preliminary draft
All values are 2020–2023 averages in 2024 dollars, unless otherwise specified.
The number of non-communal commercial licences held by individuals from First Nations is unknown.
BC salmon seine
- Area A
- Total landed value: $3.0M
- Total volume: 1.9M kg
- Active vessels: 26
- Number of commercial licences: 72
- Number of communal commercial licences: 29
- Area B
- Total landed value: $3.4M
- Total volume: 0.7M kg
- Active vessels: 43
- Number of commercial licences: 124
- Number of communal commercial licences: 37
BC salmon gillnet
- Area C
- Total landed value: $3.4M
- Total volume: 0.6M kg
- Active vessels: 167
- Number of commercial licences: 277
- Number of communal commercial licences: 170
- Area D
- Total landed value: $3.4M
- Total volume: 0.3M kg
- Active vessels: 144
- Number of commercial licences: 200
- Number of communal commercial licences: 144
- Area E
- Total landed value: $0.2M
- Total volume: 50.2K kg
- Active vessels: 51
- Number of commercial licences: 256
- Number of communal commercial licences: 100
BC salmon troll
- Area F
- Total landed value: $8.0M
- Total volume: 0.9M kg
- Active vessels: 118
- Number of commercial licences: 175
- Number of communal commercial licences: 26
- Area H
- Total landed value: $0.2M
- Total volume: 31.5K kg
- Active vessels: 10
- Number of commercial licences: 40
- Number of communal commercial licences: 23
- Area G
- Total landed value: $1.8M
- Total volume: 0.1M kg
- Active vessels: 47
- Number of commercial licences: 51
- Number of communal commercial licences: 34
Long text version
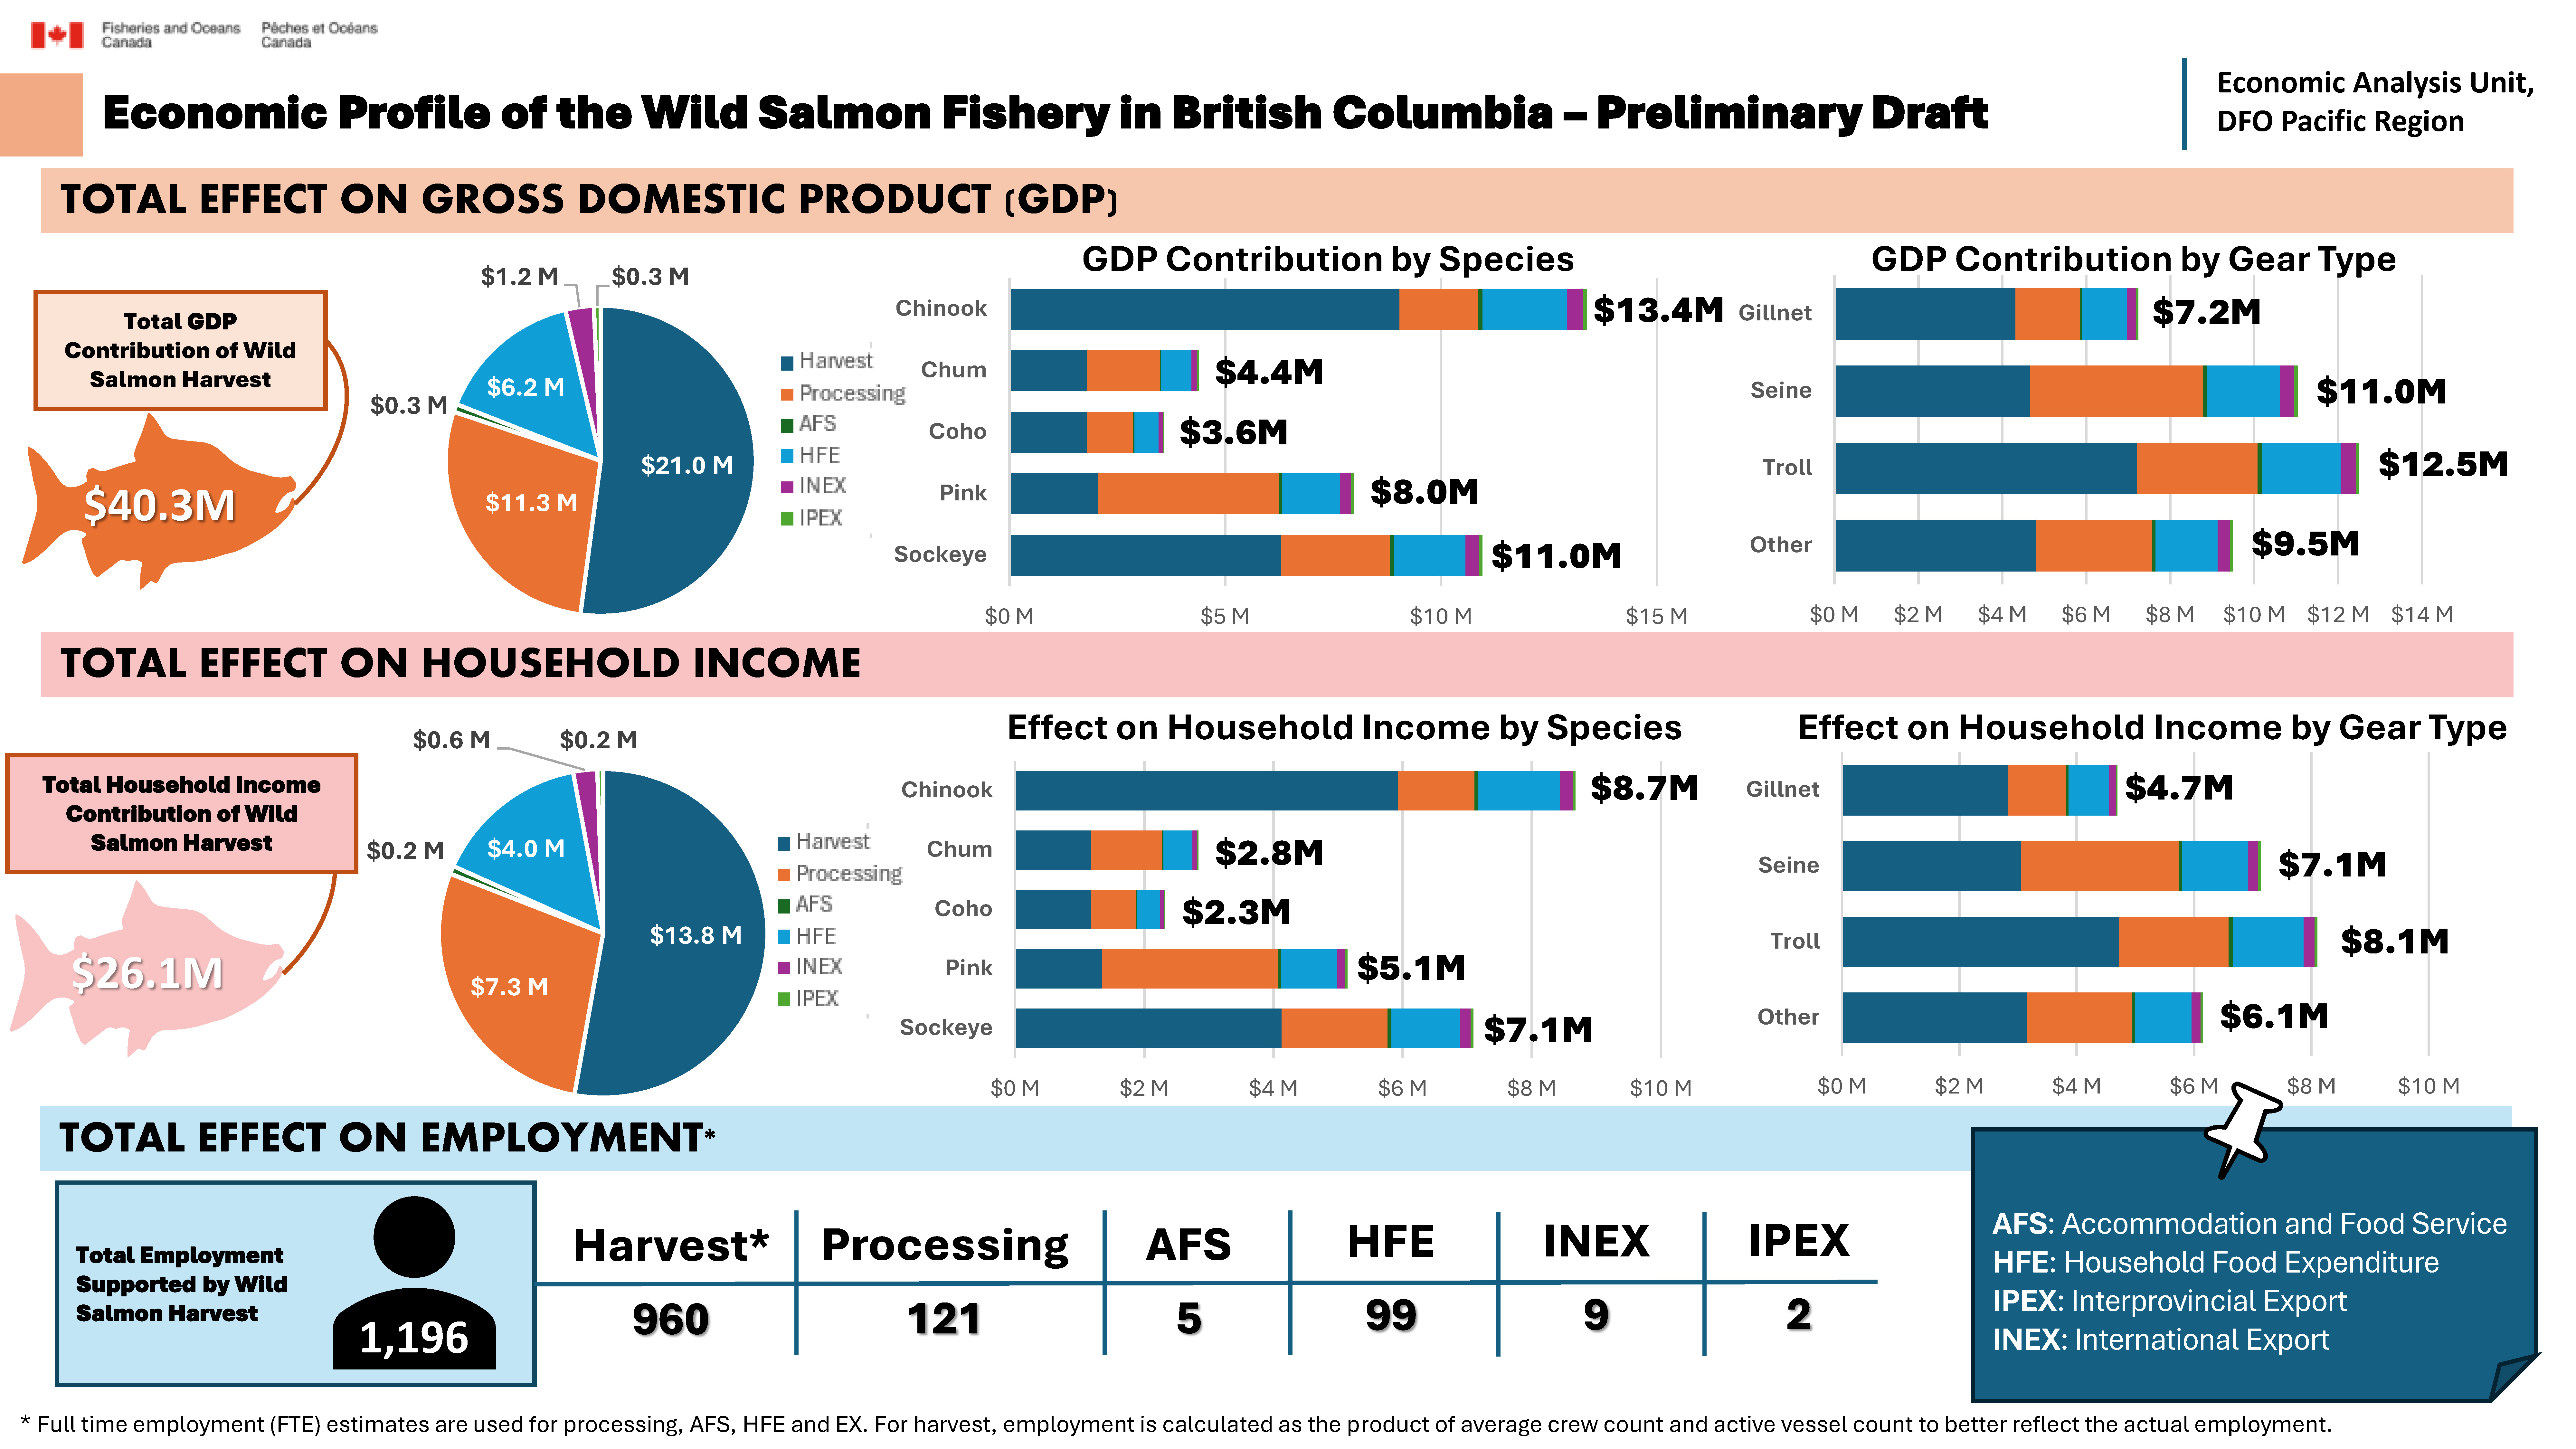
Economic profile of the wild salmon fishery in British Columbia - preliminary draft
Total effect on gross domestic product (GDP)
Total GDP contribution of wild salmon harvest: $40.3M
Total GDP contribution by sector
- Harvest: $21.0M
- Processing: $11.3M
- HFE: $6.2M
- INEX: $1.2M
- AFS: $0.3M
- IPEX: $0.3M
GDP contribution by species and sector
Chinook
- Harvest: $5.9M
- Processing: $1.18M
- HFE: $1.26M
- INEX: $0.19M
- AFS: $0.07M
- IPEX: $0.05M
Chum
- Harvest: $1.2M
- Processing: $1M
- HFE: $0.45M
- INEX: $0.07M
- AFS: $0.02M
- IPEX: $0.02M
Coho
- Harvest: $1.2M
- Processing: $0.7M
- HFE: $0.36M
- INEX: $0.06M
- AFS: $0.02M
- IPEX: $0.01M
Pink
- Harvest: $1.35M
- Processing: $2.72M
- HFE: $0.86M
- INEX: $0.13M
- AFS: $0.04M
- IPEX: $0.03M
Sockeye
- Harvest: $4.13M
- Processing: $1.64M
- HFE: $1.07M
- INEX: $0.17M
- AFS: $0.06M
- IPEX: $0.04M
Total GDP contribution by species
- Chinook: $13.4M
- Chum: $4.4M
- Coho: $3.6M
- Pink: $8.0M
- Sockeye: $11.0M
Total GDP contribution by gear type
- Gillnet: $7.2M
- Seine: $11.0M
- Troll: $12.5M
- Other: $9.5M
Effect on GDP by gear type and sector
Gillnet
- Harvest: $2.83M
- Processing: $1M
- HFE: $0.7M
- INEX: $0.11 M
- AFS: $0.04M
- IPEX: $0.03M
Seine
- Harvest: $3.06M
- Processing: $2.68M
- HFE: $1.13M
- INEX: $0.17M
- AFS: $0.06M
- IPEX: $0.04M
Troll
- Harvest: $4.73M
- Processing: $1.87M
- HFE: $1.21M
- INEX: $0.19M
- AFS: $0.06M
- IPEX: $0.05M
Other
- Harvest: $3.16M
- Processing: $1.79M
- HFE: $0.96M
- INEX: $0.15M
- AFS: $0.05M
- IPEX: $0.04M
Total effect on household income
Total household income contribution of wild salmon harvest: $26.1M
Household income contribution by sector
- Harvest: $13.8 M
- Processing: $7.3 M
- HFE: $4.0 M
- INEX: $0.6 M
- AFS: $0.2 M
- IPEX: $0.2 M
Effect on household income by species
- Chinook: $8.7M
- Chum: $2.8M
- Coho: $2.3M
- Pink: $5.1M
- Sockeye: $7.1M
Effect on household income by species and sector
Chinook
- Harvest: $5.9M
- Processing: $1.2M
- HFE: $1.3M
- INEX: $0.2M
- AFS: $0.07M
- IPEX: $0.05M
Chum
- Harvest: $1.2M
- Processing: $1.1M
- HFE: $0.45M
- INEX: $0.07M
- AFS: $0.02M
- IPEX: $0.02M
Coho
- Harvest: $1.2M
- Processing: $0.7M
- HFE: $0.36M
- INEX: $0.06M
- AFS: $0.02M
- IPEX: $0.01M
Pink
- Harvest: $1.35M
- Processing: $2.7M
- HFE: $0.86M
- INEX: $0.13M
- AFS: $0.04M
- IPEX: $0.03M
Sockeye
- Harvest: $4.1M
- Processing: $1.6M
- HFE: $1.1M
- INEX: $0.17M
- AFS: $0.06M
- IPEX: $0.04M
Effect on household income by gear type
- Gillnet: $4.7M
- Seine: $7.1M
- Troll: $8.1M
- Other: $6.1M
Effect on household income by gear and sector
Gillnet
- Harvest: $2.83M
- Processing: $1M
- HFE: $0.7M
- INEX: $0.11M
- AFS: $0.04M
- IPEX: $0.03M
Seine
- Harvest: $3.06M
- Processing: $2.7M
- HFE: $1.1M
- INEX: $0.2M
- AFS: $0.06M
- IPEX: $0.04M
Troll
- Harvest: $4.7M
- Processing: $1.9M
- HFE: $1.2M
- INEX: $0.2M
- AFS: $0.06M
- IPEX: $0.05M
Other
- Harvest: $3.2M
- Processing: $1.8M
- HFE: $0.96M
- INEX: $0.15M
- AFS: $0.05M
- IPEX: $0.04M
Total effect on employment
Total employment supported by wild salmon harvest: 1,196
Employment by sector
- Harvest: 960
- Processing: 121
- Accommodation and food service: 5
- Household food expenditure: 99
- Interprovincial export: 9
- International export: 2
FTE estimates are used for processing, AFS, HFE and EX. For harvest, employment is calculated as the product of average crew count and active vessel count to better reflect the actual employment.
Notes and methodology
Methodology
This research estimates the full domestic commercial value of BC’s wild‑harvested salmon by extending analysis beyond wholesale sales value (WSV) to capture additional value added within British Columbia. The process begins with species‑specific WSV, derived from logbooks and AFPS data using established landed‑value‑to‑wholesale‑value ratios. From there, the method allocates WSV to final‑use sectors—household food expenditures, accommodation and food services, international exports, and interprovincial exports. Export shares are calculated by comparing AFPS wholesale values to adjusted EXIM export values, while the remaining portion of WSV is assigned to domestic sectors using relative shares from provincial supply‑use tables.
For each final‑use sector, value‑added margins from the supply‑use tables are applied to estimate economic activity occurring beyond the wholesale stage. Wholesale margins are removed beforehand to prevent double counting, ensuring the analysis isolates only the incremental value added by downstream activities such as transportation, retailing, and food service preparation. This converts the wholesale value into purchaser‑level output attributable to BC.
Once each sector’s purchaser value is estimated, the results are aggregated to determine the total domestic value added from BC’s salmon harvest, including domestic consumption and the BC‑based components of export activity. The incremental value above WSV is then paired with appropriate economic multipliers to estimate resulting GDP, labour income, and employment contributions. While the framework provides a repeatable approach for estimating domestic final‑use value, it relies on BC‑wide margins, simplified sector shares, and imperfect export classifications. Future iterations will benefit from improved species‑specific data, updated supply‑use tables, and more detailed treatment of direct‑to‑consumer and interprovincial flows.
Assumptions and limitations / caveats
The results presented in this document are preliminary and will be refined as additional information becomes available. There are a number of places where uncertainty is introduced into the estimates. Two potentially important sources of uncertainty related to differences in the definitions used in different data sources and the use of multipliers to estimate economic contribution metrics.
The analysis relies on multiple data sources, each of which gathers data and defines common terms somewhat differently. For example, the “wholesale value” identified by the BC Annual Fisheries Production Schedule appears to differ from that used by Statistics Canada. Additional investigation is required to determine if further adjustments are needed to fully reconcile and account for the true flow of values through the simulated value chain. The interpretation used within this document may have resulted in an over- or under-estimate of the value of BC salmon beyond wild harvest. However, the degree to which revisions will result in materially different estimates of value is not clear.
Additional uncertainty in the estimates results from the use of multipliers for the parts of the value chain. Regular multipliers, such as those published by Statistics Canada or as part of the BC Fisheries and Aquaculture Sector reports, include the economic activity generated from demand for inputs downstream from an industry. These available multipliers are each counting some of the same underlying downstream economic activity in their estimates, and it is not possible to disentangle how much double counting there may be with available data. This is of particular concern for vertically integrated industries such as wild capture fisheries and seafood processing, meaning the economic contribution generated with regular multipliers cannot be added together. This can be addressed through the use of decoupled multipliers; however, these were not available at the time of this analysis and a “net wholesale value” approach does not fully address the issue. Double counting is also present when multipliers are used for sectors upstream in the value chain, when the intention is to add the results to those of fishing and processing. For example, part of the economic activity generated by seafood restaurants is a result of their demand for fish. Since the economic activity associated with fisheries and seafood processing are already captured, this introduces additional double counting. While it is clear the current multipliers and adjustment methods still result in some double counting, the scale is unclear, and direction of changes may be unexpected with revised multipliers.
Definitions
Accommodation and food services (AFS): comprises establishments primarily engaged in providing short-term lodging and complementary services to travelers, vacationers and others, in facilities such as hotels, motor hotels, resorts, motels, casino hotels, bed and breakfast accommodations. This sector also comprises establishments primarily engaged in preparing meals, snacks and beverages, to customer orders, for immediate consumption on and off the premises.
Household food expenditure (HFE): purchases of food consumed at home, such as groceries bought from retail outlets.
Interprovincial Export (IPEX): the goods and services produced in one Canadian province or territory and sold to buyers in other provinces or territories.
International Export (INEX): the goods and services produced in one Canadian province or territory and sold to buyers in other countries.
Other: includes First Nations commercial harvest in fisheries other than communal commercial fisheries, specifically Five Nations, economic opportunity (EO), demonstration (DEMO), excess salmon to spawning requirement (ESSR), and Harvest Agreement (HA) fisheries.
Data sources
B.C. Ministry of Agriculture and Food (2020-2023), Annual Fisheries Production Schedule. https://open.canada.ca/data/en/dataset/e591a756-6b99-4986-b8ce-f341bd47228f
DFO Internal Logbook Data (2020-2023)
Fisheries and Oceans Canada (2024), EXIM [database], Ottawa. Adapted from Statistics Canada, International Trade Data. No endorsement of this product by Statistics Canada is implied.
Lillian Hallin Consulting (2022). British Columbia’s fisheries and aquaculture sector: 2022 edition.
Pacific Salmon Commission (2020-2023). Pacific Salmon Commission Annual Report. https://www.psc.org/publications/annual-reports/commission/
Statistics Canada (2019). Table 36-10-0478-01. Supply and use tables, detail level. https://doi.org/10.25318/3610047801-eng
Statistics Canada (2022). Table 36-10-0594-01. Input-output multipliers, detail level. https://doi.org/10.25318/3610059401-eng
References
Statistics Canada (2024). Definition: Accommodation and food services (NAICS 72), in North American Industry Classification System (NAICS) Canada 2022 Version 1.0. https://www23.statcan.gc.ca/imdb/p3VD.pl?CLV=1&CPV=72&CST=27012022&CVD=1369826&Function=getVD&MLV=5&TVD=1369825 (accessed January 5, 2026)
Additional information
| Sector | Margins |
|---|---|
| AFS | 6% |
| HFE | 32% |
| IPEX and INEX | 5% |
| Sector | GDP | Household income | Employment |
|---|---|---|---|
| Capture fishery* | 0.7245 | 0.4753 | NA*** |
| Fish and seafood processing* | 0.5131 | 0.3331 | 5.4991 |
| AFS** | 1.111 | 0.695 | 17.749 |
| HFE** | 1.286 | 0.831 | 20.573 |
| IPEX and INEX** | 0.988 | 0.5115 | 7.3485 |
Sources
* Lillian Hallin Consulting, 2022
** Statistics Canada, 2022.
*** Direct employment is calculated as the product of average crew count and active vessel count to better reflect the actual employment for the harvesting sector.
Data
Related Links
- Date modified: