
Recreational salmon fishing economic contribution and profile in 2024
On this page
Infographics
Long text version
Total value of the recreational salmon fishery in British Columbia
Throughout, the tidal water averages are from 2021 to 2023. Data from 2020 was excluded due to the impacts of Covid-19. No tidal water recreational data is available for 2024. The freshwater averages are from 2022 to 2024. Freshwater recreational data is not available for 2021.
Overview
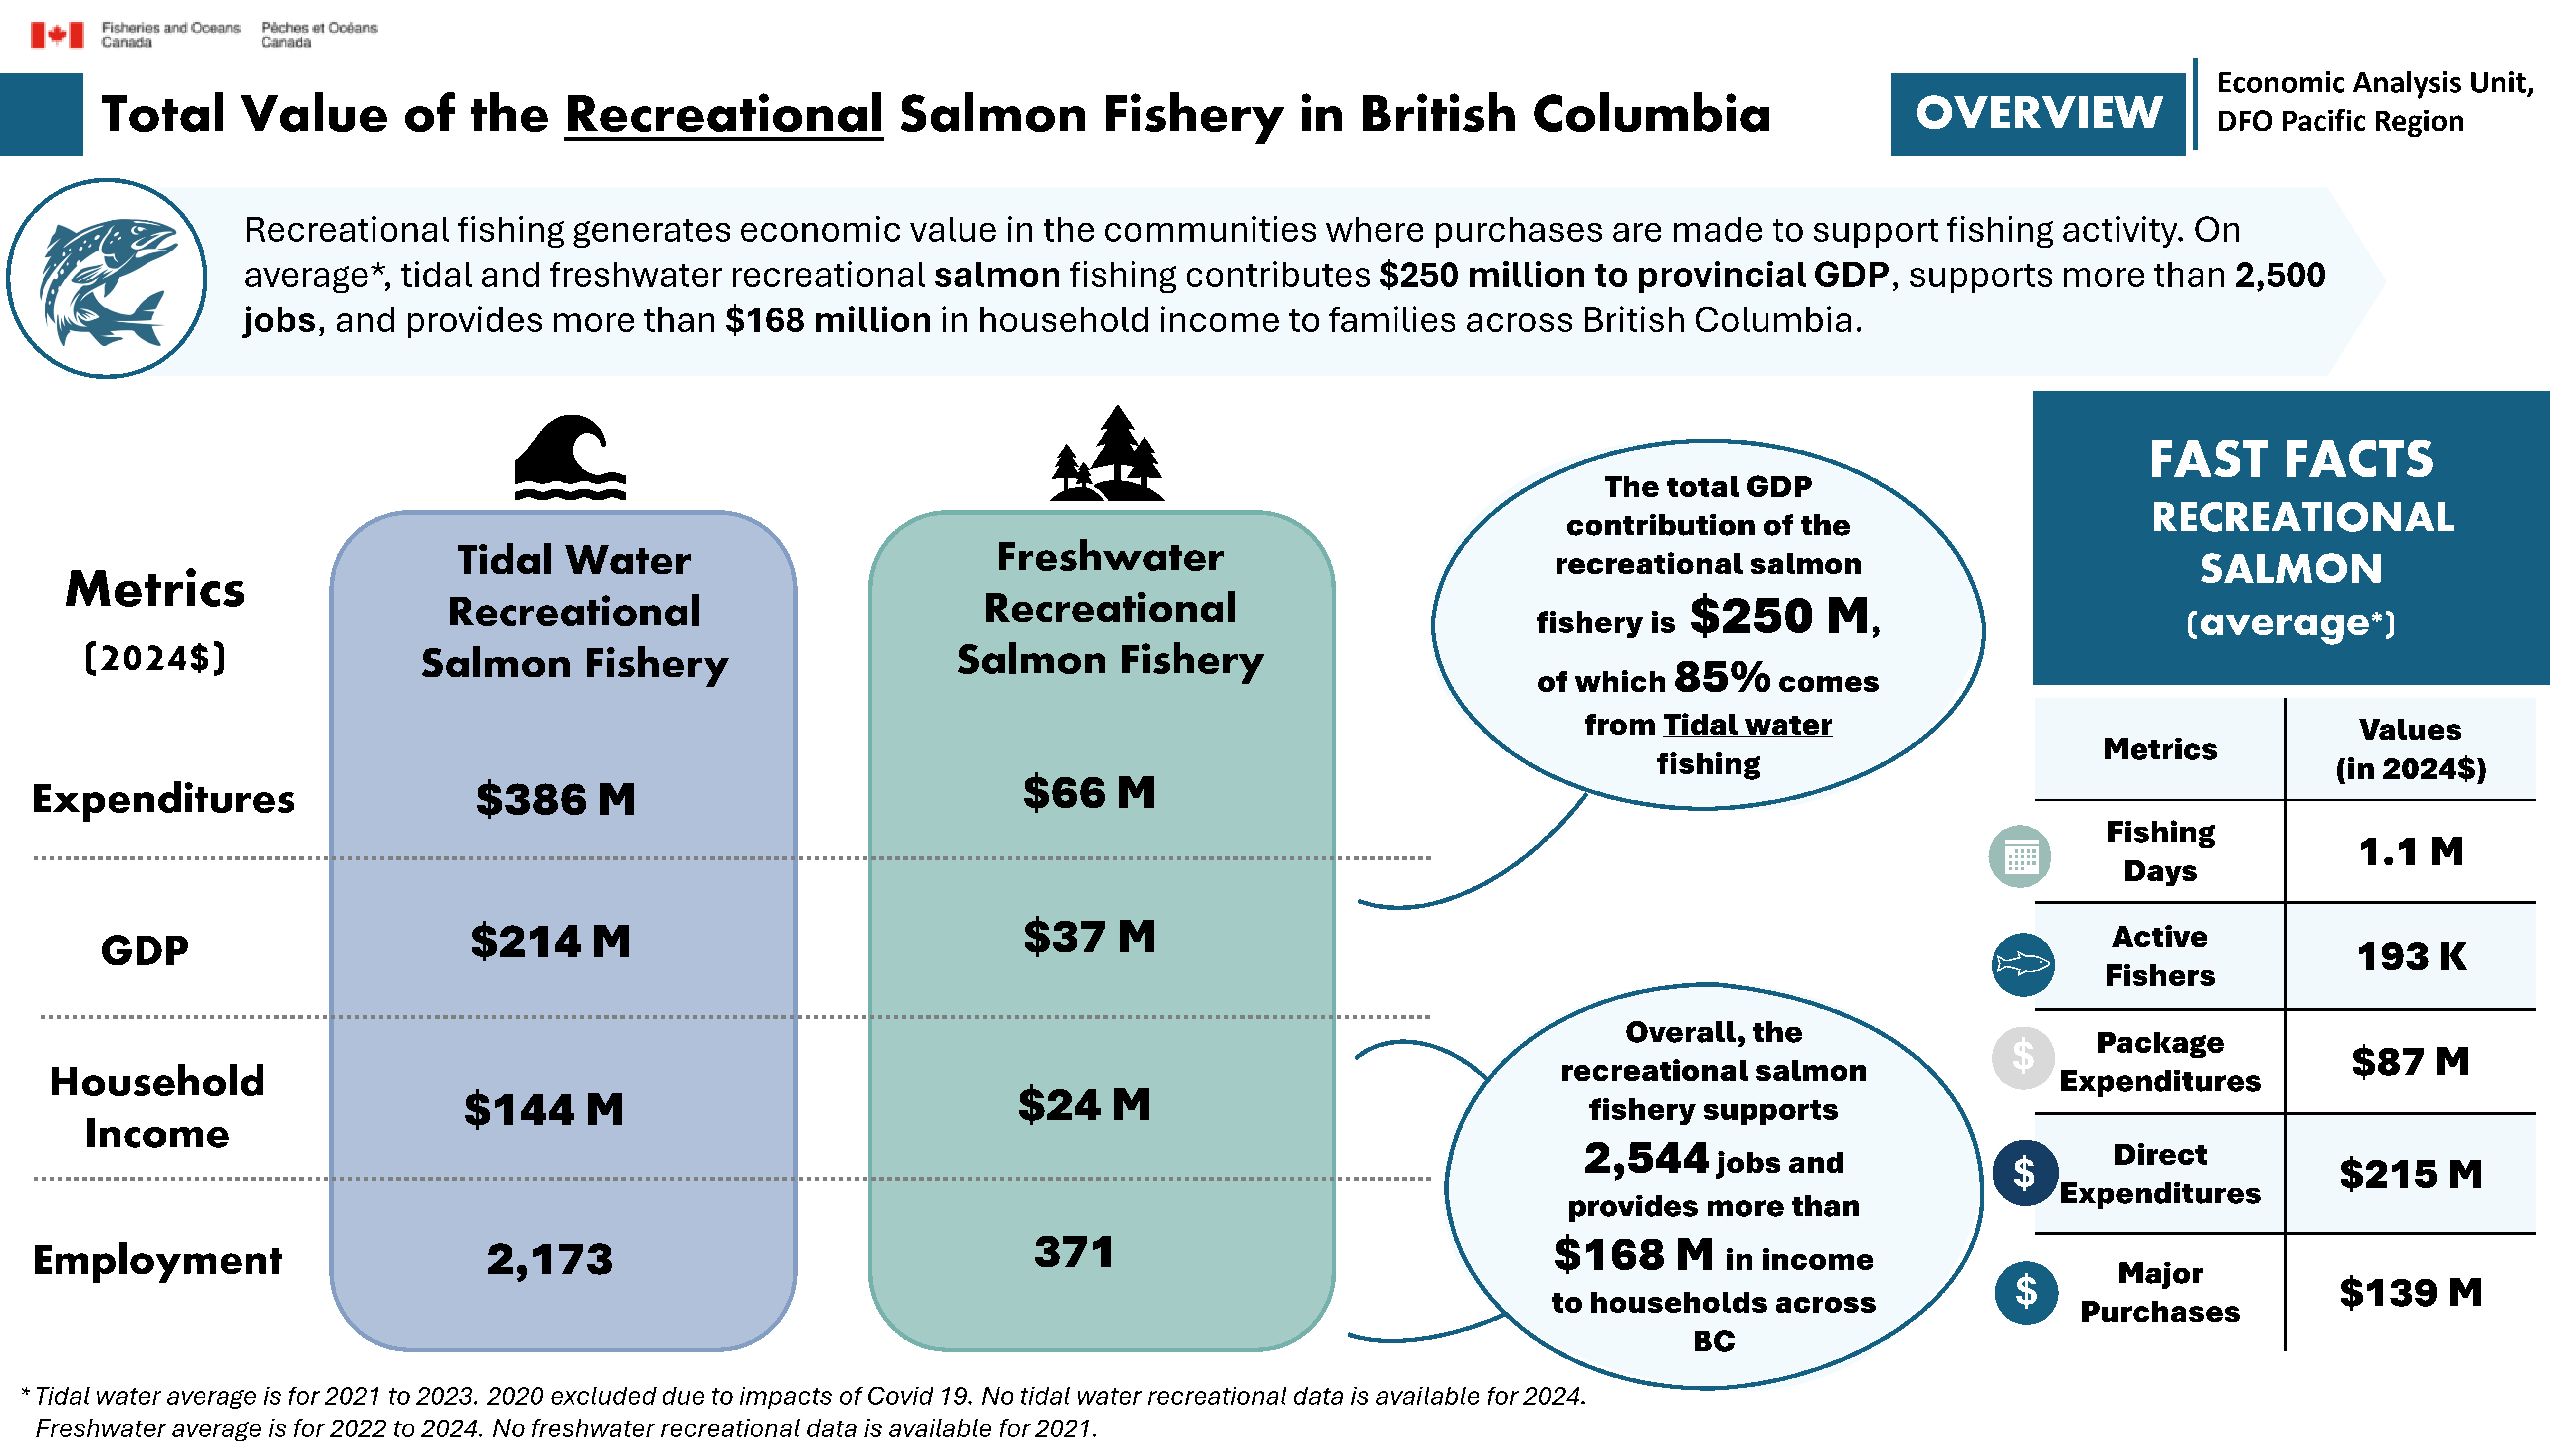
Recreational fishing generates economic value in the communities where purchases are made to support fishing activity. On average, tidal and freshwater recreational salmon fishing contributes $250 million to the provincial Gross Domestic Product or GDP, supports more than 2,500 jobs, and provides more than $168 million in household income to families across British Columbia.
Key metrics, all values are in 2024 dollars:
Tidal water recreational salmon fishery metrics
- Expenditures: $386M
- GDP: $214M
- Household income: $144M
- Employment: 2,173 jobs
Freshwater recreational salmon fishery metrics
- Expenditures: $66M
- GDP: $37M
- Household income: $24M
- Employment: 371 jobs
The total GDP contribution of the recreational salmon fishery is $250M, of which 85% comes from Tidal water fishing. Overall, the recreational salmon fishery supports 2,544 jobs and provides more than $168M in income to households across BC.
Fast facts on recreational salmon fishing (average, values in 2024$)
Key Metrics:
- Fishing days: 1.1M
A fishing day is a day or part of a day on which an individual fished for recreation.
- Active fishers: 193K
An active fisher is an individual who fished in the corresponding fishing season.
- Package expenditures: $87M
Package expenditures are monies paid to a lodge or outfitter for a complete range of services such as lodging, food, transportation, use of fishing equipment, etc.
- Direct expenditures: $215M
Direct expenditures are expenditures on goods and services (food, camping, accommodation, transportation, supplies, etc.) incurred during fishing trips or excursions.
- Major purchases: $139M
Major purchases are the purchase of durable goods and investments in support of recreational fishing activities. These include boats, motors, special vehicles, camping gear, and other durable goods, as well as land and building purchases. Respondents reported the total purchase price as well as the percentage which the respondent felt was directly attributable to recreational fishing. Only purchases attributable to recreational fishing are included.
Long text version
What drives recreational salmon value?
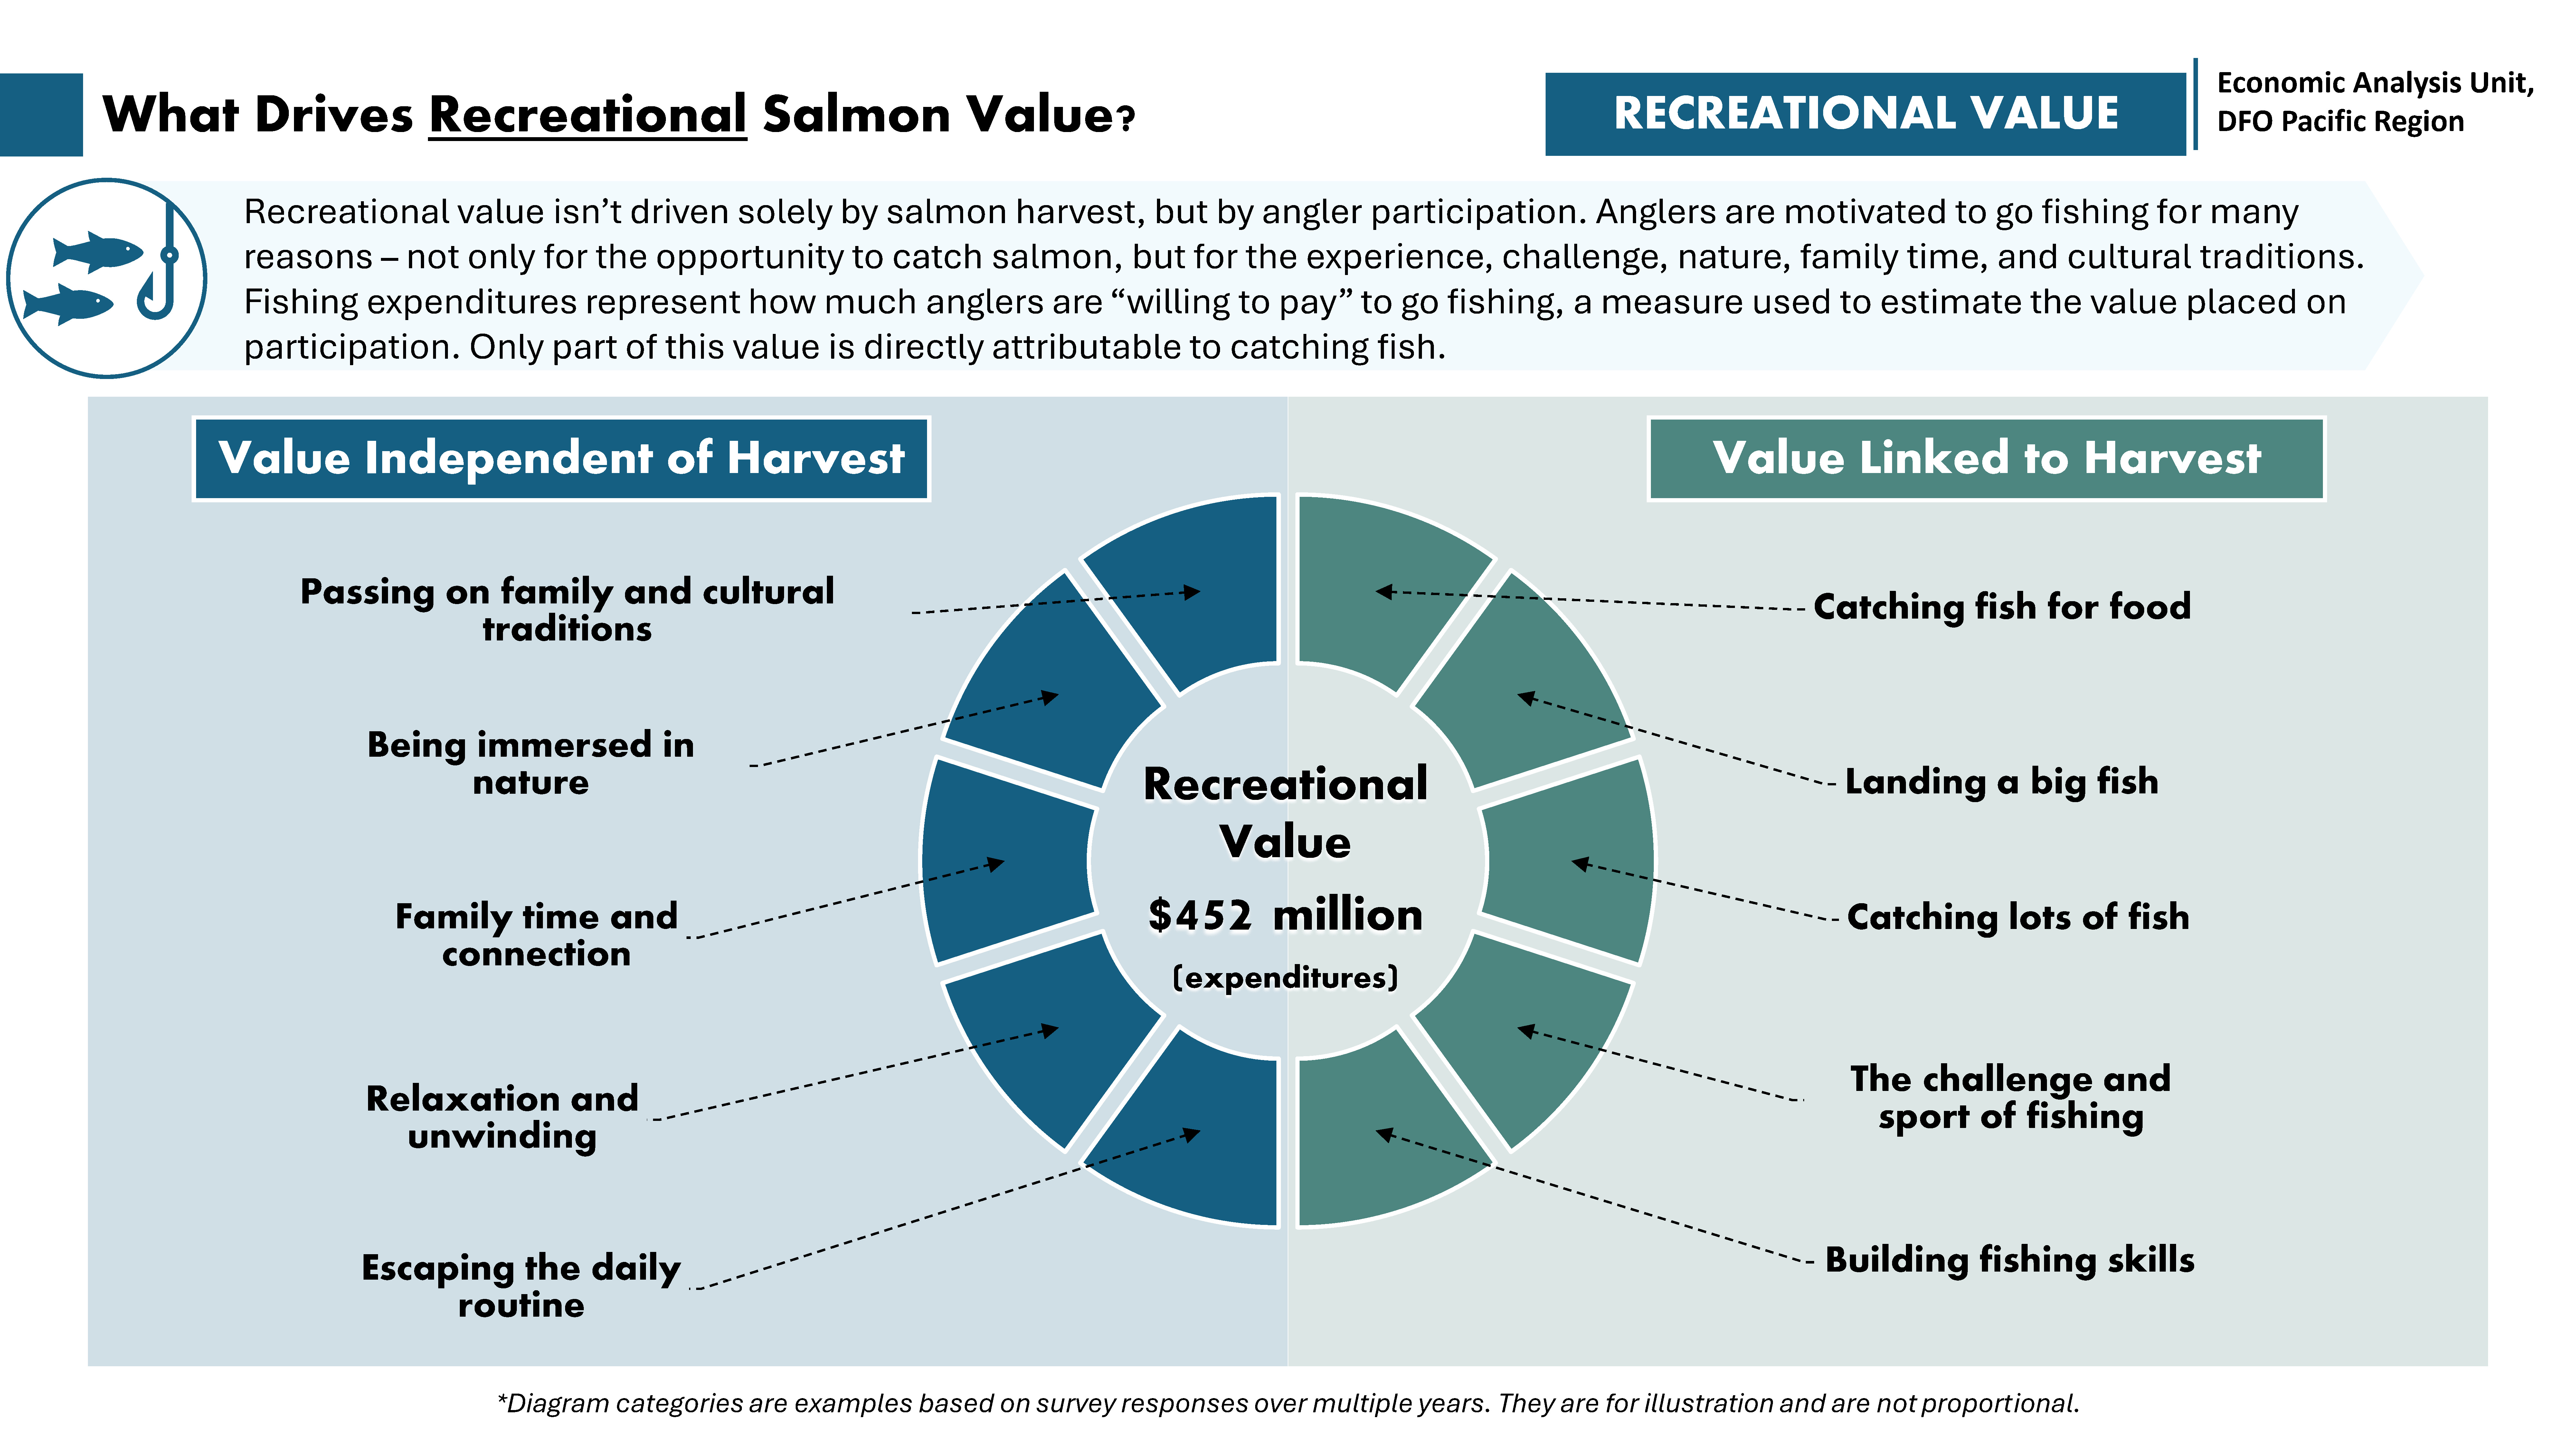
Recreational value isn’t driven solely by salmon harvest, but by angler participation. Anglers are motivated to go fishing for many reasons – not only for the opportunity to catch salmon, but for the experience, challenge, nature, family time, and cultural traditions. Fishing expenditures represent how much anglers are “willing to pay” to go fishing, a measure used to estimate the value placed on participation. Only part of this value is directly attributable to catching fish.
Total recreational value: $452 million (measured in fishing expenditures)
Value independent of harvest
- Passing on family and cultural traditions.
- Being immersed in nature.
- Family time and connection.
- Relaxation and unwinding.
- Escaping the daily routine.
Value linked to harvest
- Catching fish for food.
- Landing a big fish.
- Catching lots of fish.
- The challenge and sport of fishing.
- Building fishing skills.
Categories are examples based on survey responses over multiple years. They are for illustration.
Long text version
Recreational fishing sector value chain
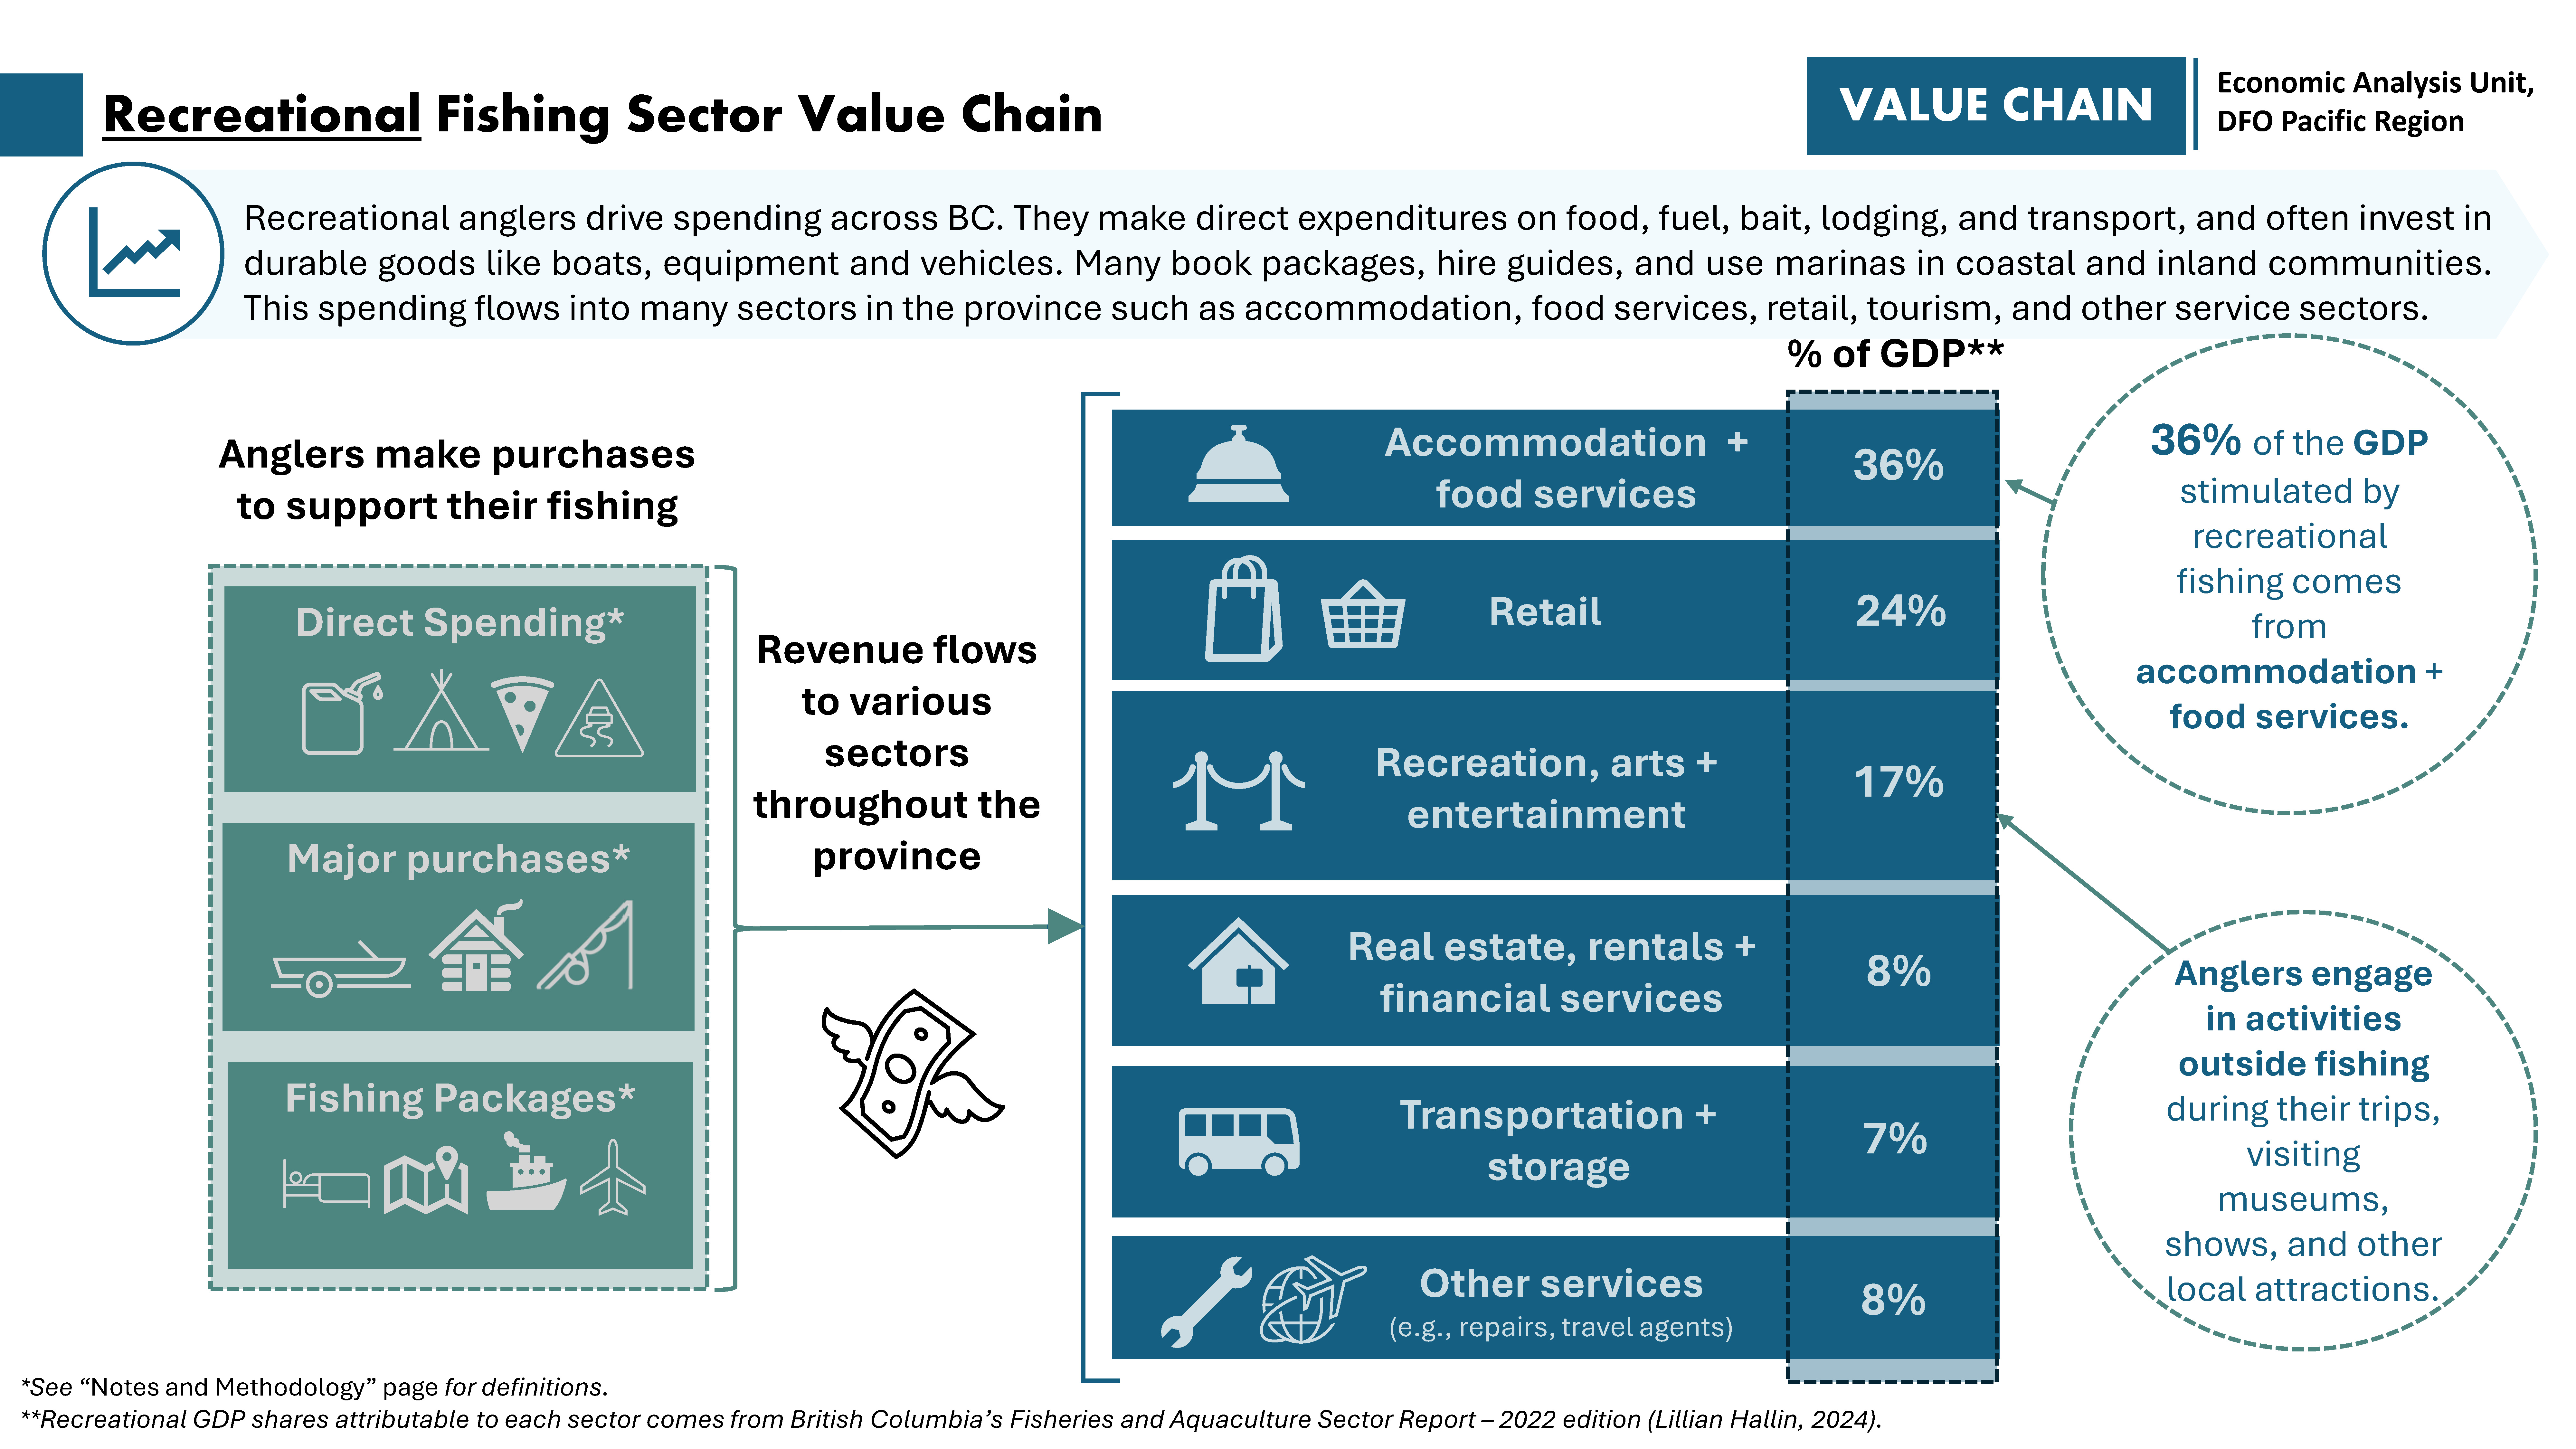
Recreational anglers drive spending across BC. They make direct expenditures on food, fuel, bait, lodging, and transport, and often invest in durable goods like boats, equipment, and vehicles. Many book packages, hire guides, and use marinas in coastal and inland communities. This spending flows into many sectors in the province, such as accommodation, food services, retail, tourism, and other service sectors.
Anglers make purchases to support their fishing. These purchases are categorized into:
- Direct spending
- Major purchases
- Fishing packages
The revenue from this spending flows to various sectors throughout the province.
The spending from recreational fishing has an impact on provincial GDP, which is distributed across the following sectors:
- Accommodation and food services: 36% of the GDP stimulated by recreational fishing comes from accommodation and food services.
- Retail: 24% of GDP.
- Recreation, arts and entertainment: 17% of GDP.
During their fishing trips, anglers engage in activities outside fishing including visiting museums, shows, and other local attractions.
- Real estate, rentals and financial services: 8% of GDP.
- Transportation and storage: 7% of GDP.
- Other services (e.g., repairs, travel agents): 8% of GDP.
Recreational GDP shares attributable to each sector comes from British Columbia’s Fisheries and Aquaculture Sector Report – 2022 edition (Lillian Hallin, 2024) available at:
Long text version
Communities benefited by the recreational salmon fishery
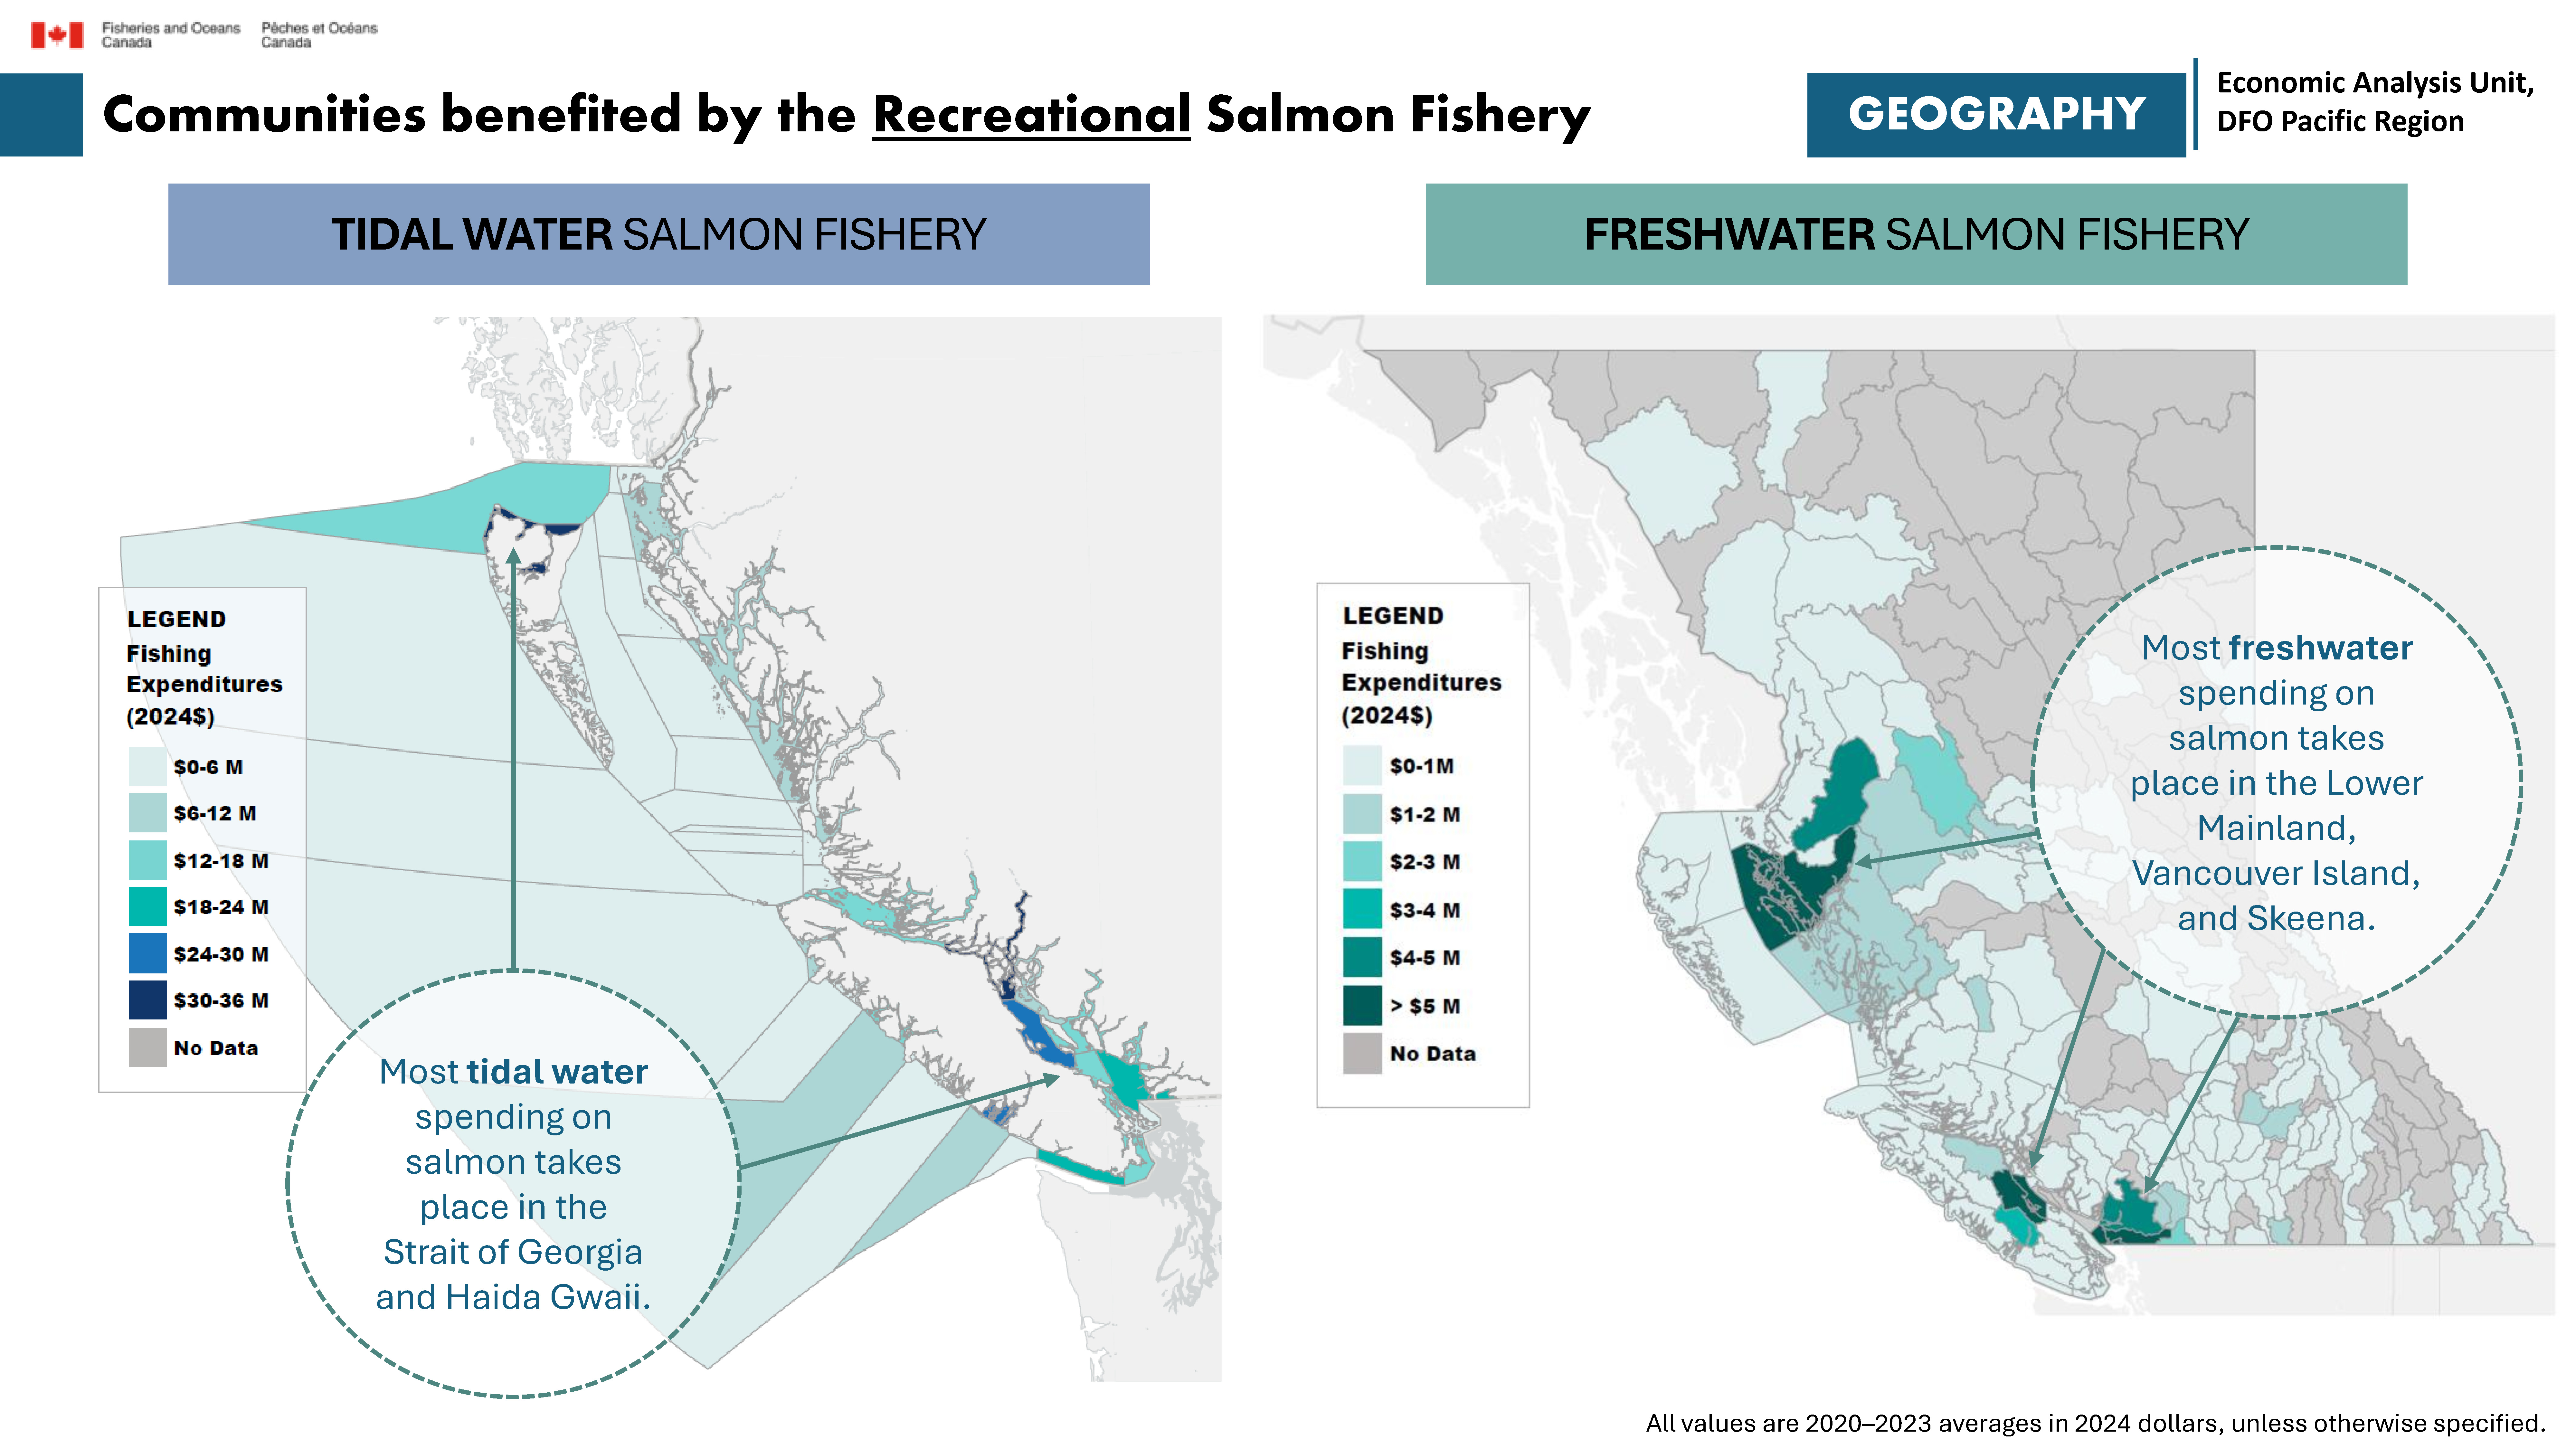
All values are in 2024 dollars.
Tidal water salmon fishery
- Most tidal water spending on salmon takes place in the Strait of Georgia and Haida Gwaii.
Tidal water salmon fishery expenditures range by PFMA
- PFMA 1: $30–36M
- PFMA 2: $0–6M
- PFMA 3: $0–6M
- PFMA 4: $6–12M
- PFMA 5: $0–6M
- PFMA 6: $18–24M
- PFMA 7: $30–36M
- PFMA 8: $0–6M
- PFMA 9: $0–6M
- PFMA 10: $0–6M
- PFMA 11: $0–6M
- PFMA 12: $12–18M
- PFMA 13: $30–36M
- PFMA 14: $24–30M
- PFMA 15: $6–12M
- PFMA 16: $12–18M
- PFMA 17: $6–12M
- PFMA 18: $0–6M
- PFMA 19: $12–18M
- PFMA 20: $18–24M
- PFMA 21: $0–6M
- PFMA 22: $0–6M
- PFMA 23: $24–30M
- PFMA 24: $0–6M
- PFMA 25: $0–6M
- PFMA 26: $0–6M
- PFMA 27: $0–6M
- PFMA 28: $6–12M
- PFMA 29: $18–24M
- PFMA 101: $0–6M
- PFMA 102: $0–6M
- PFMA 103: $0–6M
- PFMA 104: $0–6M
- PFMA 105: $0–6M
- PFMA 106: $0–6M
- PFMA 107: $0–6M
- PFMA 108: $0–6M
- PFMA 109: $0–6M
- PFMA 110: $0–6M
- PFMA 111: $0–6M
- PFMA 121: $0–6M
- PFMA 123: $6–12M
- PFMA 124: $12–18M
- PFMA 125: $6–12M
- PFMA 126: $0–6M
- PFMA 127: $0–6M
- PFMA 130: $0–6M
- PFMA 142: $0–6M
Freshwater salmon fishery
- Most freshwater spending on salmon takes place in the Lower Mainland, Vancouver Island, and Skeena.
Freshwater salmon fishery expenditures by region
- Region 1 (Vancouver Island): >$5M
- Region 2 (Lower Mainland): >$5M
- Region 3 (Thompson-Nicola): $4-5M
- Region 4 (Kootenay): $0-1M
- Region 5 (Cariboo): $3-4M
- Region 6 (Skeena): >$5M
- Region 7 (Omineca-Peace): $0-1M
- Region 8 (Okanagan): $2-3M
Long text version
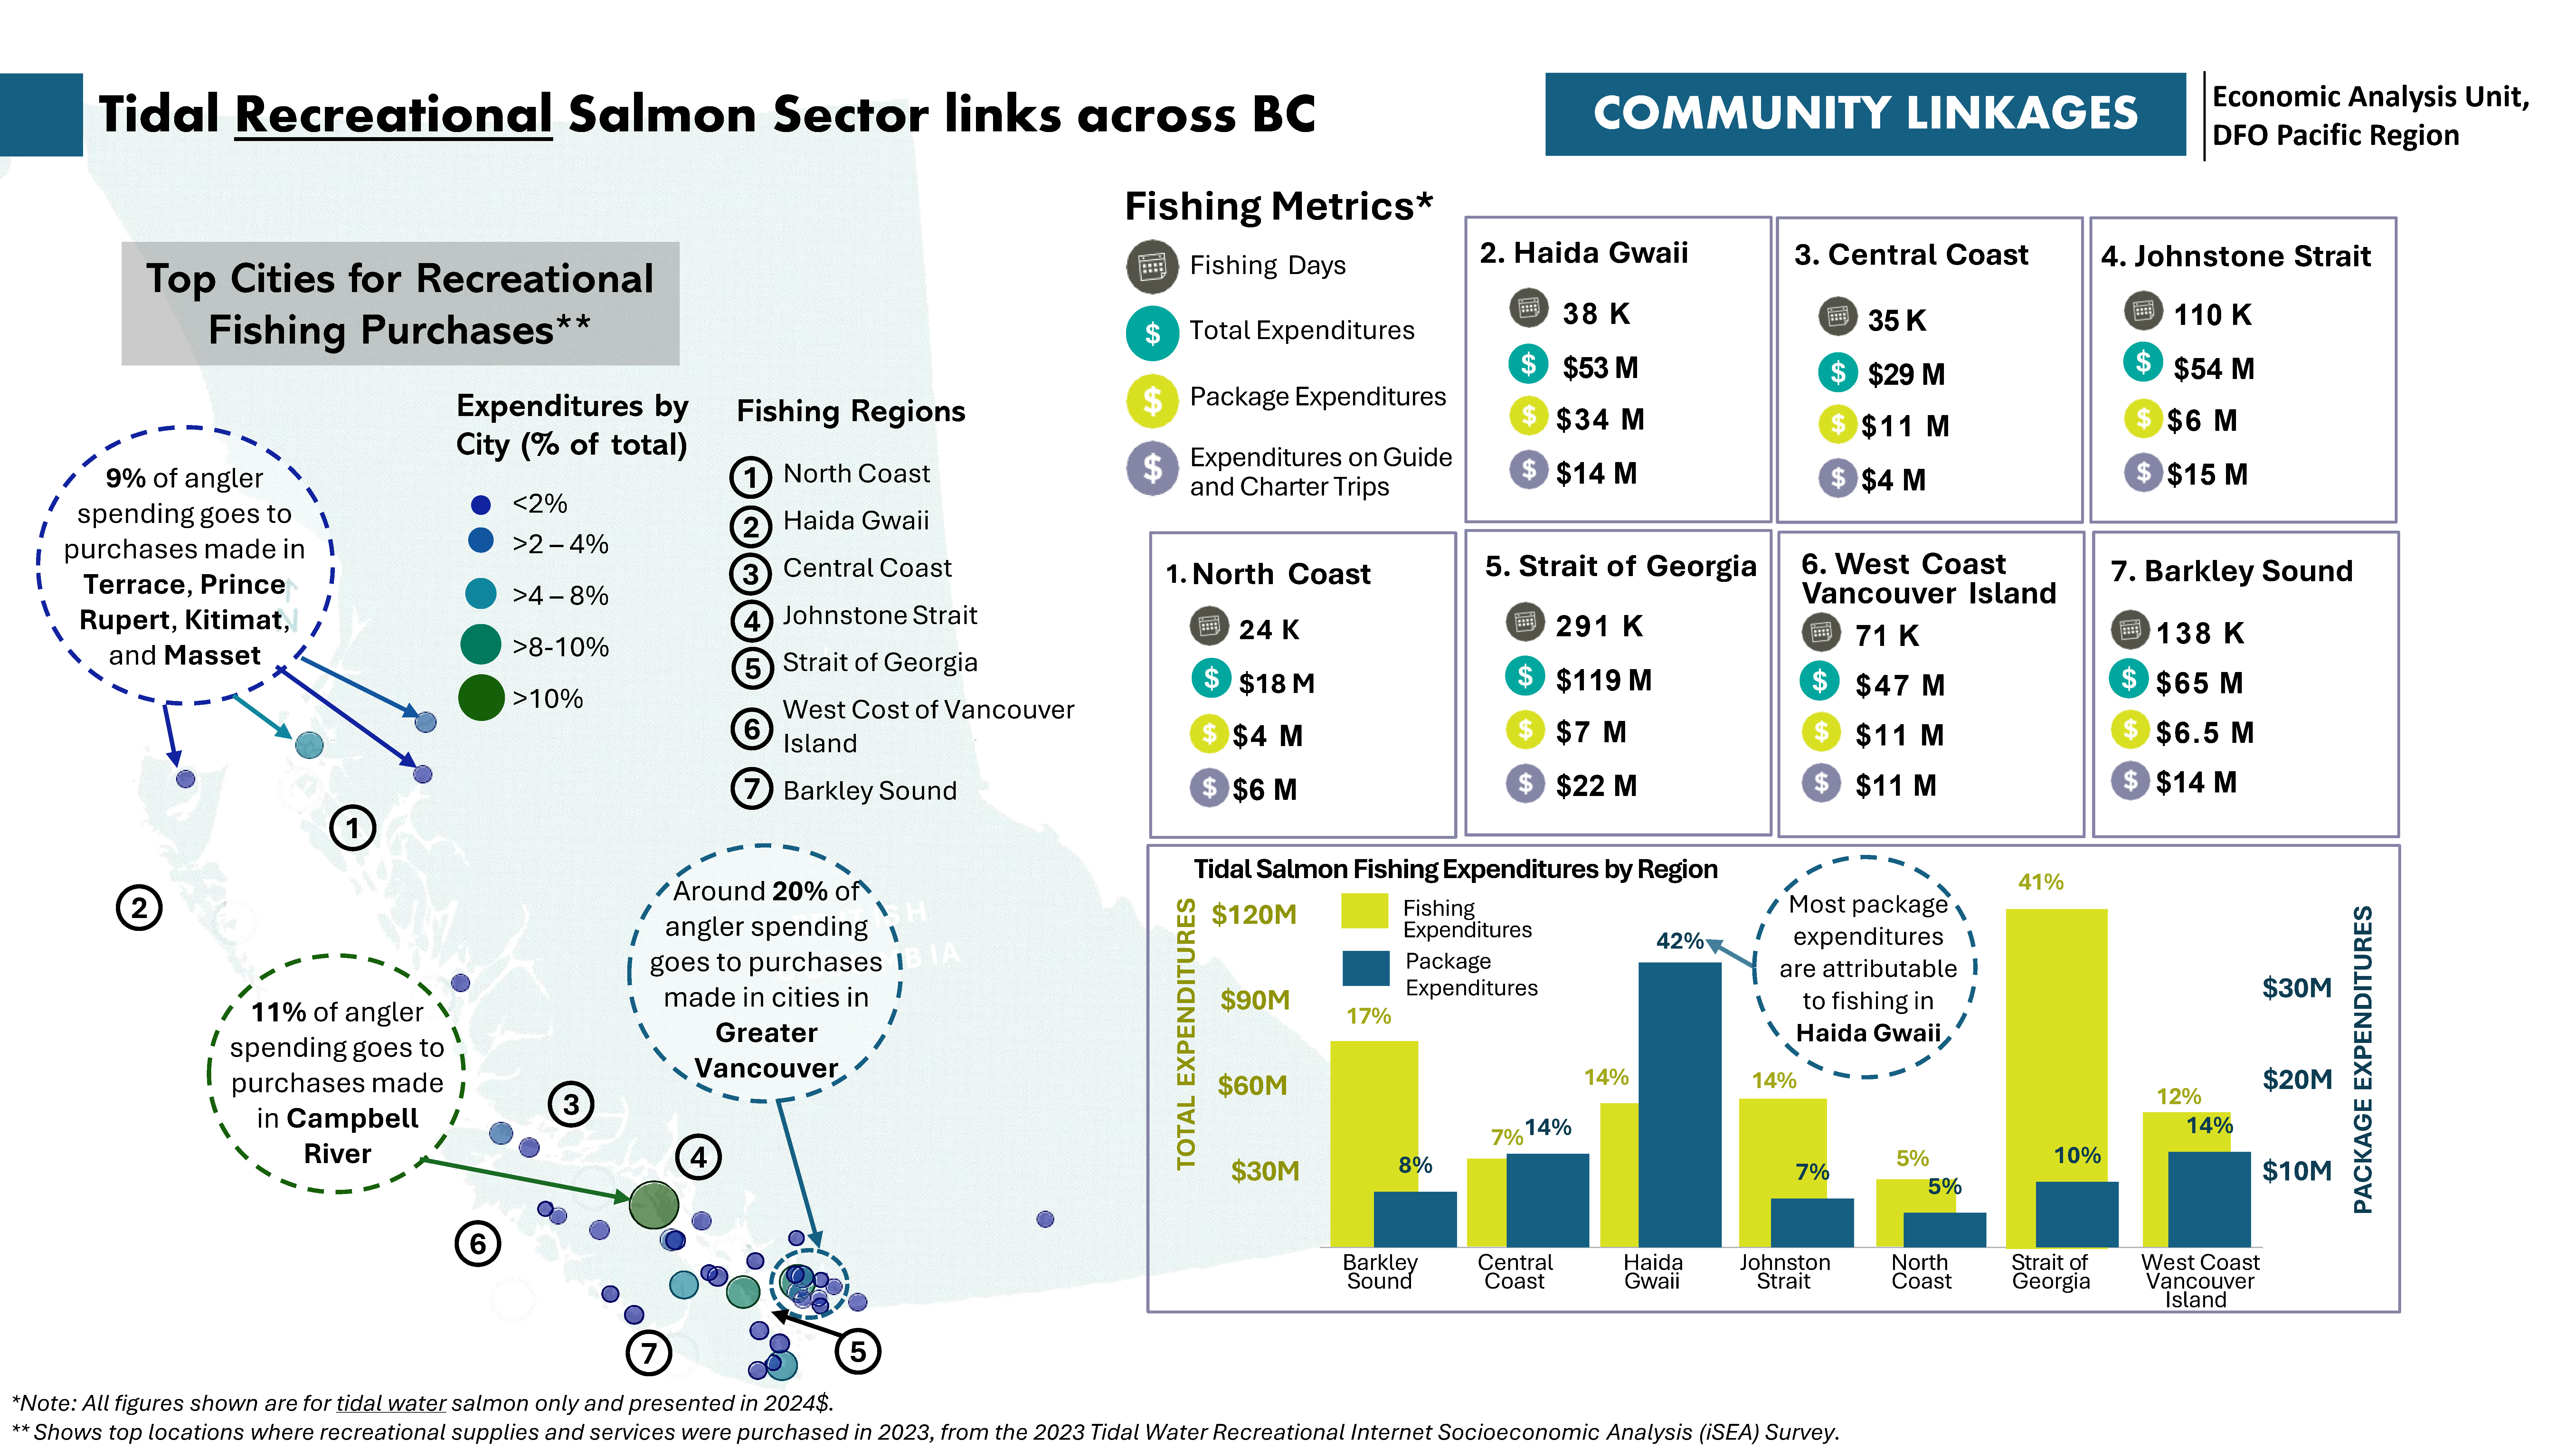
Tidal recreational salmon sector links across BC
Top cities for recreational fishing purchases
Locations are where recreational supplies and services were purchased in 2023, from the 2023 Tidal Water Recreational Internet Socioeconomic Analysis (iSEA) Survey.
- Around 20% of angler spending goes to purchases made in cities in Greater Vancouver.
- 11% of angler spending goes to purchases made in Campbell River.
- 9% of angler spending goes to purchases made in Terrace, Prince Rupert, Kitimat, and Masset.
Expenditures by city with range (% of total)
- >10%
- Campbell River
- >6-8%
- Vancouver
- Nanaimo
- >4-6%
- Victoria
- Port Alberni
- Prince Rupert
- >2-4%
- Port Hardy
- North Vancouver
- Courtenay
- Terrace
- Richmond
- >0-2%
- Abbotsford, Anmore, Bella Bella, Bella Coola, Bowen Island, Burnaby, Burns Lake, Chilliwack, Colwood, Comox, Coquitlam, Cranbrook, Delta, Duncan, Gibsons, Gold River, Kamloops, Kelowna, Kitimat, Ladysmith, Lake Cowichan, Langford, Langley, Lions Bay, Maple Ridge, Masset, Metchosin, Mission, New Westminster, North Cowichan, Parksville, Penticton, Port Alice, Port Clements, Port Coquitlam, Port Edward, Port McNeill, Port Moody, Powell River, Prince George, Qualicum Beach, Queen Charlotte, Saanich, Salmon Arm, Sayward, Sechelt, Sidney, Smithers, Sooke, Squamish, Surrey, Tahsis, Tofino, Ucluelet, Vernon, View Royal, West Vancouver, White Rock, Williams Lake, and Zeballos.
Fishing metrics by fishing region
All figures are for tidal water salmon only and presented in 2024 dollars.
1. North Coast
- Fishing days: 24K
- Total expenditures: $18M
- Package expenditures: $4M
- Expenditures on guide and charter trips: $6M
2. Haida Gwaii
- Fishing days: 38K
- Total expenditures: $53M
- Package expenditures: $34M
- Expenditures on guide and charter trips: $14M
3. Central Coast
- Fishing days: 35K
- Total expenditures: $29M
- Package expenditures: $11M
- Expenditures on guide and charter trips: $4M
4. Johnstone Strait
- Fishing days: 110K
- Total expenditures: $54M
- Package expenditures: $6M
- Expenditures on guide and charter trips: $15M
5. Strait of Georgia
- Fishing days: 291K
- Total expenditures: $119M
- Package expenditures: $7M
- Expenditures on guide and charter trips: $22M
6. West Coast Vancouver Island
- Fishing days: 71K
- Total expenditures: $47M
- Package expenditures: $11M
- Expenditures on guide and charter trips: $11M
7. Barkley Sound
- Fishing days: 138K
- Total expenditures: $65M
- Package expenditures: $6.5M
- Expenditures on guide and charter trips: $14M
Tidal salmon fishing total expenditure and packaged expenditures by fishing region (in 2024$)
Most package expenditures are attributable to fishing in Haida Gwaii.
Barkley Sound
- Total expenditures: $65.4M (17% of total expenditures).
- Package expenditures: $6.6M (8% of package expenditures).
Central Coast
- Total expenditures: $28.9M (7% of total expenditures).
- Package expenditures: $11.0M (14% of package expenditures).
Haida Gwaii
- Total expenditures: $53.0 M(14% of total expenditures).
- Package expenditures: $33.6M (42% of package expenditures).
Johnstone Strait
- Total expenditures: $54.3M (14% of total expenditures).
- Package expenditures: $5.8M (7% of package expenditures).
North Coast
- Total expenditures: $18.4M (5% of total expenditures).
- Package expenditures: $4.1M (5% of package expenditures).
Strait of Georgia
- Total expenditures: $119.4M (41% of total expenditures).
- Package expenditures: $7.7M (10% of package expenditures).
West Coast Vancouver Island
- Total expenditures: $46.6M (12% of total expenditures).
- Package expenditures: $11.2M (14% of package expenditures).
Long text version
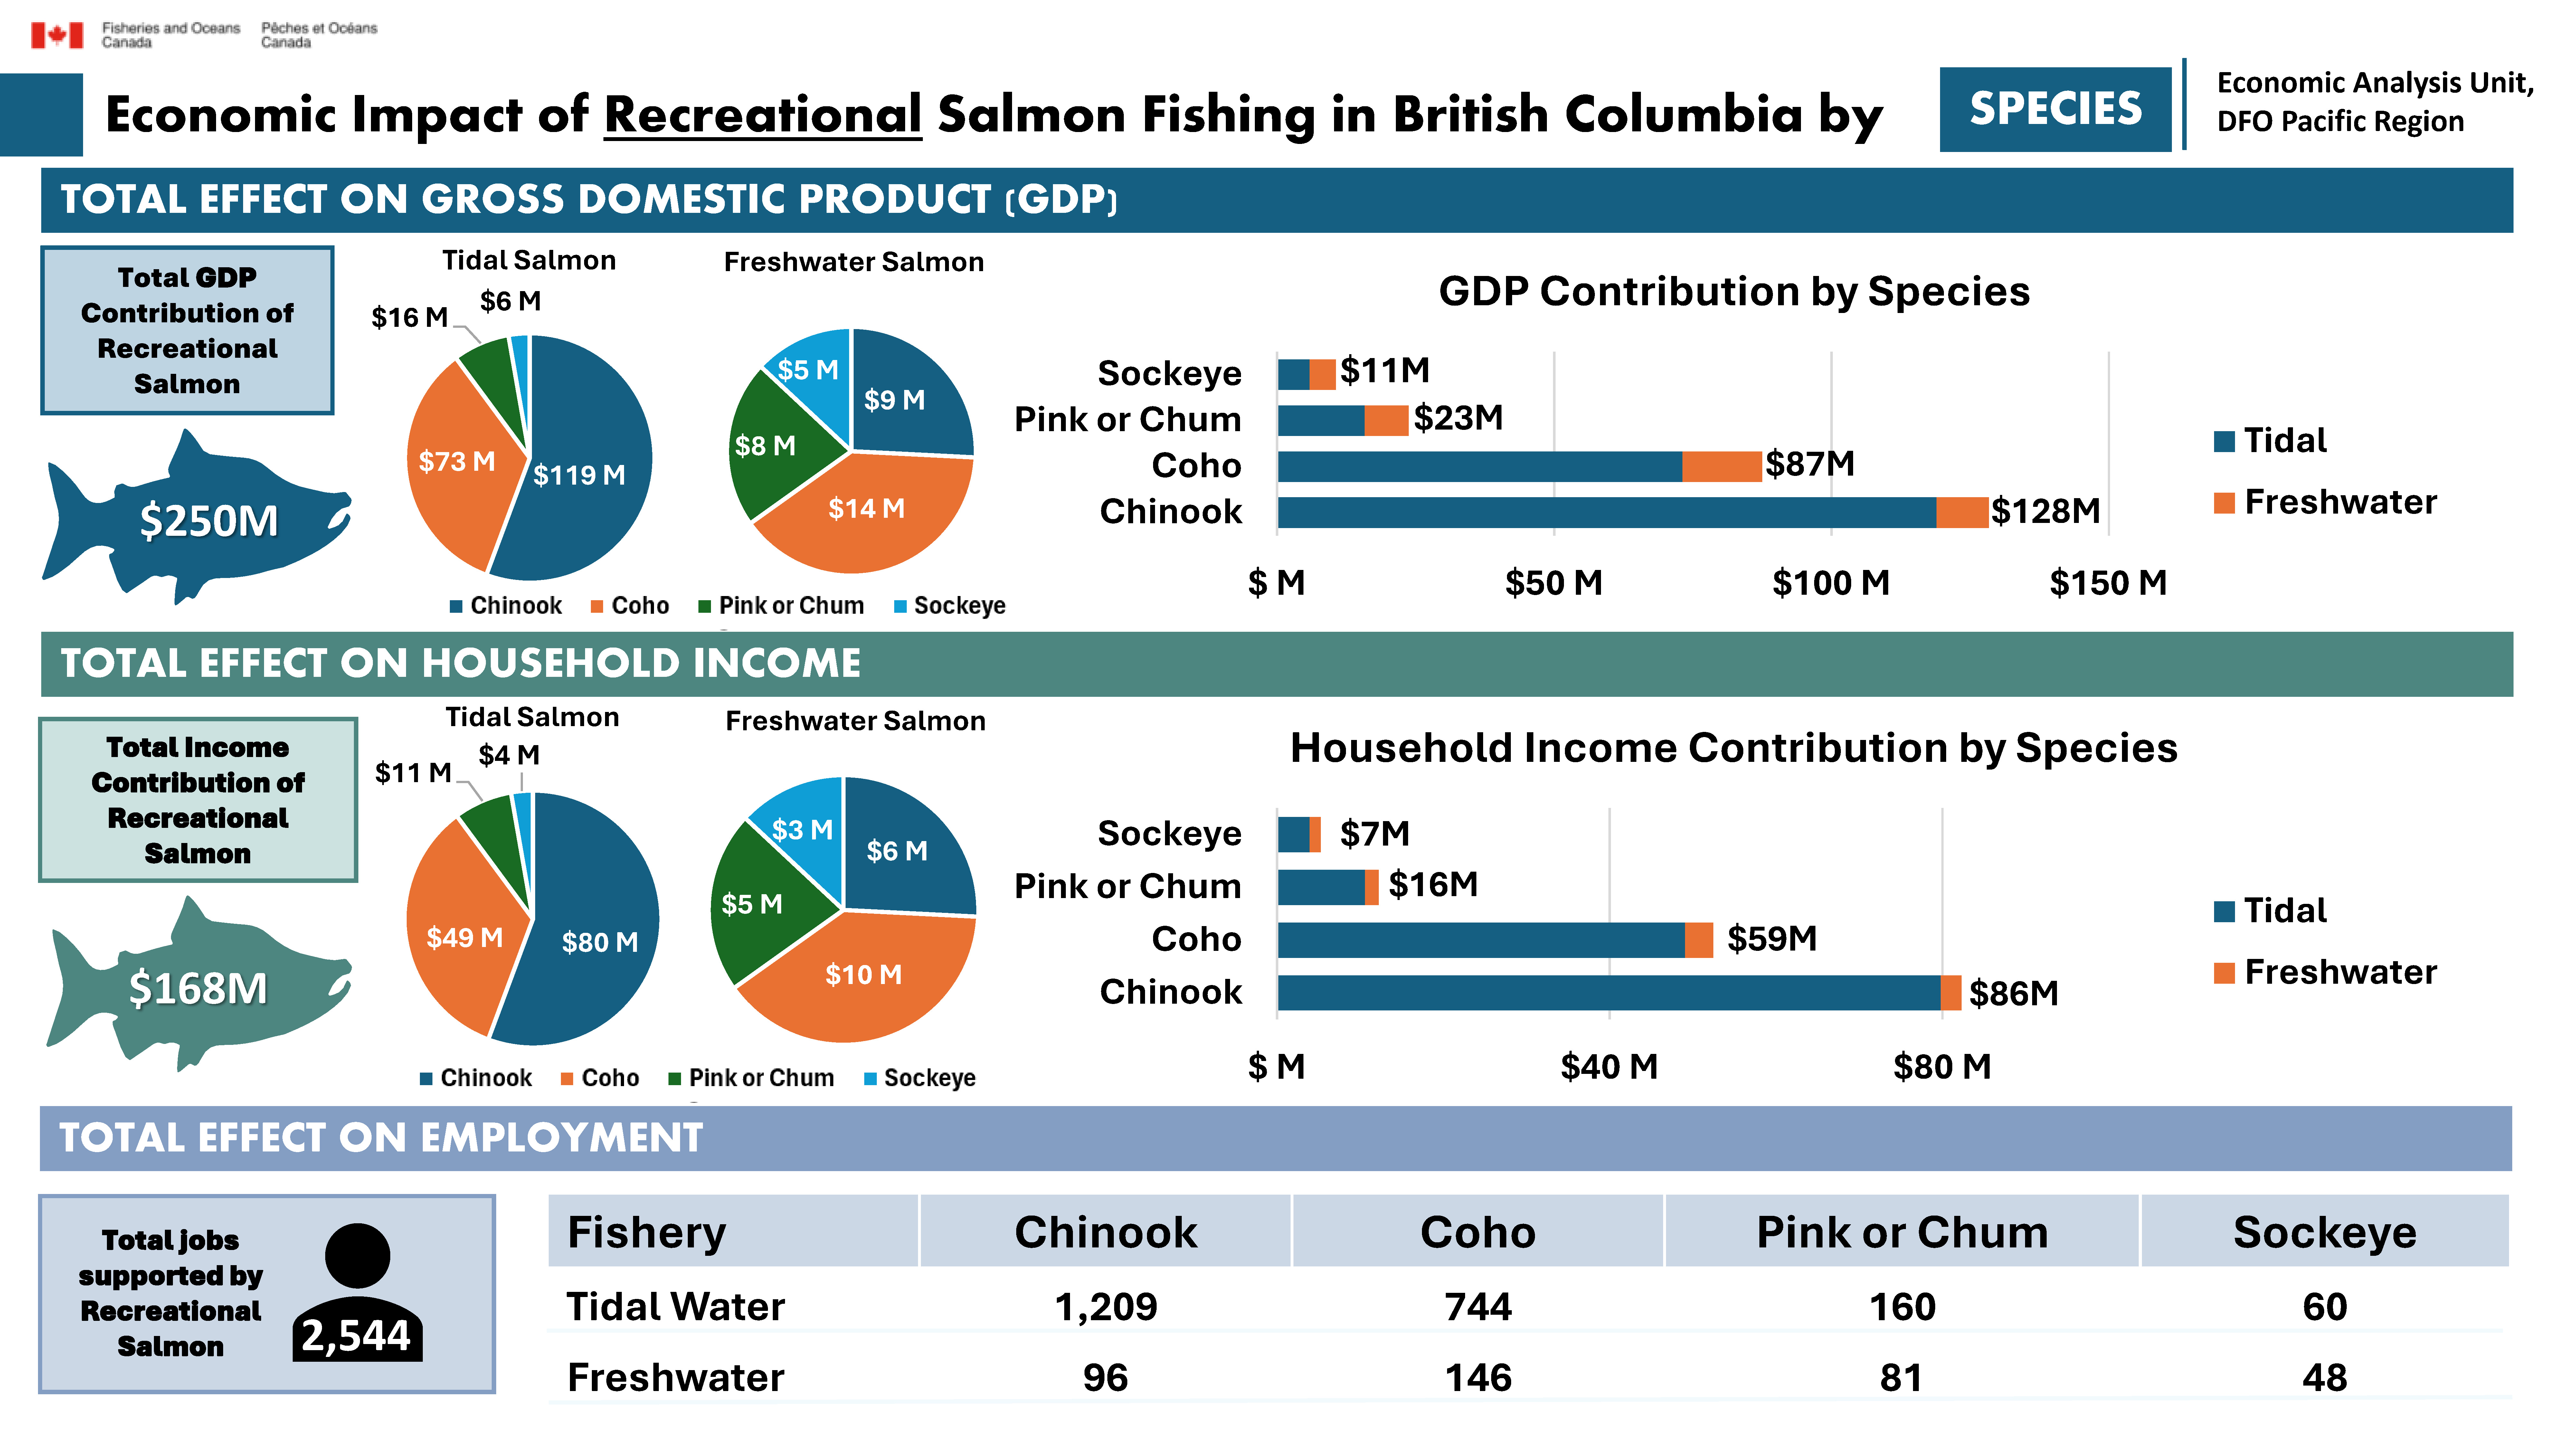
Economic impact of recreational salmon fishing in British Columbia by species
Total effect on gross domestic product (GDP) in 2024$
Total GDP contribution of recreational salmon fishing: $250M
GDP contribution by tidal water fishing by salmon species:
- Chinook: $119M
- Coho: $73M
- Pink or chum: $16M
- Sockeye: $6M
GDP contribution by freshwater fishing by salmon species:
- Chinook: $9M
- Coho: $14M
- Pink or chum: $8M
- Sockeye: $5M
GDP contribution by salmon species:
- Chinook: Tidal water $119M and freshwater $9M for a total of $128M.
- Coho: Tidal water $73M and freshwater $14M for a total of $87M.
- Pink or chum: Tidal water $16M and freshwater $8M for a total of $23M.
- Sockeye: Tidal water $6M and freshwater $5M for a total of $11M.
Total effect on household income
Total income contribution of recreational salmon fishing: $168M
Household income contribution by tidal water fishing by salmon species:
- Chinook: $80M
- Coho: $49M
- Pink or chum: $11M
- Sockeye: $4M
Household income contribution by freshwater fishing by salmon species:
- Chinook: $6M
- Coho: $10M
- Pink or chum: $5M
- Sockeye: $3M
Household income contribution by salmon species:
- Chinook: Tidal water $80M and freshwater $6M for a total of $86M.
- Coho: Tidal water $49M and freshwater $10M for a total of $59M.
- Pink or chum: Tidal water $11M and freshwater $5M for a total of $16M.
- Sockeye: Tidal water $4M and freshwater $3M for a total of $7M.
Total effect on employment
Total jobs supported by recreational salmon fishing: 2,544
Employment by tidal water fishery by species:
- Chinook: 1,209 jobs
- Coho: 744 jobs
- Pink or chum: 160 jobs
- Sockeye: 60 jobs
Employment by freshwater fishery by species:
- Chinook: 96 jobs
- Coho: 146 jobs
- Pink or chum: 81 jobs
- Sockeye: 48 jobs
Methodology
Active fisher: an individual who fished in the corresponding fishing season.
Fishing day: a day or part of a day on which an individual fished for recreation.
Direct expenditures: expenditures on goods and services (food, camping, accommodation, transportation, supplies, etc.) incurred during fishing trips or excursions.
Major purchases: the purchase of durable goods and investments in support of recreational fishing activities. These include boats, motors, special vehicles, camping gear and other durable goods, as well as land and building purchases. Respondents reported the total purchase price as well as the percentage which the respondent felt was directly attributable to recreational fishing. In this report, only purchases attributable to recreational fishing are presented.
Package expenditures: monies paid to a lodge or outfitter for a complete range of services such as lodging, food, transportation, use of fishing equipment, etc.
The primary data source used for this report was the Internet Socioeconomic Analysis (iSEA) Survey of Recreational Fishing in British Columbia. This survey is administered by DFO Pacific and collects socioeconomic information on tidal water and freshwater recreational fishing activity in British Columbia (BC). The tidal survey has annually collected information on fishing activity for the 2020, 2021, 2022, and 2023 seasons. The freshwater survey has collected information for the 2022, 2023, and 2024 seasons. More information on these surveys and the data collected is available at the links below:
- Tidal water survey: https://www.pac.dfo-mpo.gc.ca/analyses-econom-analysis/report-program-rapport/rec-tidal-maree-eng.html
- Freshwater: https://www.pac.dfo-mpo.gc.ca/analyses-econom-analysis/report-program-rapport/rec-fresh-douce-eng.html
The figures presented in this report represent average salmon angler effort and expenditure values. Tidal estimates show average recreational salmon activity in BC tidal waters for 2021 to 2023. The results from the 2020 survey were not included due to significant impacts of Covid-19 on recreational fishing.
Freshwater estimates show average recreational salmon activity in BC freshwaters for 2022 to 2024. No freshwater angler data is available prior to 2022.
All dollar metrics presented in this report are shown in 2024 dollars (2024$).
Throughout this report, fishing expenditures refer to the sum of direct expenditures, major purchases, and package expenditures reported in the corresponding survey year.
GDP, household income, and jobs statistics were calculated using multipliers from British Columbia’s Fisheries and Aquaculture Sector Report (Lillian Hallin, 2024). The GDP shares attributable to each sector displayed on page 3 also come directly from this report. This report is available from the government of British Columbia’s website:
Data
Related links
- Date modified: