
Shrimp trawl fishery
The following profile provides the socioeconomic context of the shrimp trawl fishery in British Columbia. It includes an overview of the commercial sector. This overview is based on data collected from DFO commercial harvest logbooks and sale slips, public reports, and DFO surveys on harvest prices.
Long text version
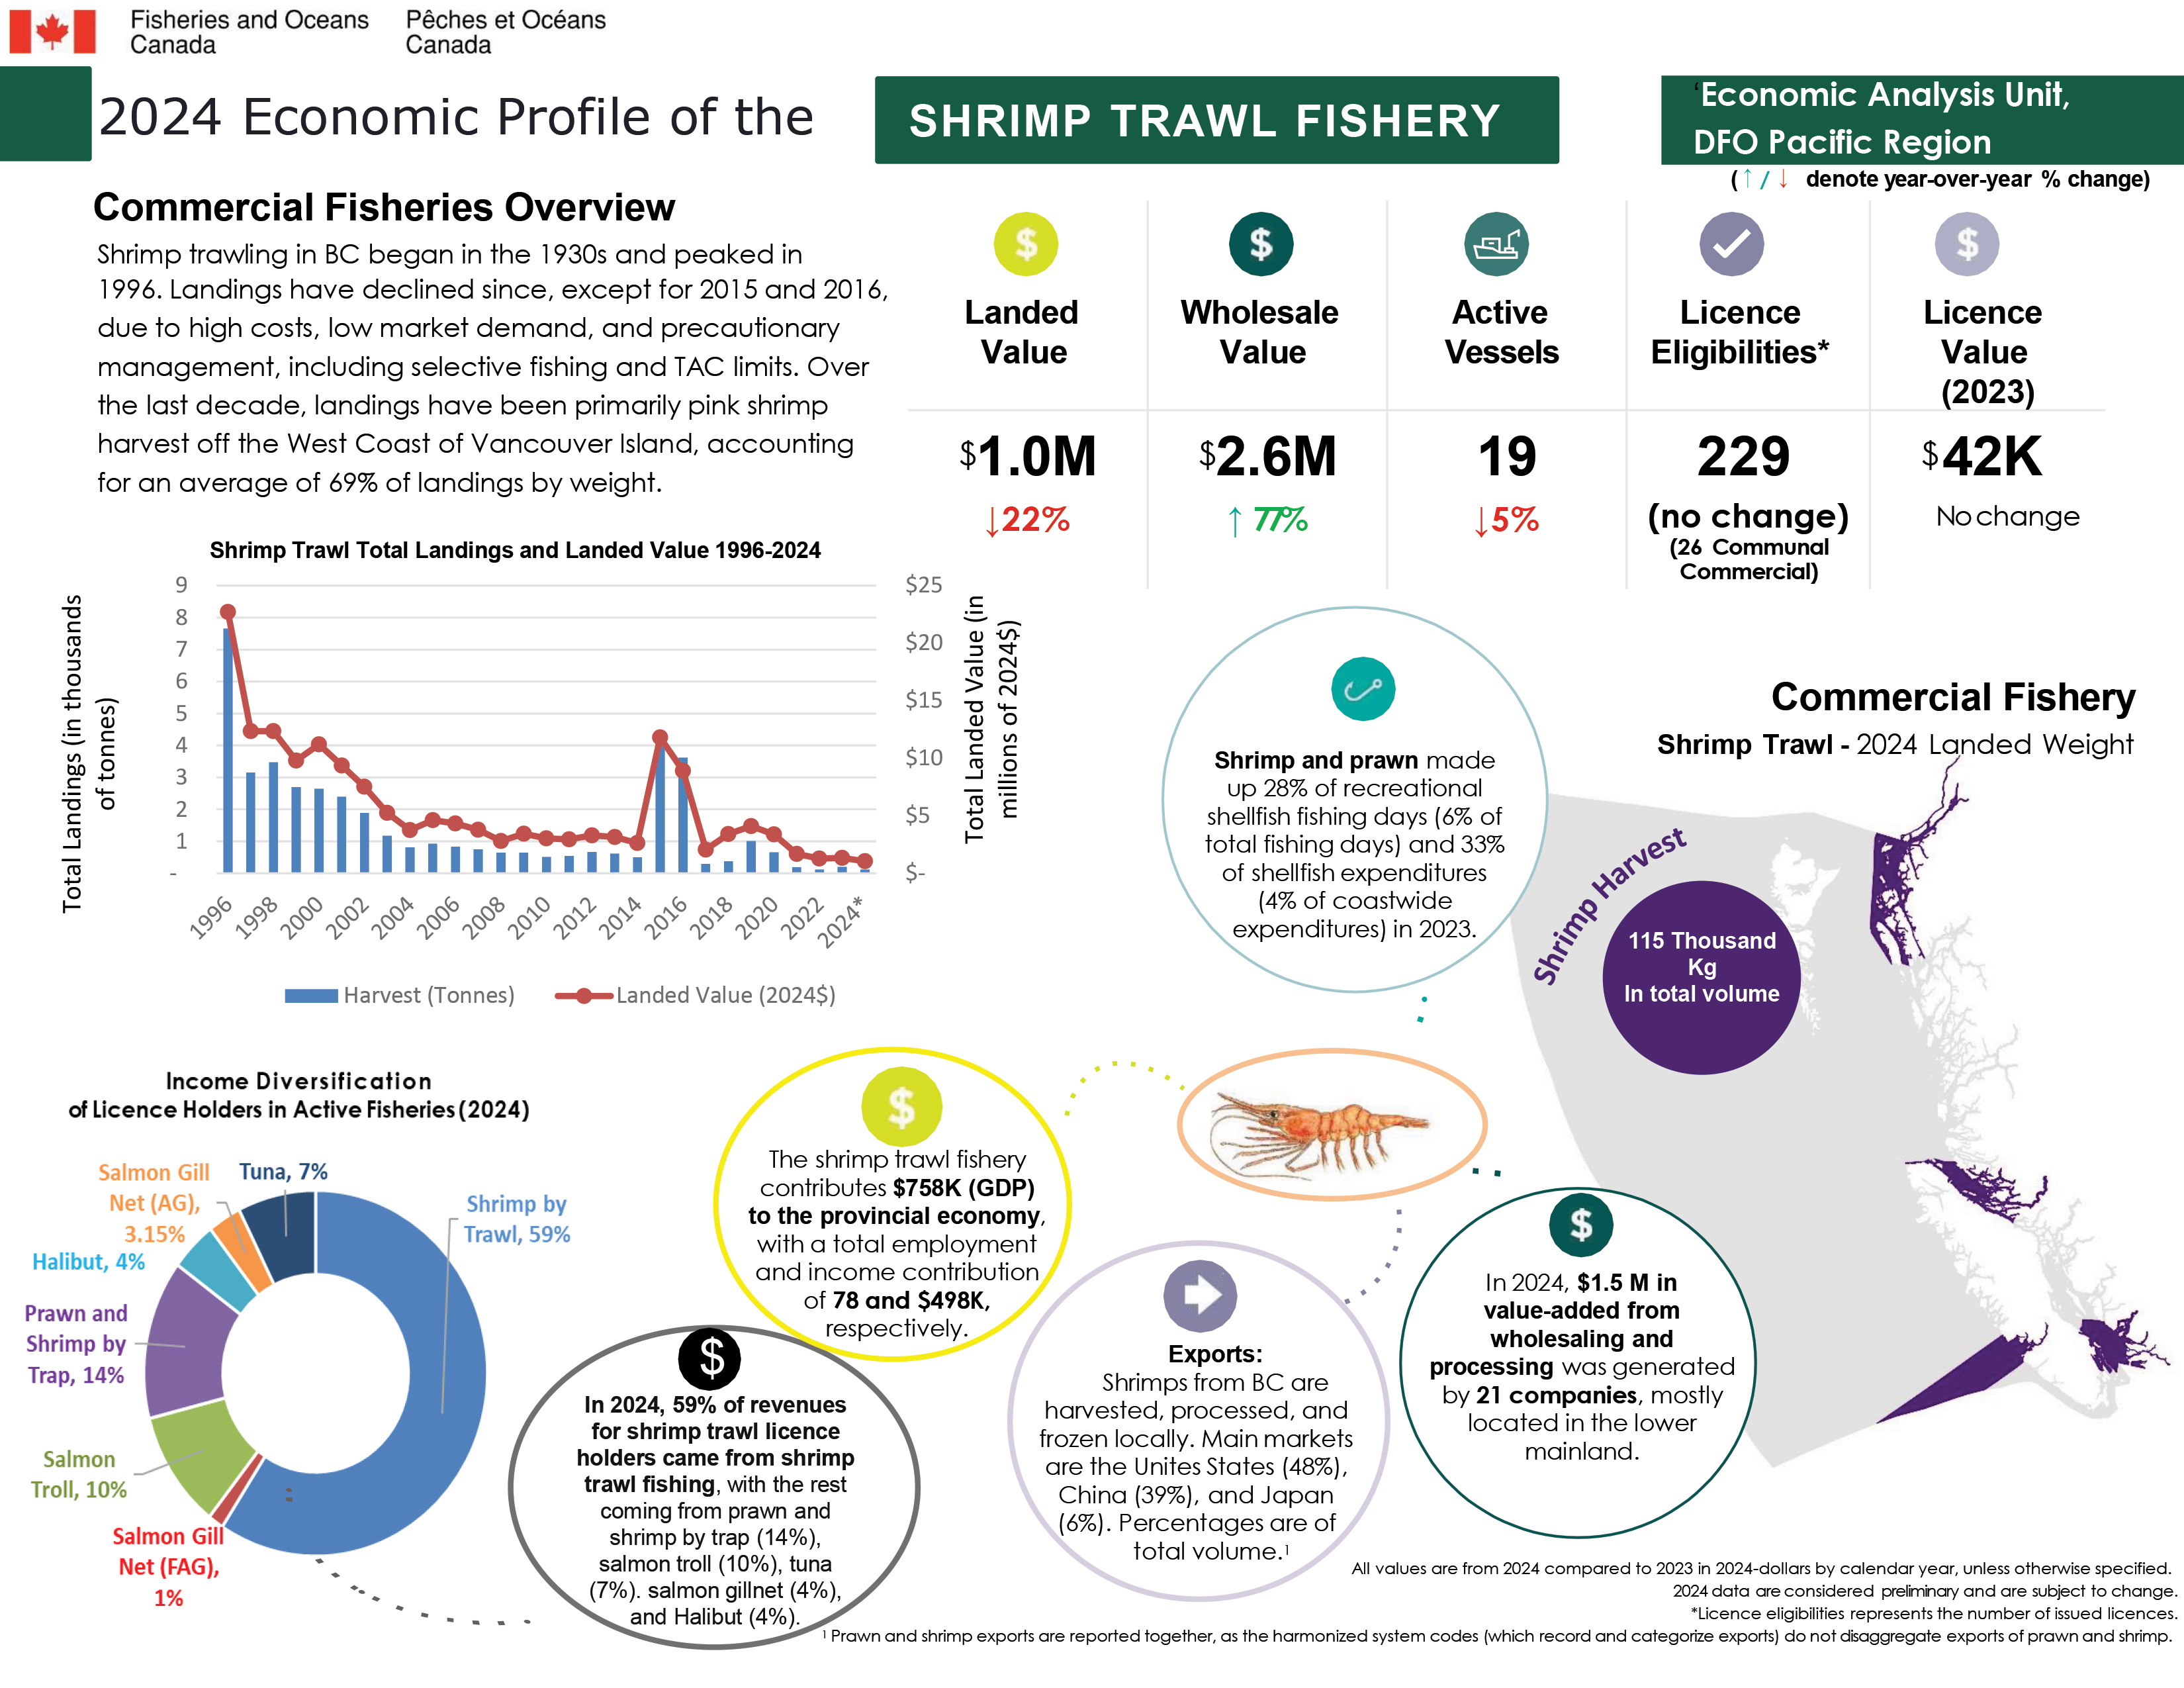
2024 Economic profile of the shrimp trawl fishery
Commercial fisheries overview
Shrimp trawling in BC began in the 1930s and peaked in 1996. Landings have declined since, except for 2015 and 2016, due to high costs, low market demand, and precautionary management, including selective fishing and Total Allowable Catch (TAC) limits. Over the last decade, landings have been primarily pink shrimp harvest off the West Coast of Vancouver Island, accounting for an average of 69% of landings by weight.
All values are from 2024 compared to 2023 in 2024-dollars by calendar year, unless otherwise specified.
Key metrics for the shrimp trawl fishery, all values are from 2024 and in 2024 dollars:
- Landed value ($1.0M), decreased by 22% since 2023.
- Wholesale value ($2.6M), increased by 77% since 2023.
- Active vessel (19), decreased by 5% since 2023.
- Licence eligibilities (229, no change since 2022), 26 of these are communal commercial licences. Licence eligibilities represents the number of issued licences.
- Licence value ($42K in 2023), no change since 2022.
2024 data are considered preliminary and are subject to change.
Annual shrimp trawl landings (in metric tonnes) and value (in 2024 dollars)
Harvest (in tonnes)
- 1996 - 7,657 t
- 1997 – 3,149 t
- 1998 – 3,472 t
- 1999 – 2,700 t
- 2000 – 2,651 t
- 2001 – 2,397 t
- 2002 – 1,886 t
- 2003 – 1,777 t
- 2004 – 817 t
- 2005 – 927 t
- 2006 – 833 t
- 2007 – 754 t
- 2008 – 643 t
- 2009 – 644 t
- 2010 – 515 t
- 2011 – 545 t
- 2012 – 672 t
- 2013 – 621 t
- 2014 – 506 t
- 2015 – 4,355 t
- 2016 – 3,619 t
- 2017 – 297 t
- 2018 – 383 t
- 2019 – 1,006 t
- 2020 – 656 t
- 2021 – 190 t
- 2022 – 116 t
- 2023 – 201 t
- 2024 – 115 t
Landed value (in 2024$)
- 1996 - $22.7M
- 1997 - $12.4M
- 1998 - $12.4M
- 1999 - $9.8M
- 2000 - $11.2M
- 2001 - $9.4M
- 2002 - $7.5M
- 2003 - $5.3M
- 2004 - $3.7M
- 2005 - $4.6M
- 2006 - $4.3M
- 2007 - $3.7M
- 2008 - $2.8M
- 2009 - $3.4M
- 2010 - $3.0M
- 2011 - $2.9M
- 2012 - $3.3M
- 2013 - $3.1M
- 2014 - $2.6M
- 2015 - $11.8M
- 2016 - $8.9M
- 2017 - $2.1M
- 2018 - $3.4M
- 2019 - $4.0M
- 2020 - $3.4M
- 2021 - $1.7M
- 2022 - $1.3M
- 2023 - $1.3M
- 2024 - $1.0M
Commercial fishery shrimp trawl - 2024 landed weight map
- Shrimp harvest: 115 thousand kilograms in total volume
Income diversification of licence holders in active fisheries (2024)
In 2024, 59% of revenues for shrimp trawl licence holders came from shrimp trawl fishing, with the rest coming from prawn and shrimp by trap (14%), salmon troll (10%), tuna (7%), salmon gillnet (4%), and halibut (4%).
Exports: Shrimps from BC are harvested, processed, and frozen locally. Main markets are USA (48%), China (39%) and Japan (6%). Percentages are of total volume.
Prawn and shrimp exports are reported together, as the harmonized system codes (which record and categorize exports) do not disaggregate exports of prawn and shrimp.
In 2024, $1.5M in value-added from wholesaling and processing was generated by 21 companies, mostly located in the Lower Mainland.
The shrimp trawl fishery contributes $758K (GDP) to the provincial economy, with a total employment of 78 jobs and income contribution of $498K.
Shrimp and prawn made up 28% of recreational shellfish fishing days in 2023 (6% of total fishing days) and 33% of shellfish expenditures (4% of coastwide expenditures) in 2023.
The tidal water recreational fishing survey data is not available for 2024.
Data
The commercial data and the recreational data that informed this work can be downloaded here.
- Date modified: